Blog

Live Mode: Data With Context, But Even Faster

During our Hubble Launch, we announced a set of Explorers to give users a new way to access their data in Observe. As part of that launch, we introduced Live Mode for Log Explorer. Now we’re happy to announce that Live Mode is generally available (GA) for both Log and Metric Explorer. Observe offers unprecedented data retention for a historical view of your environment, but when troubleshooting an incident, you need to respond fast, and that requires in-the-moment data. That’s why we’ve introduced Live Mode.
What is Live Mode?
Under the hood, Observe periodically precomputes the latest contents of datasets in order to make queries as fast and efficient as possible. We call this process Acceleration. Acceleration runs continuously via a set of background queries called Transforms. Transform queries periodically compute and update datasets using newly available data. While you can query the raw data in Observe, acceleration makes subsequent queries fast and cheap.
What determines how often Transforms run? In Observe, each dataset has a configurable freshness goal per dataset. Observe continually re-accelerates data to ensure the data you query is always as fresh as your freshness goal. Live Mode for Log Explorer and Metric Explorer allows you to query data in near real-time by temporarily tightening the freshness goals for the datasets in your query. The result: supercharged freshness . Live mode brings down the end-to-end latency of new data arriving at Observe and showing up on your screen to as low as 20 seconds.
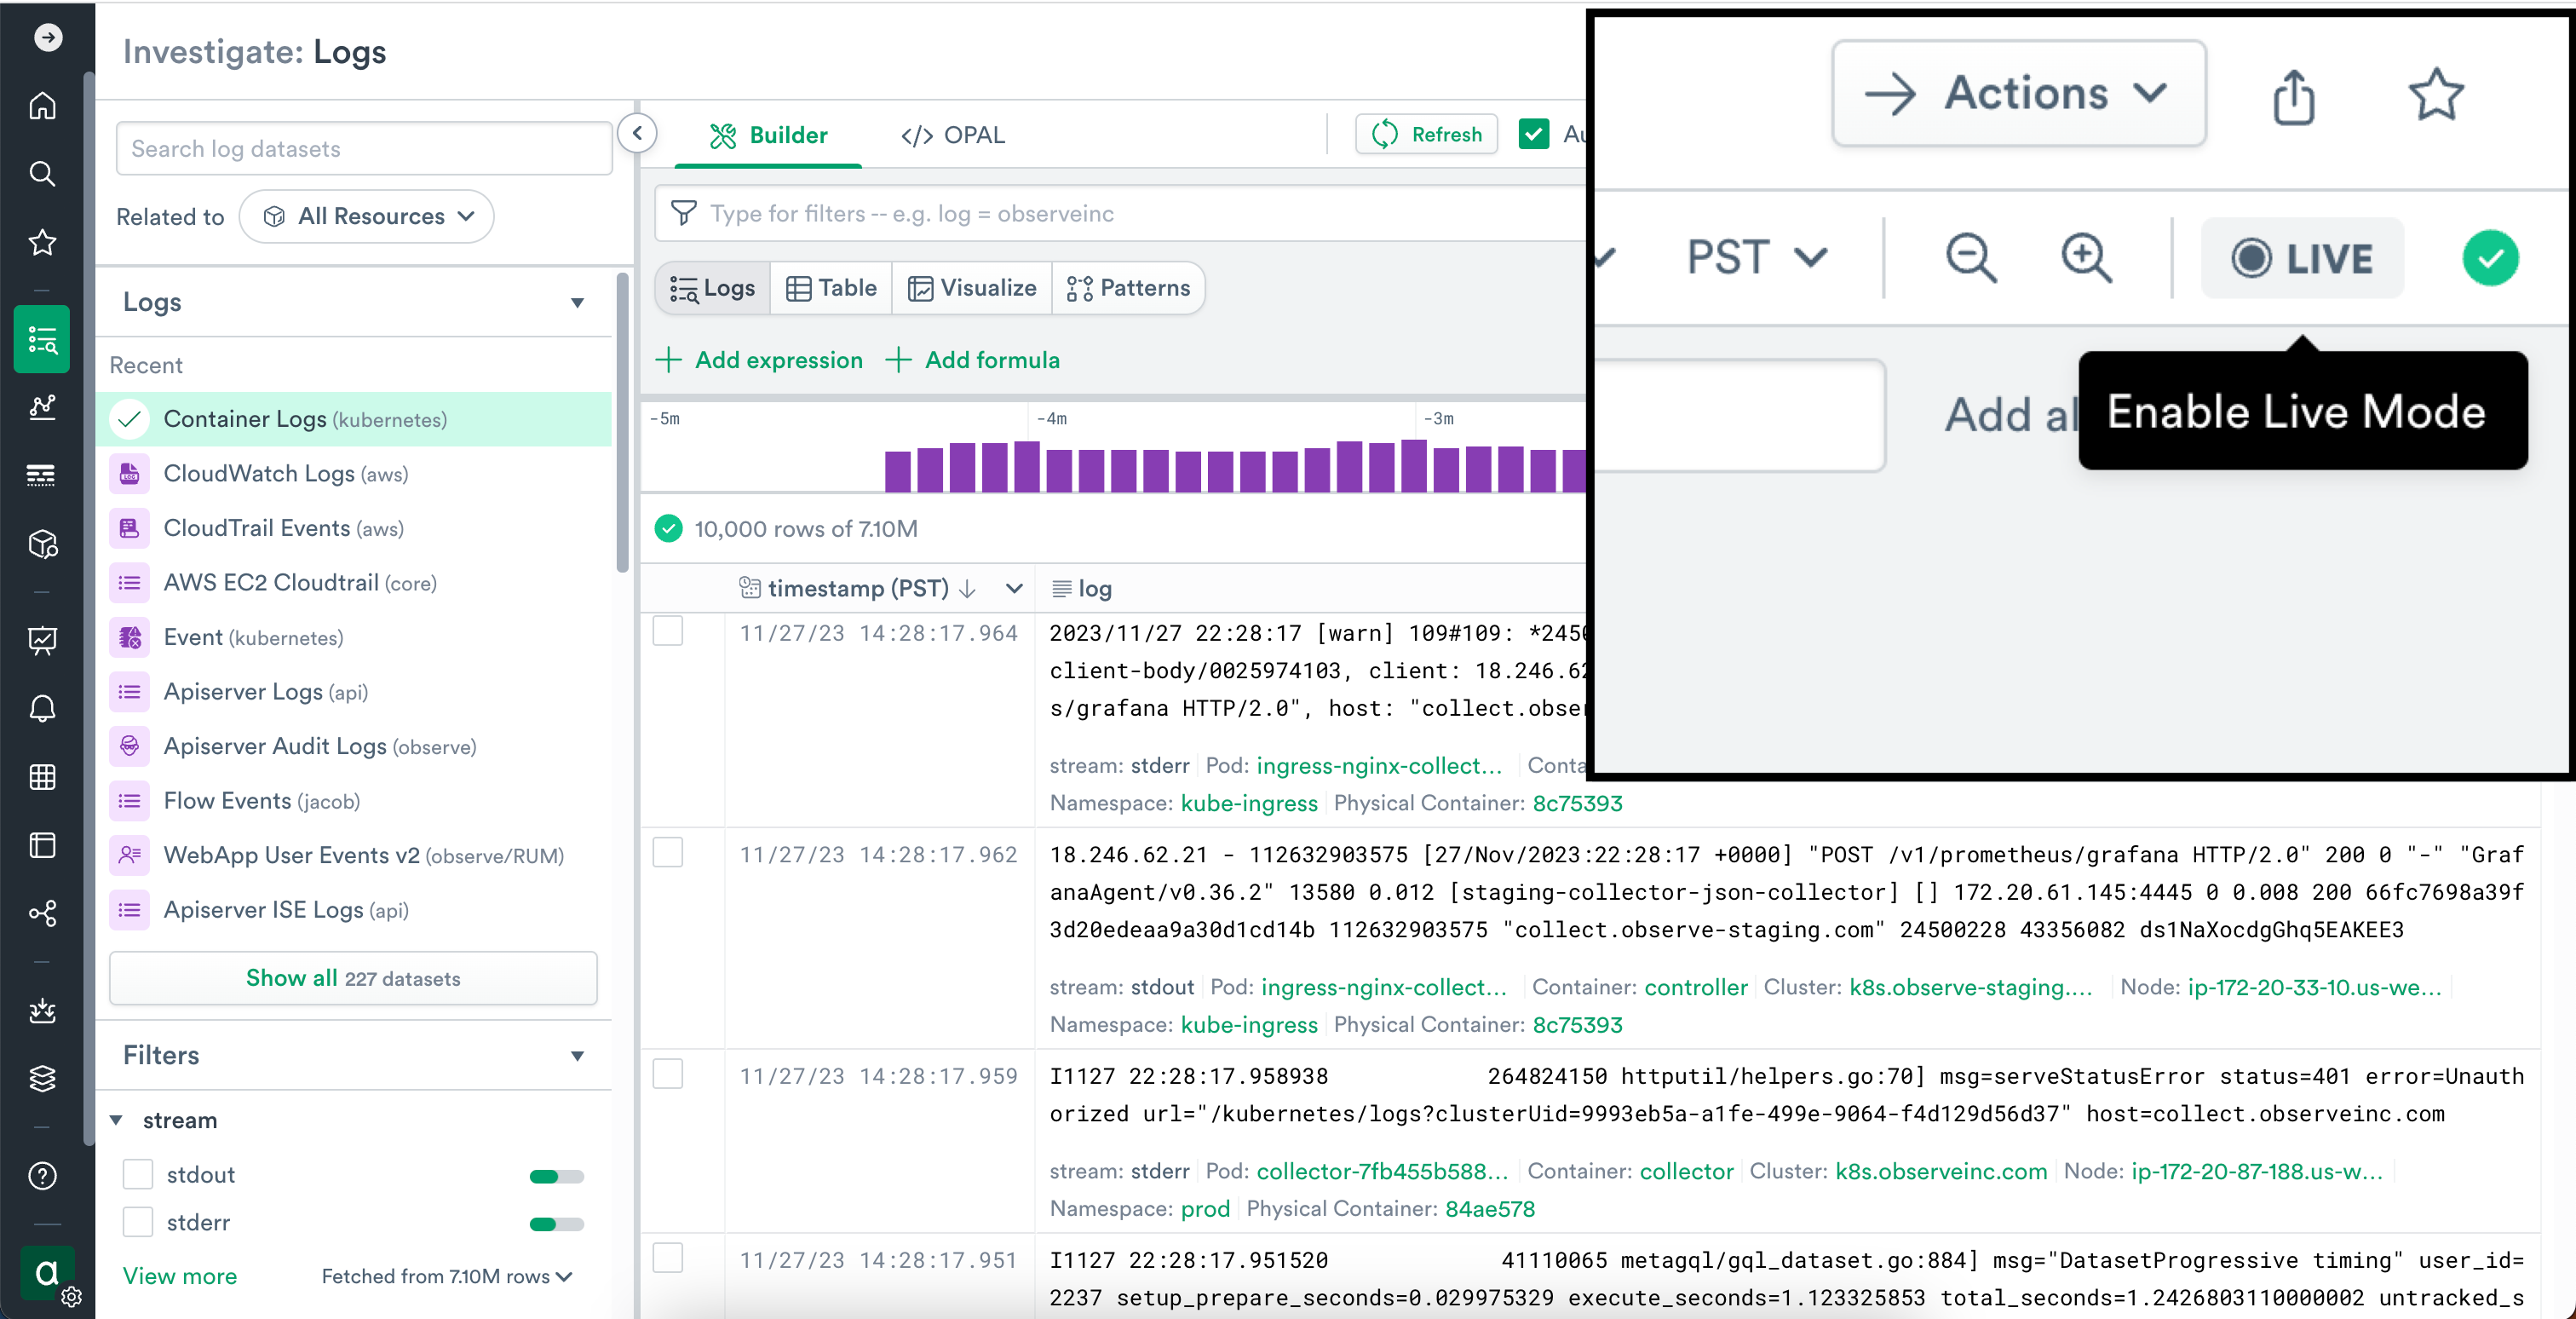
Live Mode for Log Explorer
Now, when you open the Log Explorer view you’ll notice the Live button to the upper right of the page. This button toggles Live Mode on and off. Want to see your logs stream in continuously? Now you can. No longer need to stream in the latest logs? Just turn off Live Mode. You can filter these logs and generate visualizations that continuously update with new data. The exact latency varies by dataset, but most Datasets can achieve an end-to-end latency of as little as 20 seconds.
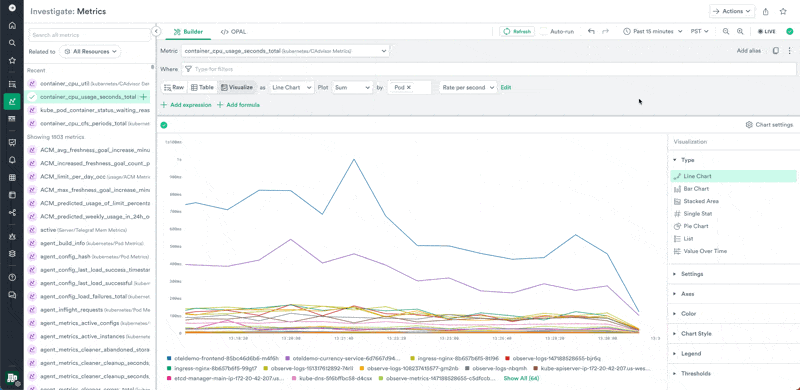
Live Mode for Metric Explorer
You can now also toggle a “Live” feature when viewing metrics in Metric Explorer to see new metric data stream in continuously. Just like with Logs, the exact latency varies by query, but most metric queries should achieve an end-to-end latency as low as 30 seconds. This means while troubleshooting issues, you can get near instant feedback on your metric data to assess if changes are working as expected.
Get Speed And Context In One Place
Live Mode on its own is great for getting data faster for live debugging scenarios. However, it’s even better when you consider that Live Mode is built on top of our Data Lake and Data Graph. The Observability Cloud architecture allows us to pull multiple data sources into a single backend and link them together, something other tools can not do. Not only can you query data quickly, but you can pivot from one data type to another to pinpoint the root cause. The combination of the context Observe provides via the Data Graph and the ability to query data within seconds of ingestion produces unprecedented visibility into your systems.
Speed and context together is a game changer compared to legacy siloed tooling where speed alone can get your search to a dead end quickly. In the image below, see how you can apply a filter to find errors and then turn on Live Mode to get a constant stream of data. From the error log data, you can jump directly to the container which is causing most of the errors.

Do you like the sound of having in-the-moment data, with the contextual insights of the Data Graph? Get started with the free trial of Observe today, or contact us to learn more about our usage-based pricing plan and Live Mode.


