
Troubleshooting database performance with Observe APM

In today's microservice architectures, database performance issues can be notoriously difficult to diagnose. One of the most common yet challenging problems developers face is the n+1 query pattern — a performance anti-pattern where an application makes n+1 database queries instead of a single, more efficient query. This seemingly small inefficiency can cascade into significant performance bottlenecks, especially under load.
When users report slow checkouts or your monitoring alerts you to increasing latency, identifying the root cause can feel like searching for a needle in a haystack. Is it network congestion? A bottleneck in your application logic? Or perhaps a database issue?
Observe APM now offers a streamlined workflow to diagnose these scenarios, allowing you to quickly identify and resolve database performance issues before they impact your customers. Let's walk through a real-world example of how Observe APM helps you pinpoint and troubleshoot a classic n+1 query problem.
Solving the n+1 query problem with Observe
Here's how you can use Observe APM to detect n+1 issues and other types of database slowness in your distributed service.
Let's say you're a developer building an online store and you're investigating abnormal latency in the checkout service. Inspect the checkout service in Observe APM and see from the latency distribution that there are some outliers, and from the performance breakdown chart that there's a major spike in latency starting a few minutes ago.
View the performance breakdown by downstream service to see that most of the time spent in the checkout service is actually waiting for the cart service to return a response:

Navigate to the downstream cart service from the service map for the checkout service. The cart service is also experiencing a latency spike in the last few minutes:

View the performance breakdown by operation to see that most of the time spent in the cart service is LREM operations in Redis:

Narrow down the degradation further to a single endpoint, namely the `EmptyCart` endpoint in the cart service, which had a spike in latency in the last few minutes, unlike the other two endpoints in the cart service whose latency remains stable. The performance breakdown of the `EmptyCart` endpoint reveals that the latency spike can be explained by LREM operations in Redis, which means we've narrowed down the issue to just this endpoint:

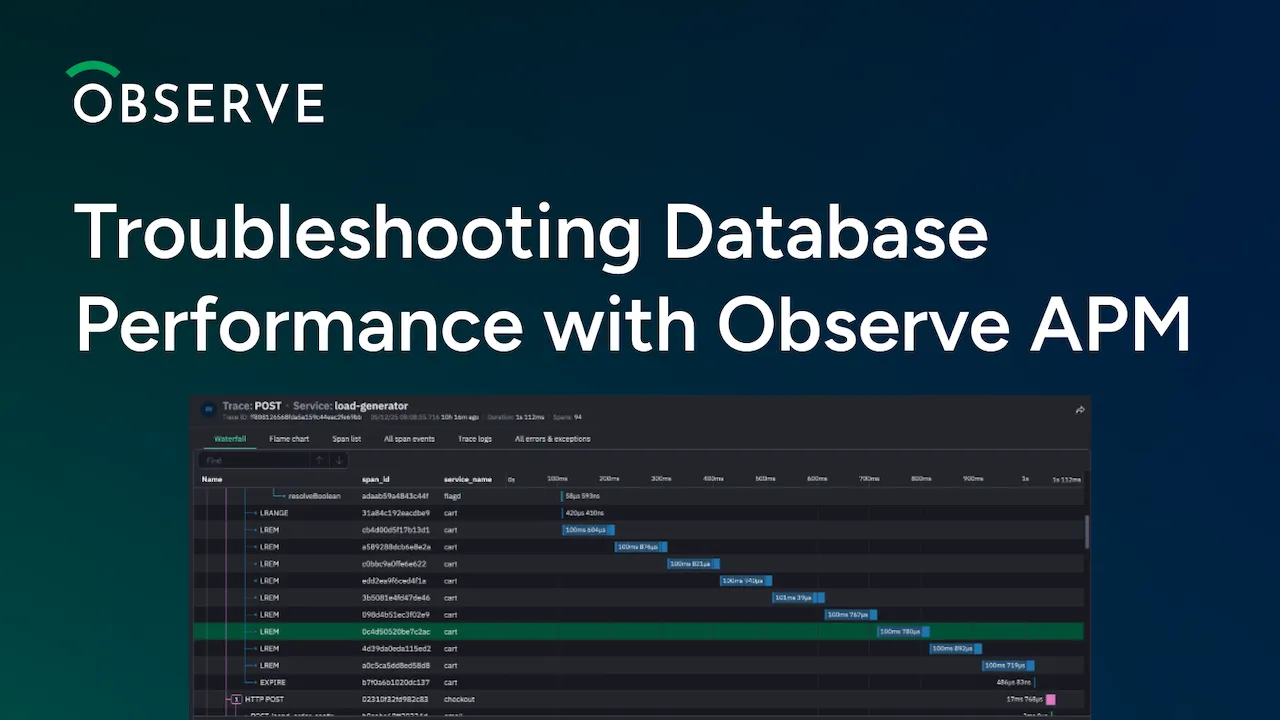
It's time to look at slow traces for the `EmptyCart` endpoint. The traces tab in the endpoint inspector is automatically filtered to the slowest traces:
The waterfall for one of these traces shows a lot of LREM calls, a telltale sign of an n+1 issue. Inspect the attributes on these LREM calls to see the specific queries being issued:

Now we have enough information to conclude what caused the latency spike in the checkout service: when users empty their cart, the frontend calls the checkout service, which calls the `EmptyCart` endpoint in the cart service, which runs a database query for each individual cart item, a classic n+1 scenario. The fix is simple: update the logic in this endpoint so it removes all the cart items in a single query.
Recap: How Observe accelerates detection and resolution
What we've just walked through is a perfect example of how Observe APM transforms the troubleshooting experience for database performance issues. Instead of spending hours sifting through logs or writing custom queries, we were able to:
- Quickly identify a latency spike in our checkout service using the performance breakdown chart
- Follow the dependency chain to pinpoint the actual source of the problem, the cart service
- Narrow down to a specific endpoint in the cart service
- Visually confirm the n+1 query pattern with the trace waterfall
- Inspect the specific database queries that were made which created the n+1 issue
By addressing this n+1 query issue, not only will your checkout experience be significantly faster, but you'll also reduce database load, potentially lowering infrastructure costs while improving scalability.
The OpenTelemetry Advantage
While n+1 detection capabilities exist in other APM solutions, Observe APM stands apart by building this functionality entirely on OpenTelemetry data. This key difference means:
- Industry standard instrumentation — Unlike competitors who rely on proprietary instrumentation methods, Observe APM leverages the growing OpenTelemetry standard that the industry is rapidly adopting
- Future-proof investment — As the industry continues to standardize on OpenTelemetry, your observability strategy remains aligned with open standards, protected from vendor-specific deprecations or migrations
- Simplified data collection — Observe streamlines OpenTelemetry collection while maintaining compatibility with the broader ecosystem, giving you a turnkey solution without sacrificing interoperability
Ready to eliminate database performance bottlenecks in your applications? Start your free trial of Observe APM today.
