Application Performance Monitoring
Give every developer the visibility they need to detect and resolve performance issues—without sampling limits, retention constraints, or per-seat pricing that forces you to gate-keep access to critical data.
OpenTelemetry Native
What’s the status of API Server in prod? Do we have a memory leak?
Cart service shows a latency spike from 12:00 PM PT. What changed between then and the previous 30 minutes?
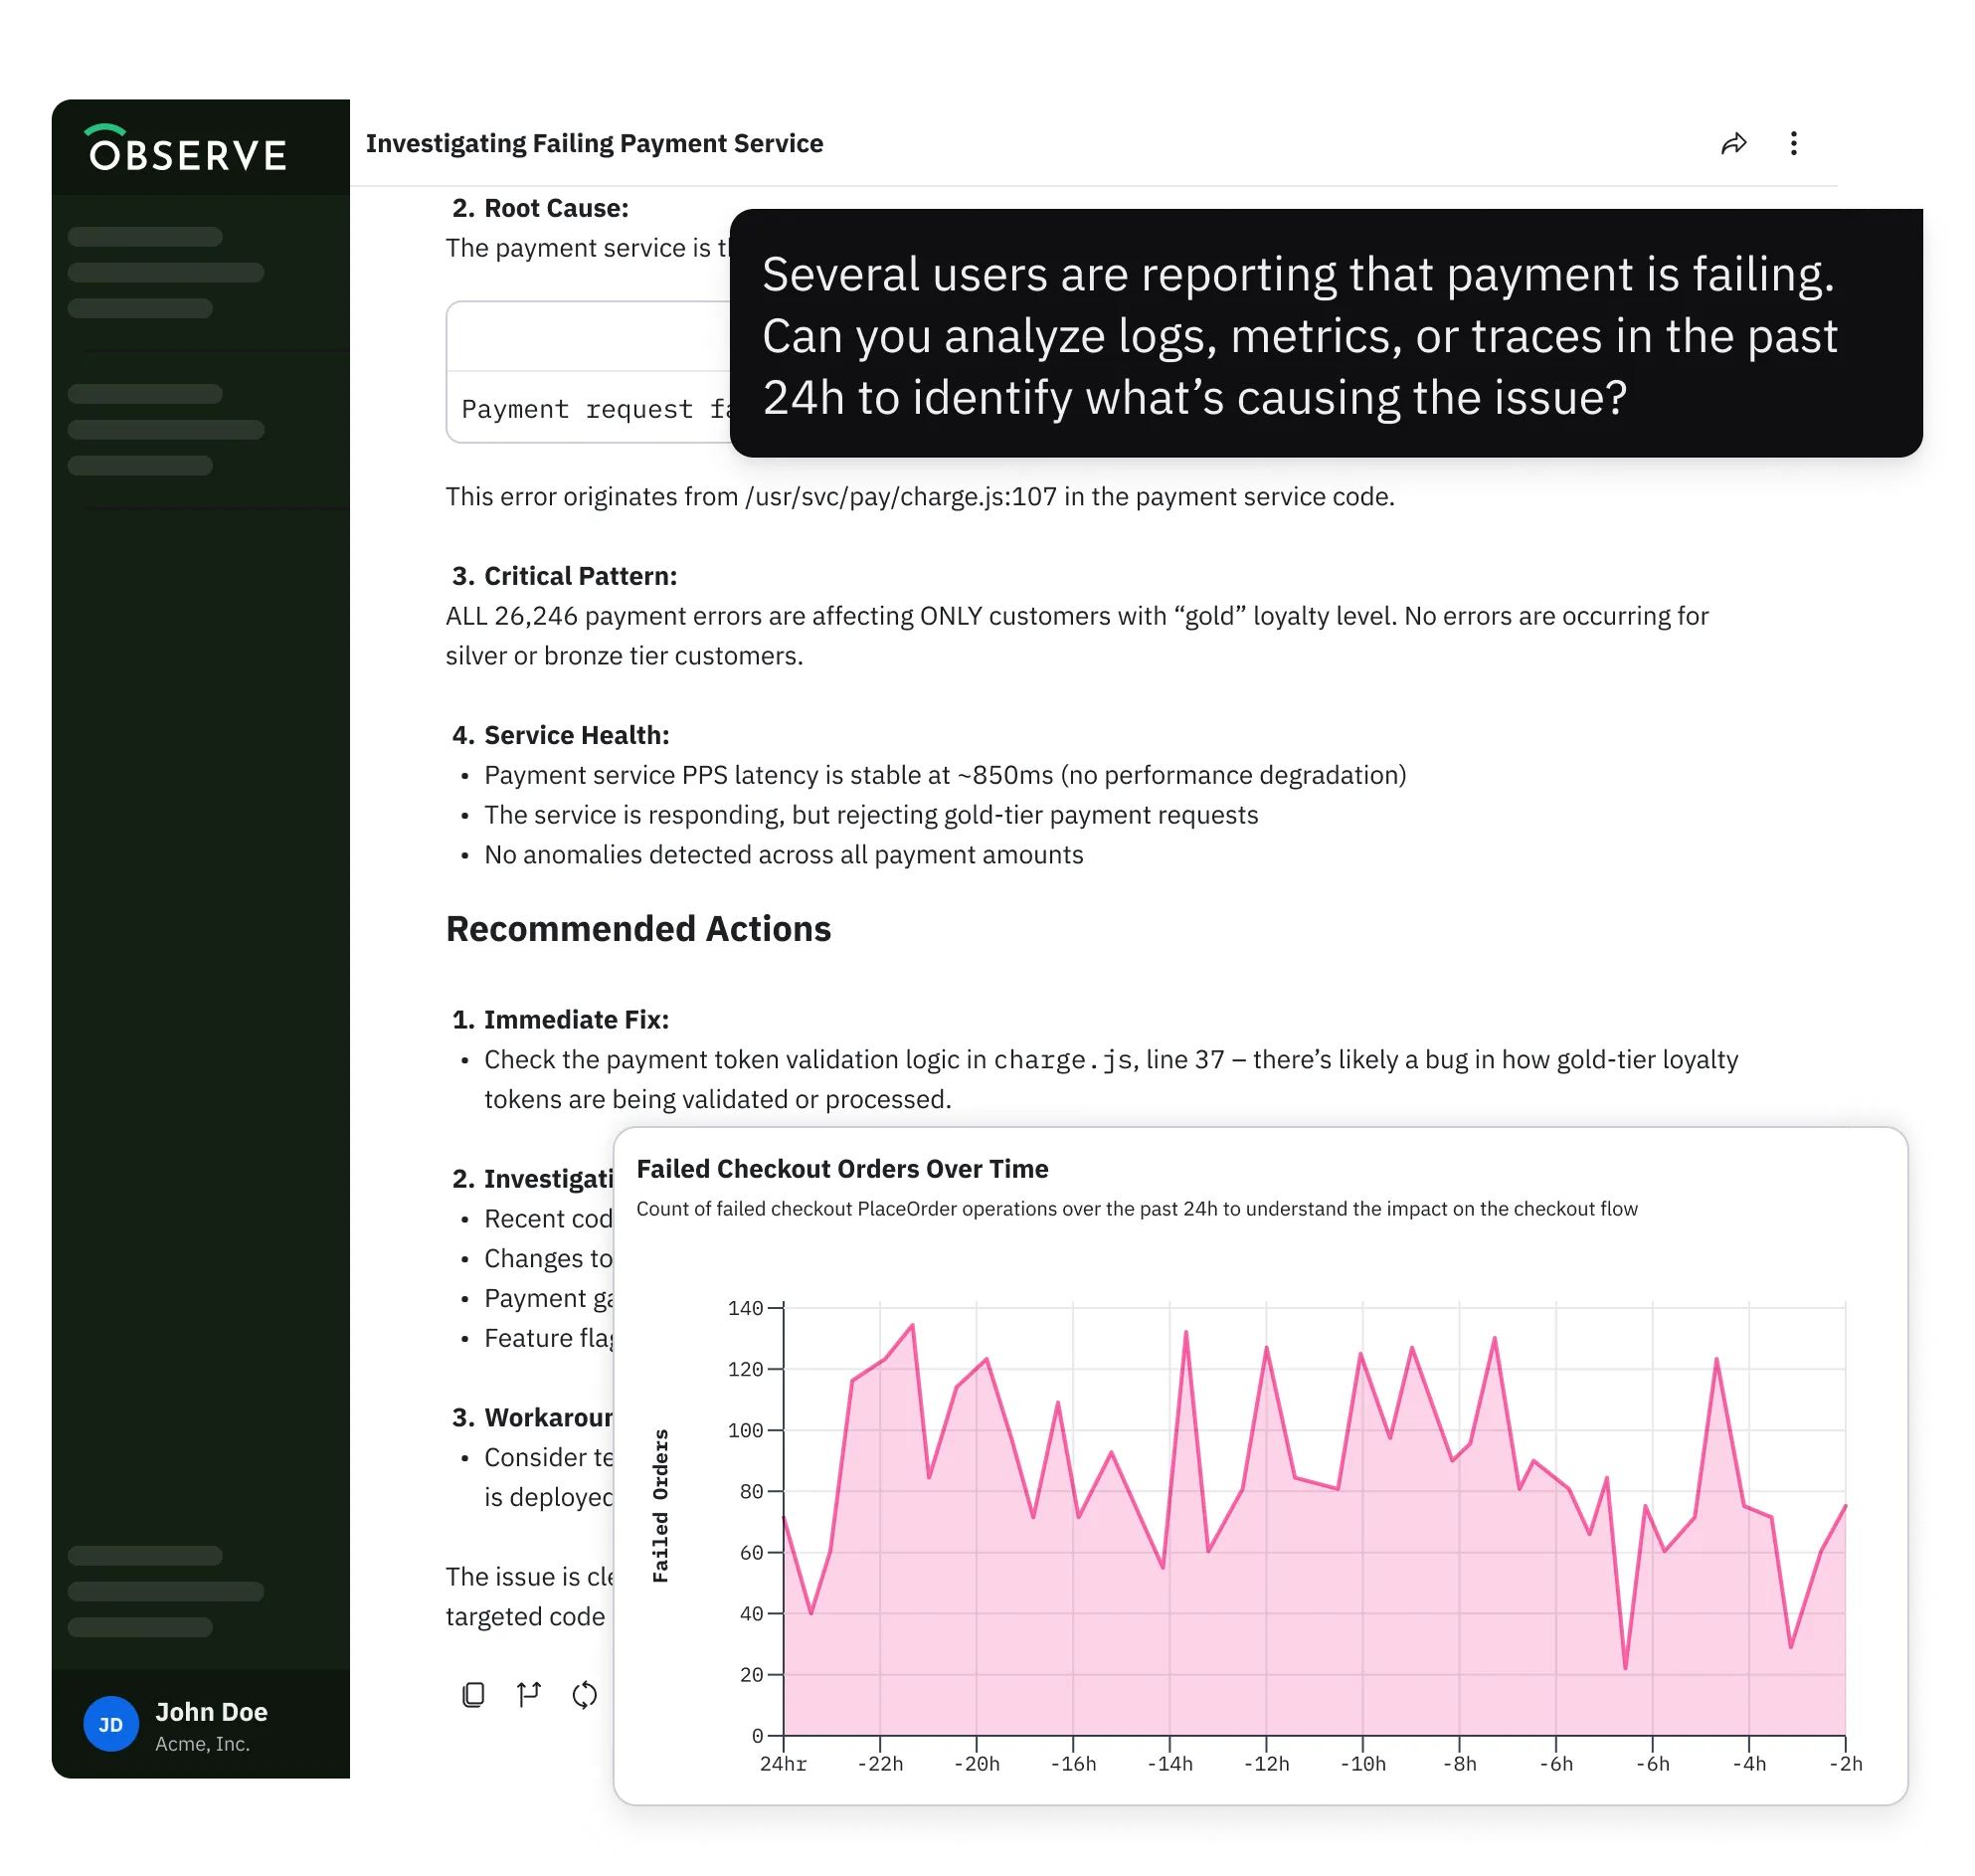
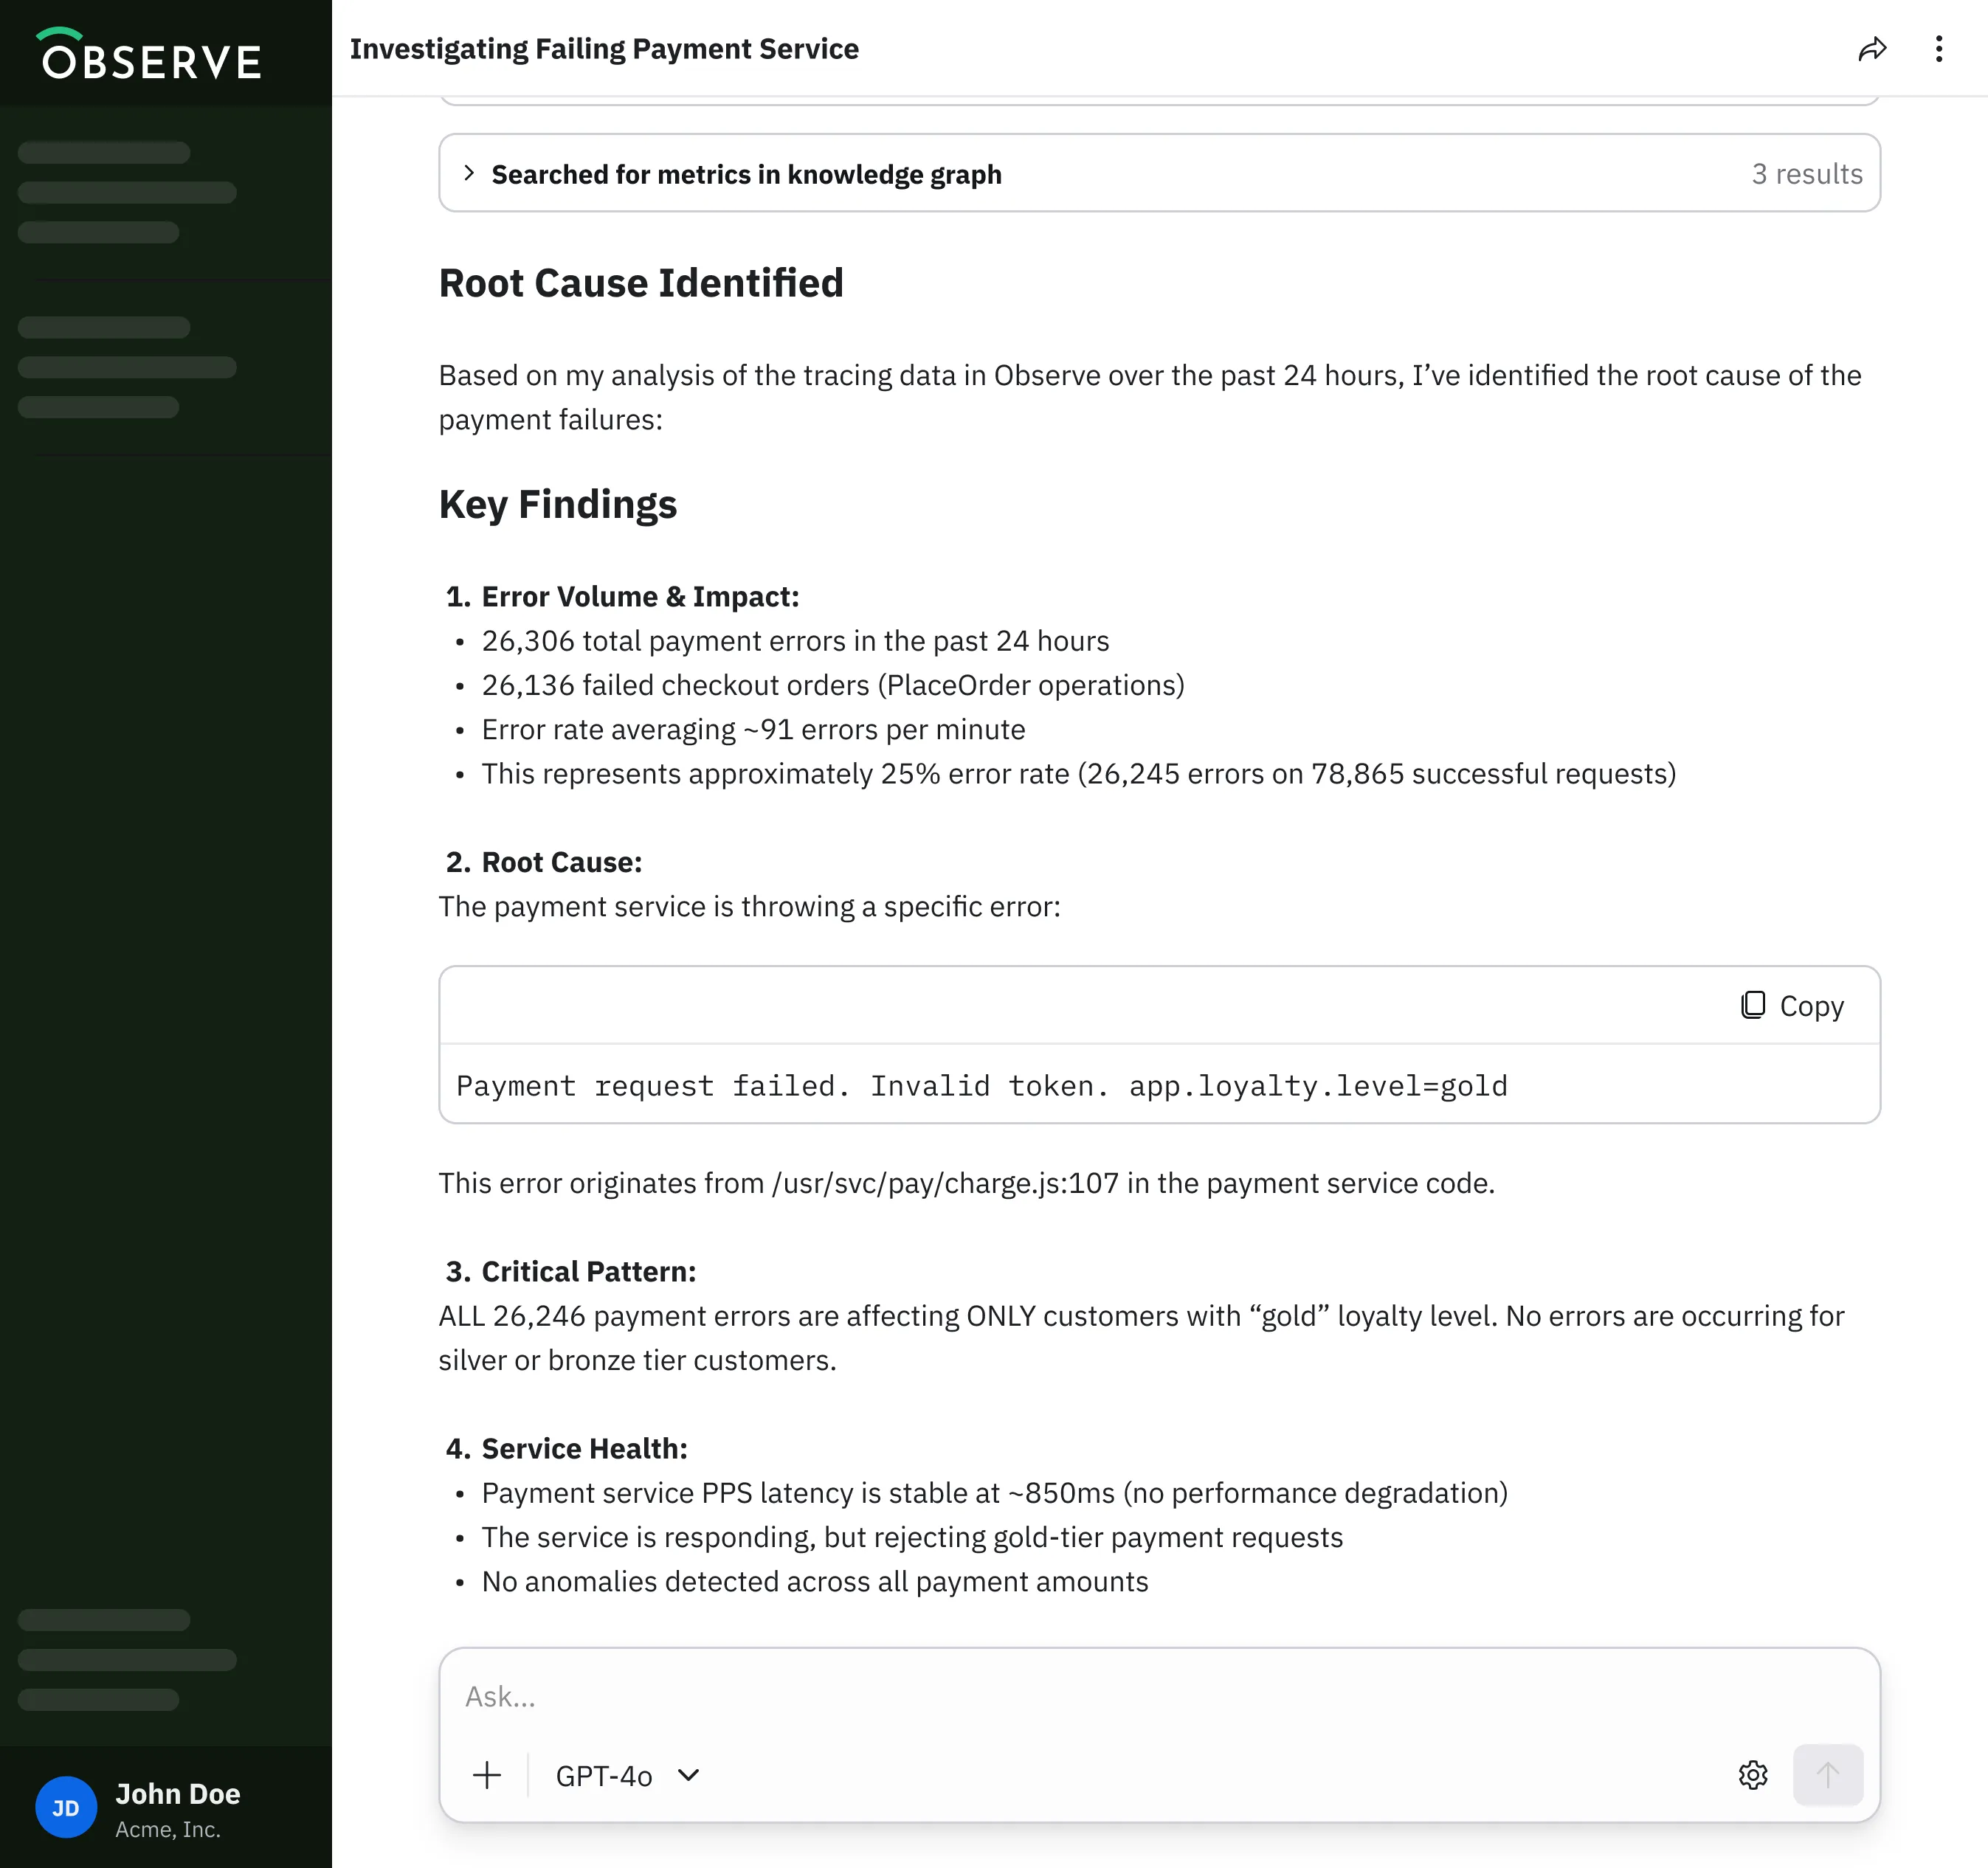
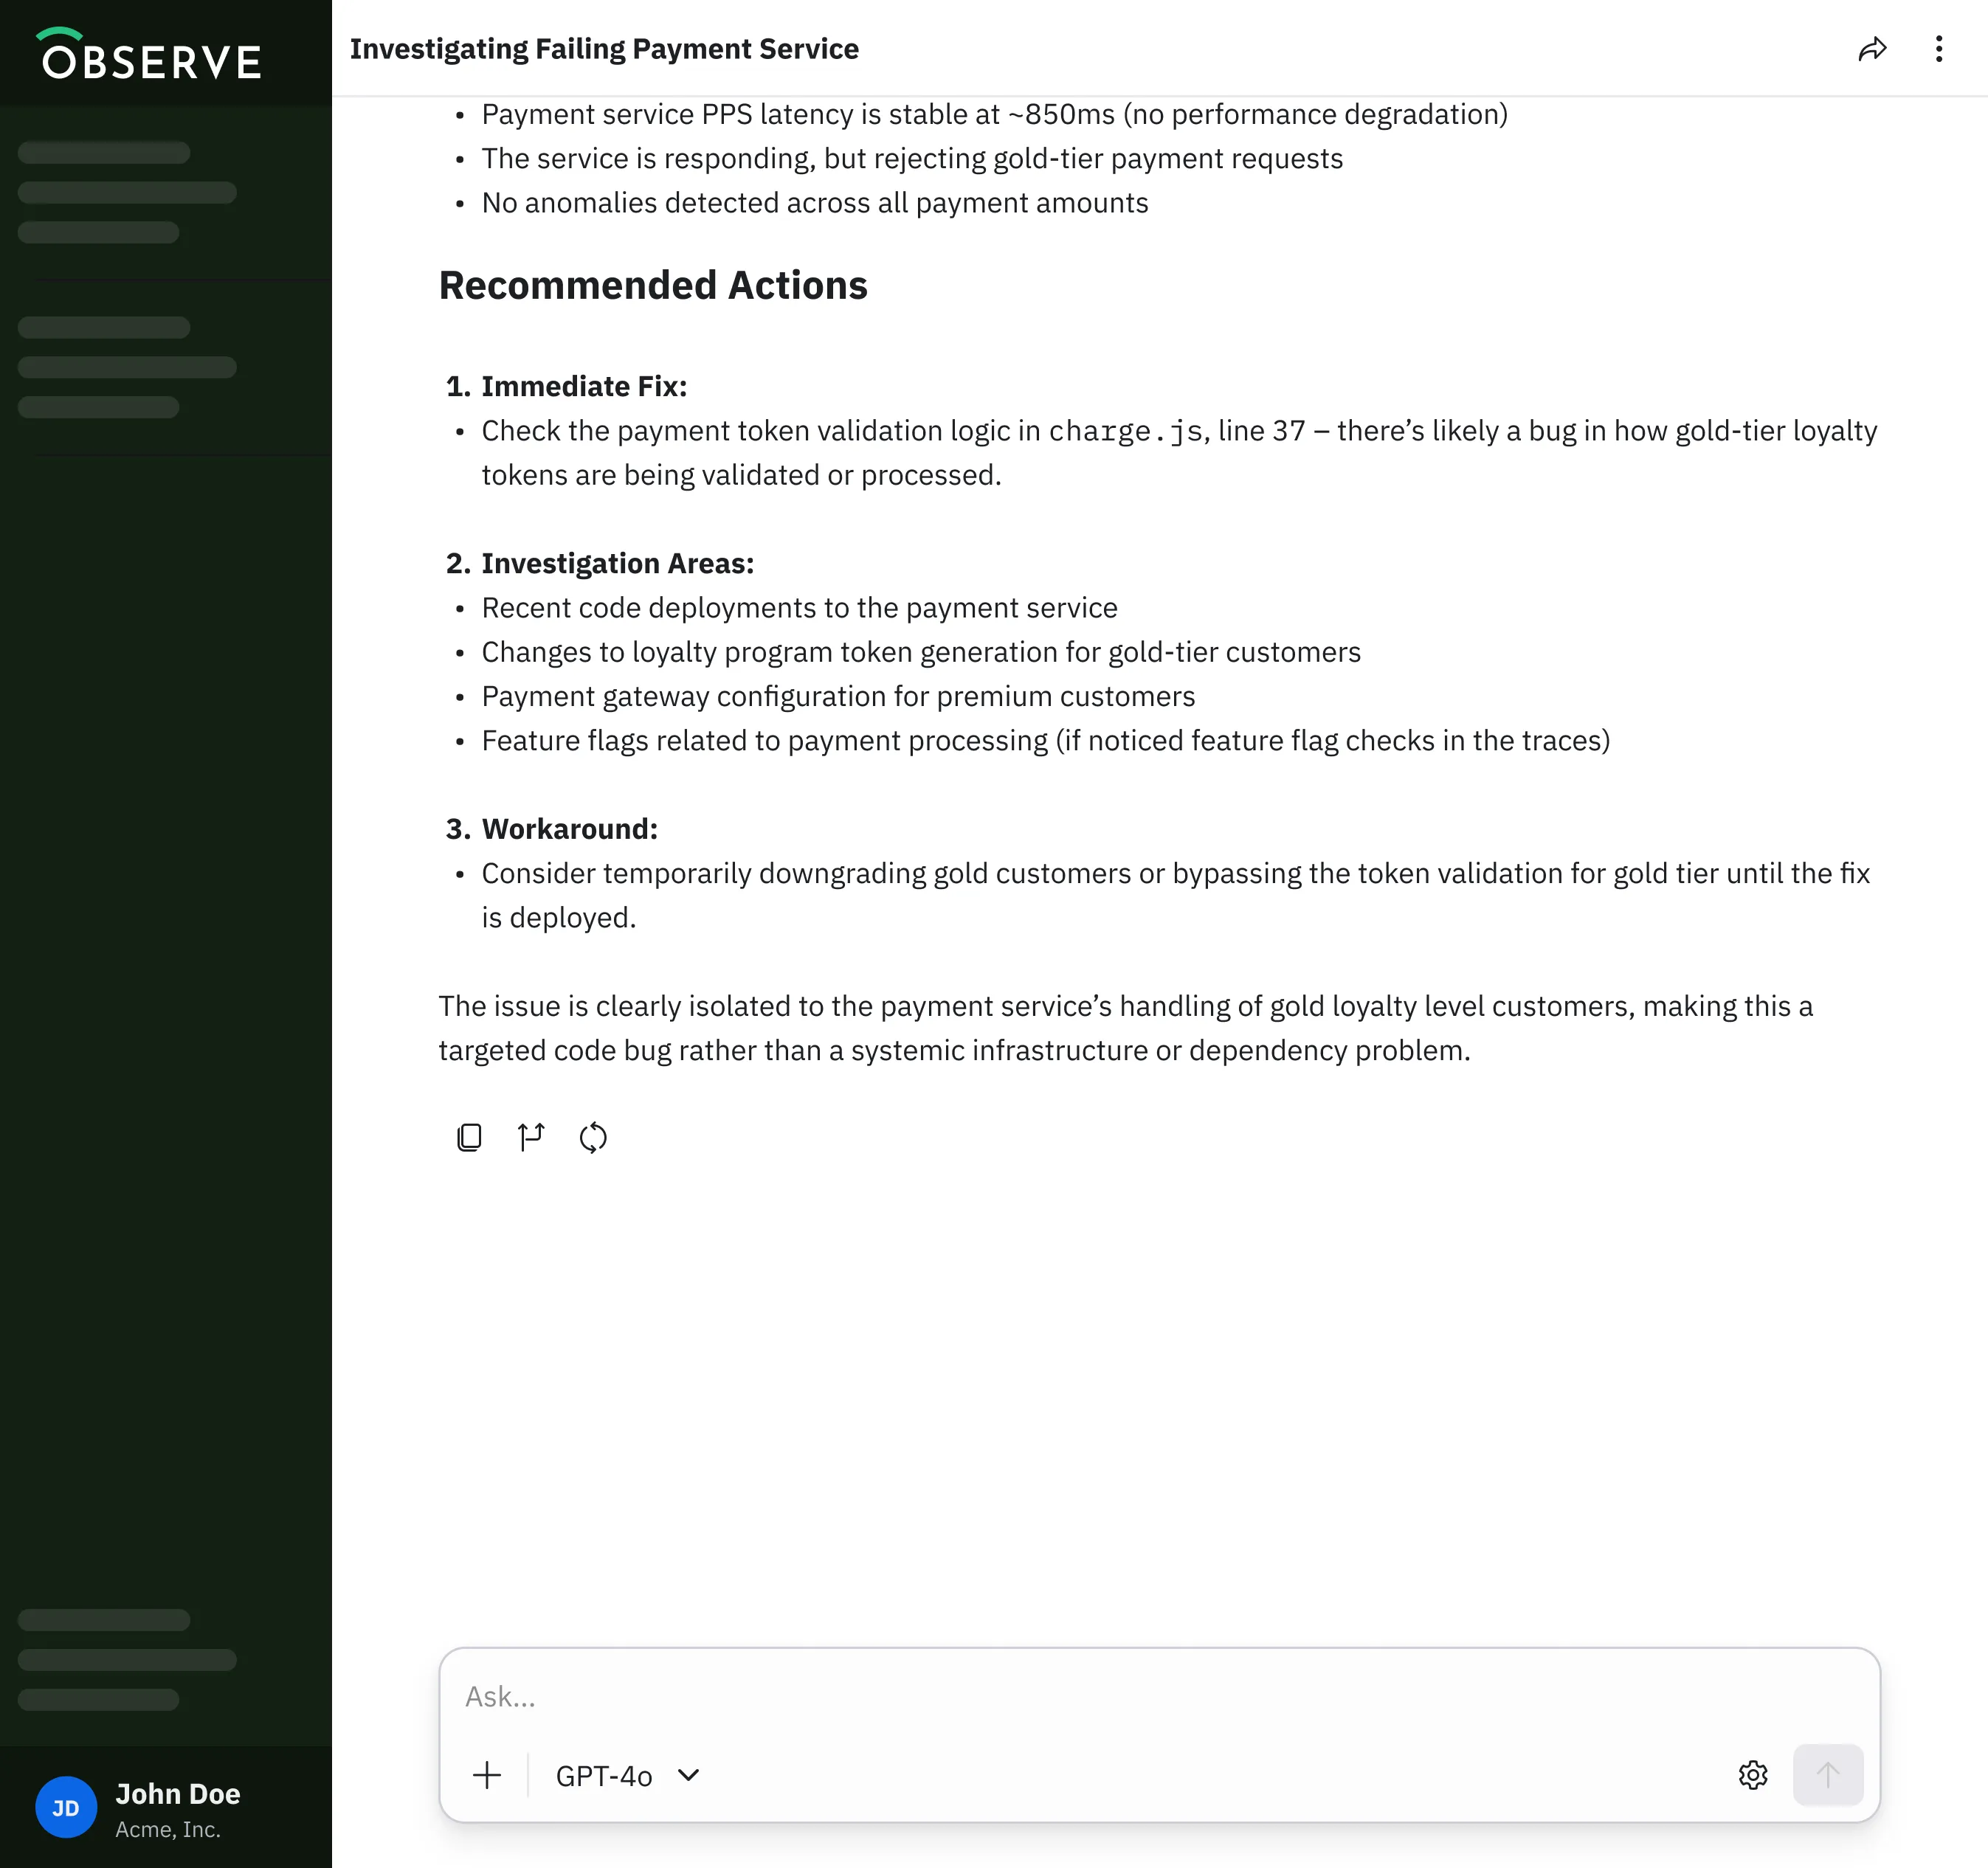
Create a monitor for payment service 5xx HTTP error responses.
No Vendor Lock-In
Adopt open standard-based instrumentation and collection of telemetry data with OpenTelemetry.
Automatic Instrumentation
Automatically instrument your application code using OTel libraries or use OTel SDKs and APIs to instrument code.
Observe’s AI SRE and MCP Server have the potential to transform how we investigate incidents and reduce the time engineers spend on resolving issues by providing faster, more contextual insight into system behavior.
It’s a major unlock for our SRE practice, empowering teams to proactively analyze systems and address potential issues before they impact players.
Observe's AI SRE knows more about my products and services than my best engineers at this point and I can prove it. The level to which this is going to transform my tech team is unimaginable at this point.
- Financial Services Institution
OpenTelemetry Native
No Vendor Lock-In
Adopt open standard-based instrumentation and collection of telemetry data with OpenTelemetry.
Automatic Instrumentation
Automatically instrument your application code using OTel libraries or use OTel SDKs and APIs to instrument code.
OpenTelemetry Native
No Vendor Lock-In
Adopt open standard-based instrumentation and collection of telemetry data with OpenTelemetry.
Automatic Instrumentation
Automatically instrument your application code using OTel libraries or use OTel SDKs and APIs to instrument code.
Service Discovery and Mapping

Unified Service Discovery
Automatically discover all microservices and databases from OpenTelemetry data—no more blind spots or manual service catalogs to maintain.
Consolidated Service Maps
Visualize your entire system architecture in one place instead of switching between multiple monitoring tools to understand dependencies.
Democratized Monitoring
Give every developer access to Golden Signals monitoring without per-seat pricing that forces you to limit tool access to just a few experts.

Trace Search and Inspection
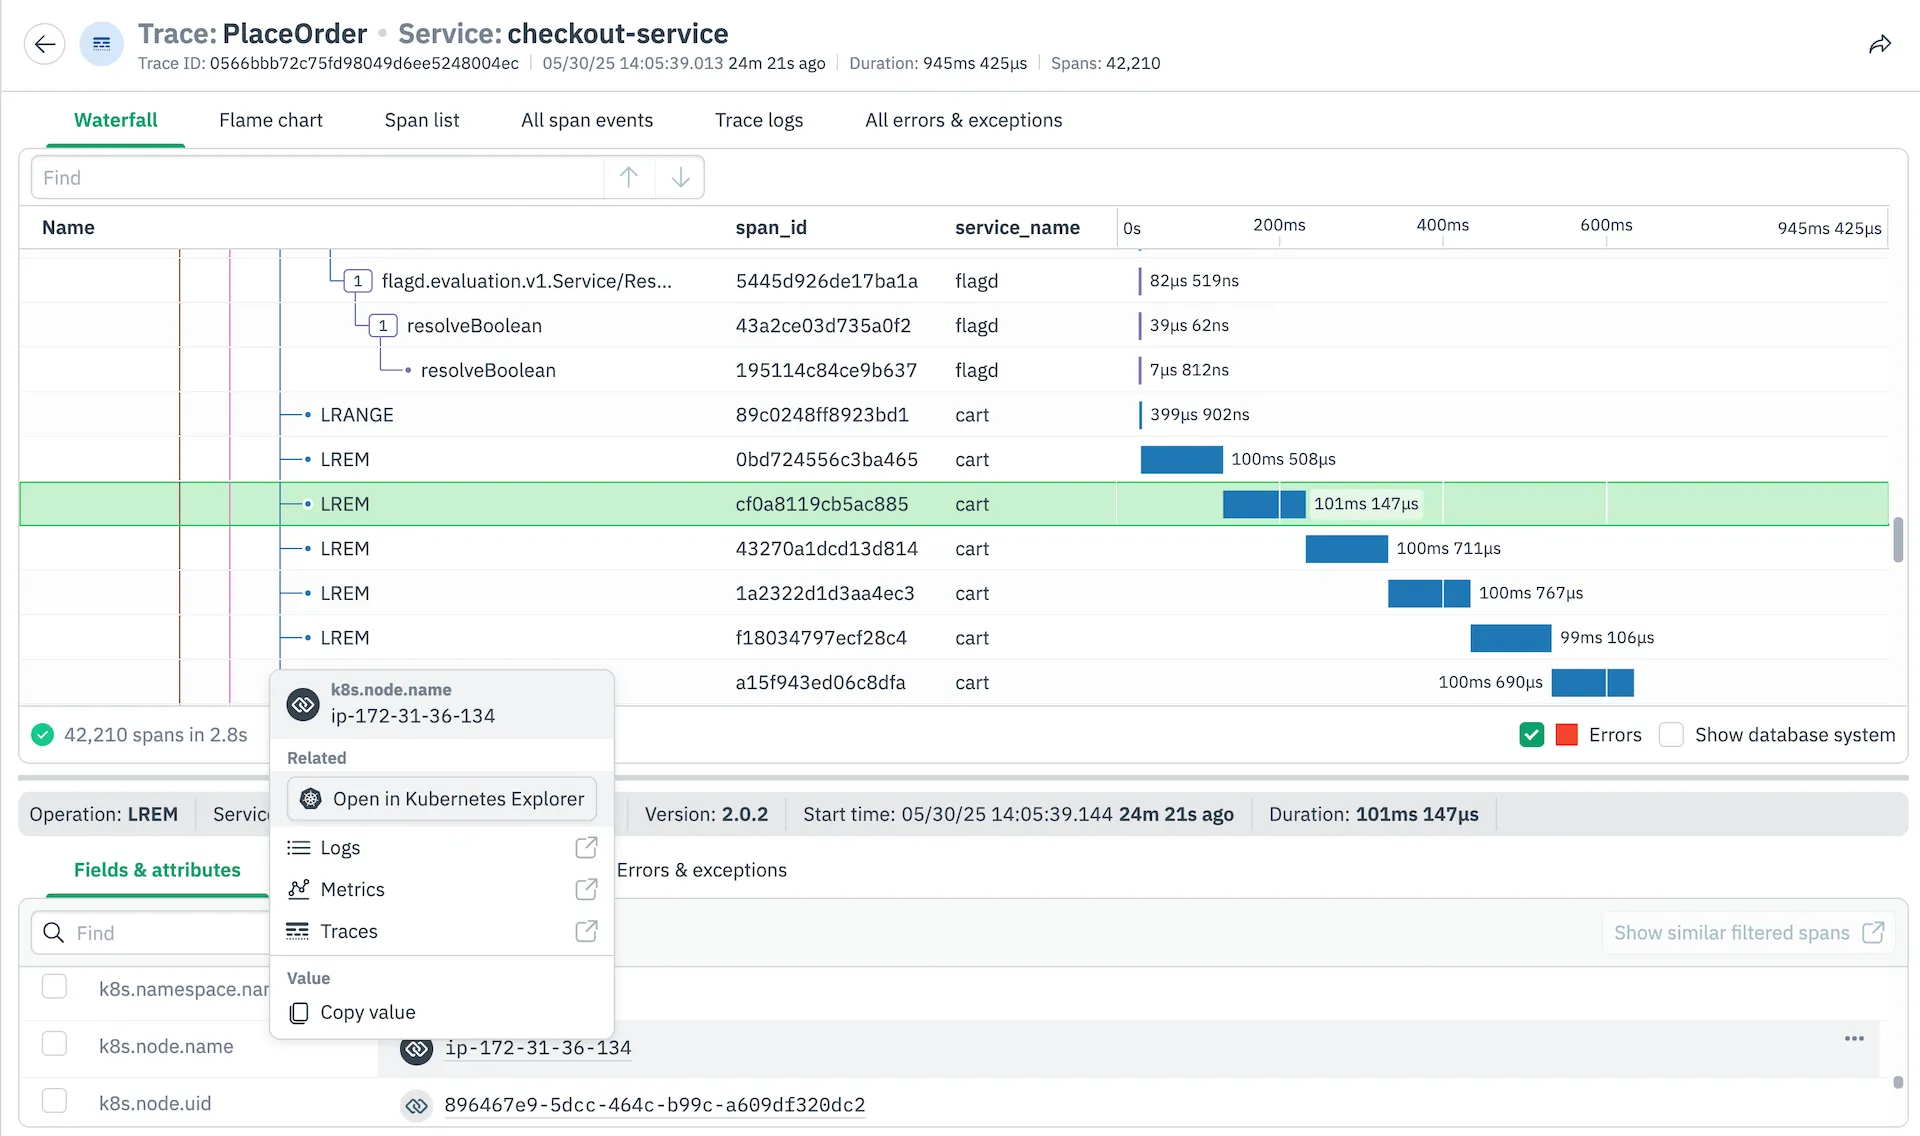
Full-Fidelity Investigation
Analyze every slow transaction with 13 months of unsampled trace data—no more missing the critical traces that explain production issues.
Cross-Data Correlation
Pivot seamlessly from traces to logs, metrics, and infrastructure data without the manual "stitching" that wastes hours during incidents.
Real-Time Root Cause
Drill down from service-level alerts to individual traces and correlated logs in seconds, not the hours it takes with fragmented tooling.
Deployment Tracking
Release Impact Assessment
Instantly correlate deployment markers with performance changes to quickly identify whether new releases introduced regressions.
Concurrent Deployment Monitoring
Compare RED metrics across concurrent deployment versions, including canary releases, to quickly identify performance regressions in real-time.
Track Errors and Exceptions
Automatically surface new error types introduced by deployments so your entire engineering team can identify issues without relying on expert troubleshooters.