Infrastructure Monitoring
Capture metrics across your infrastructure – cloud, Kubernetes, serverless, applications or from over 400 pre-built integrations. Visualize the entire stack and troubleshoot performance issues in real-time.
Every Stack. Any Scale
What’s the status of API Server in prod? Do we have a memory leak?
Cart service shows a latency spike from 12:00 PM PT. What changed between then and the previous 30 minutes?
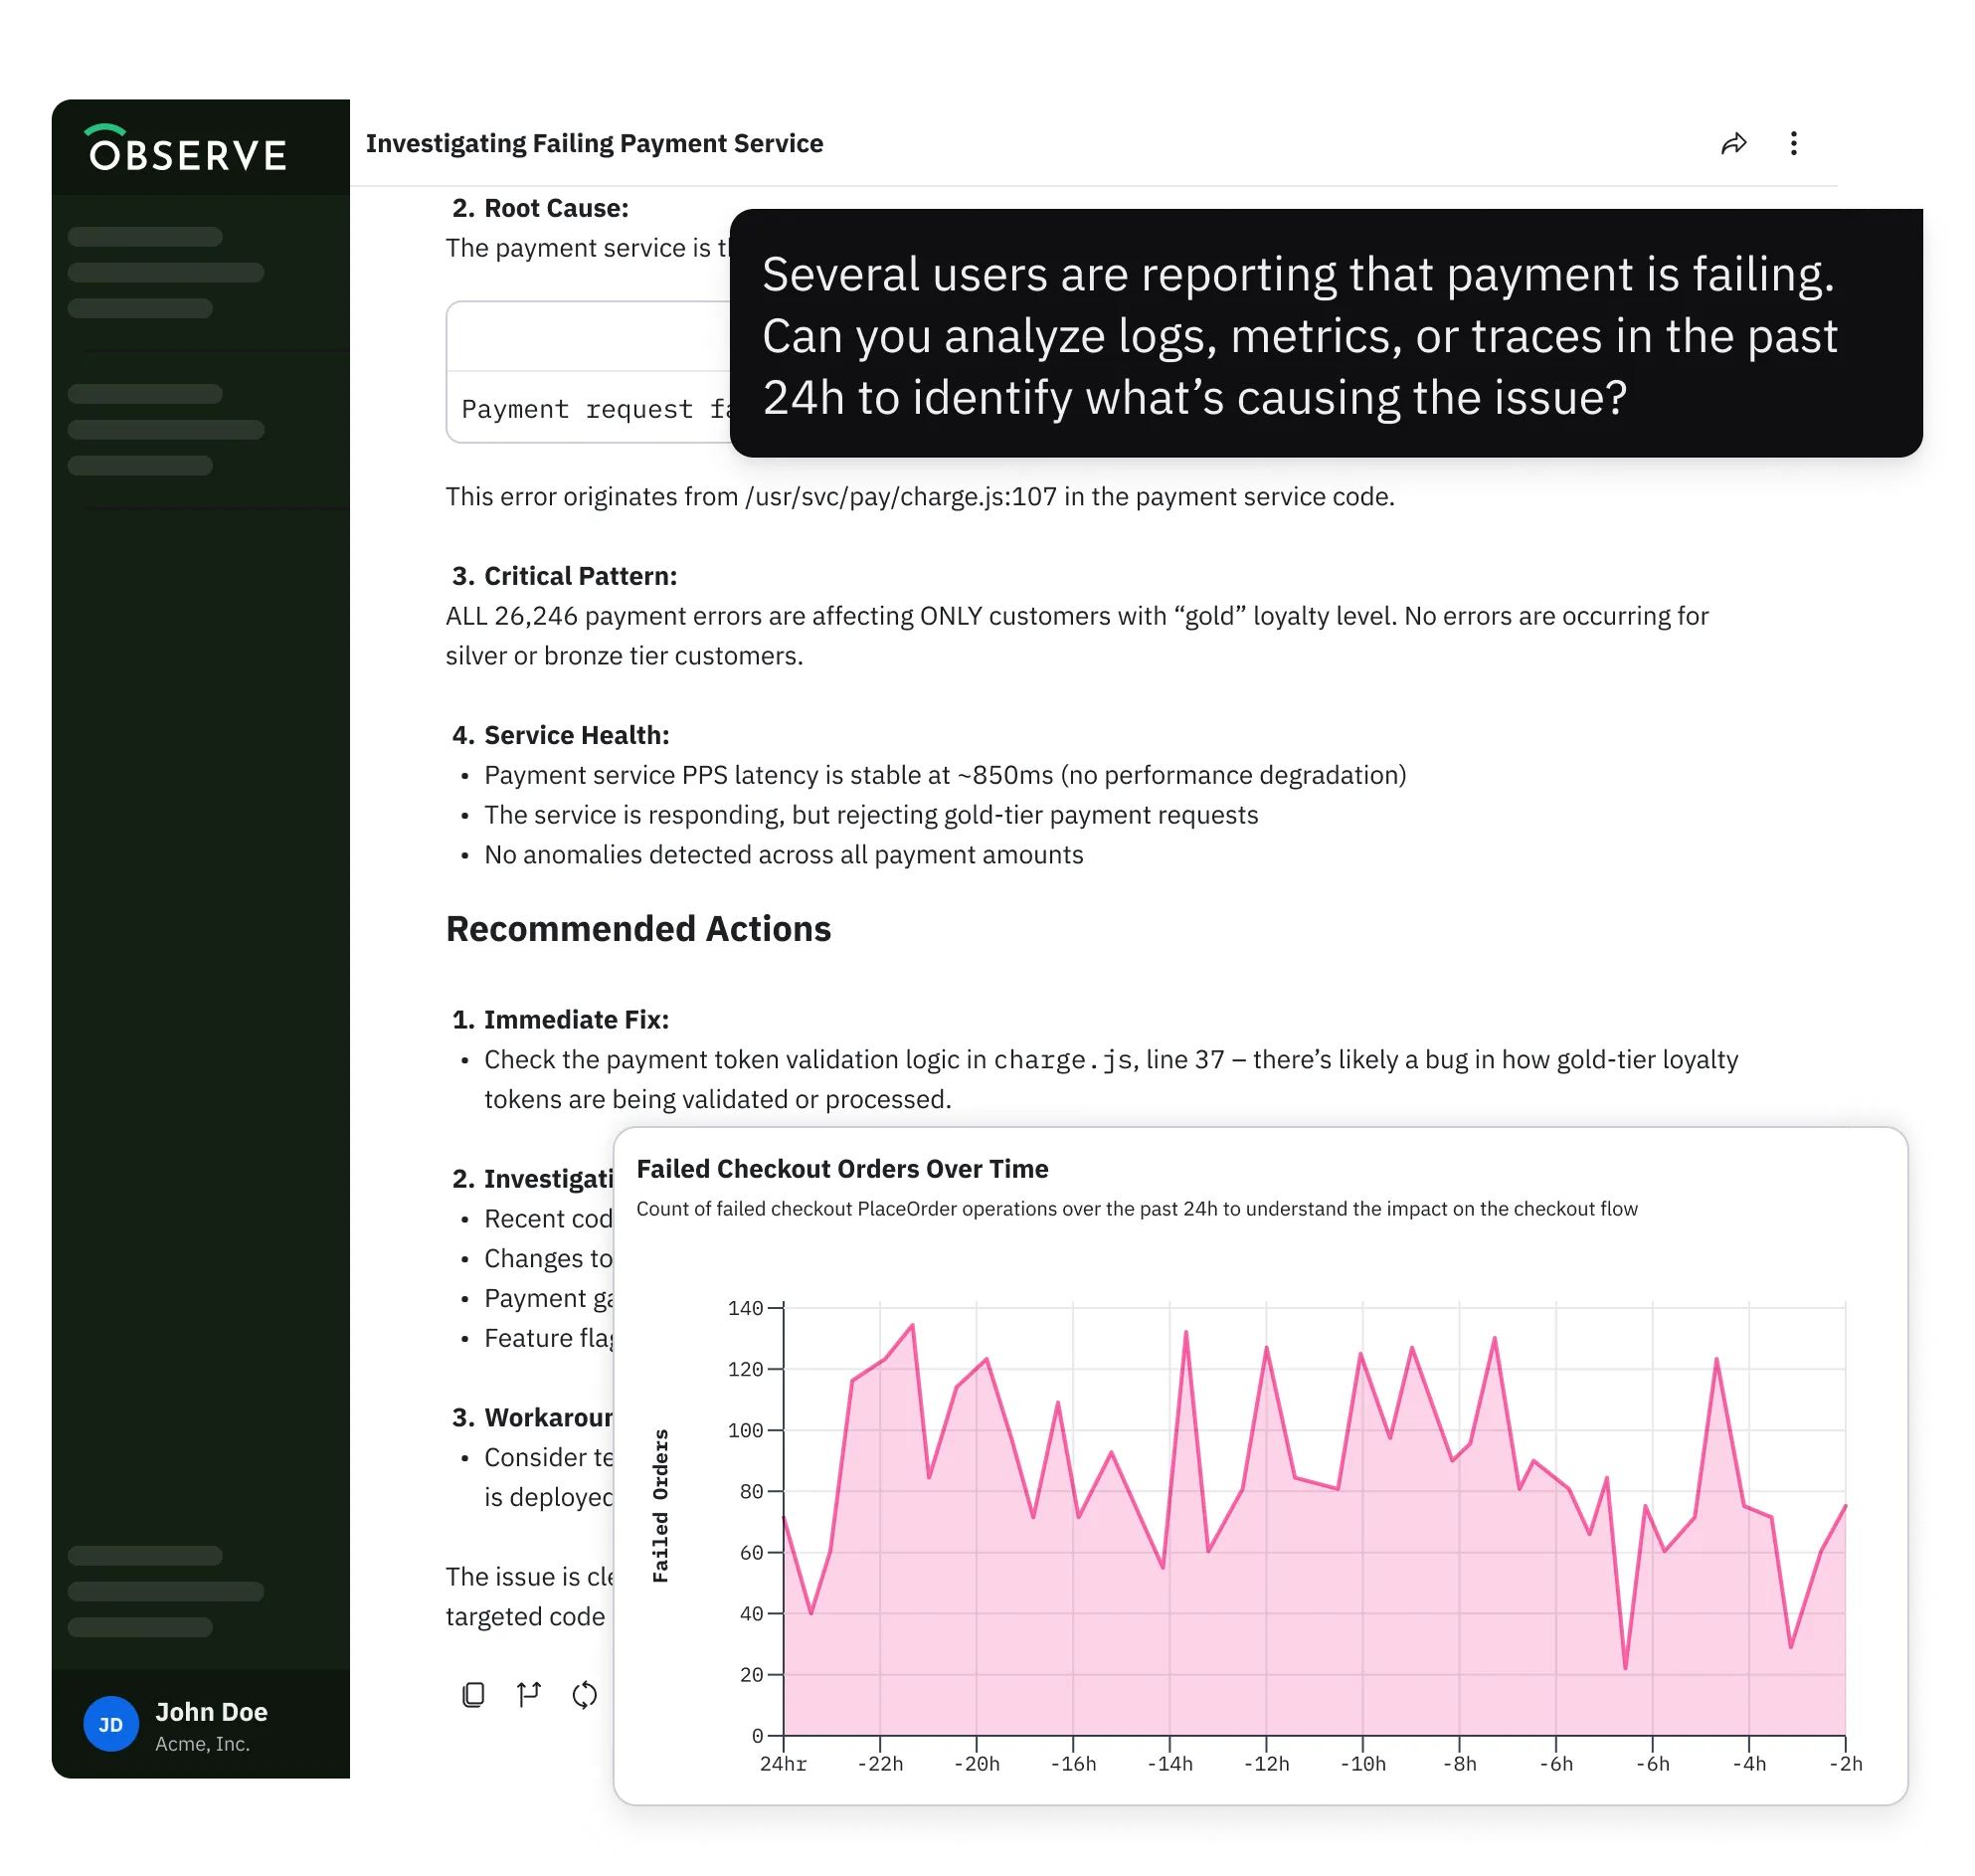
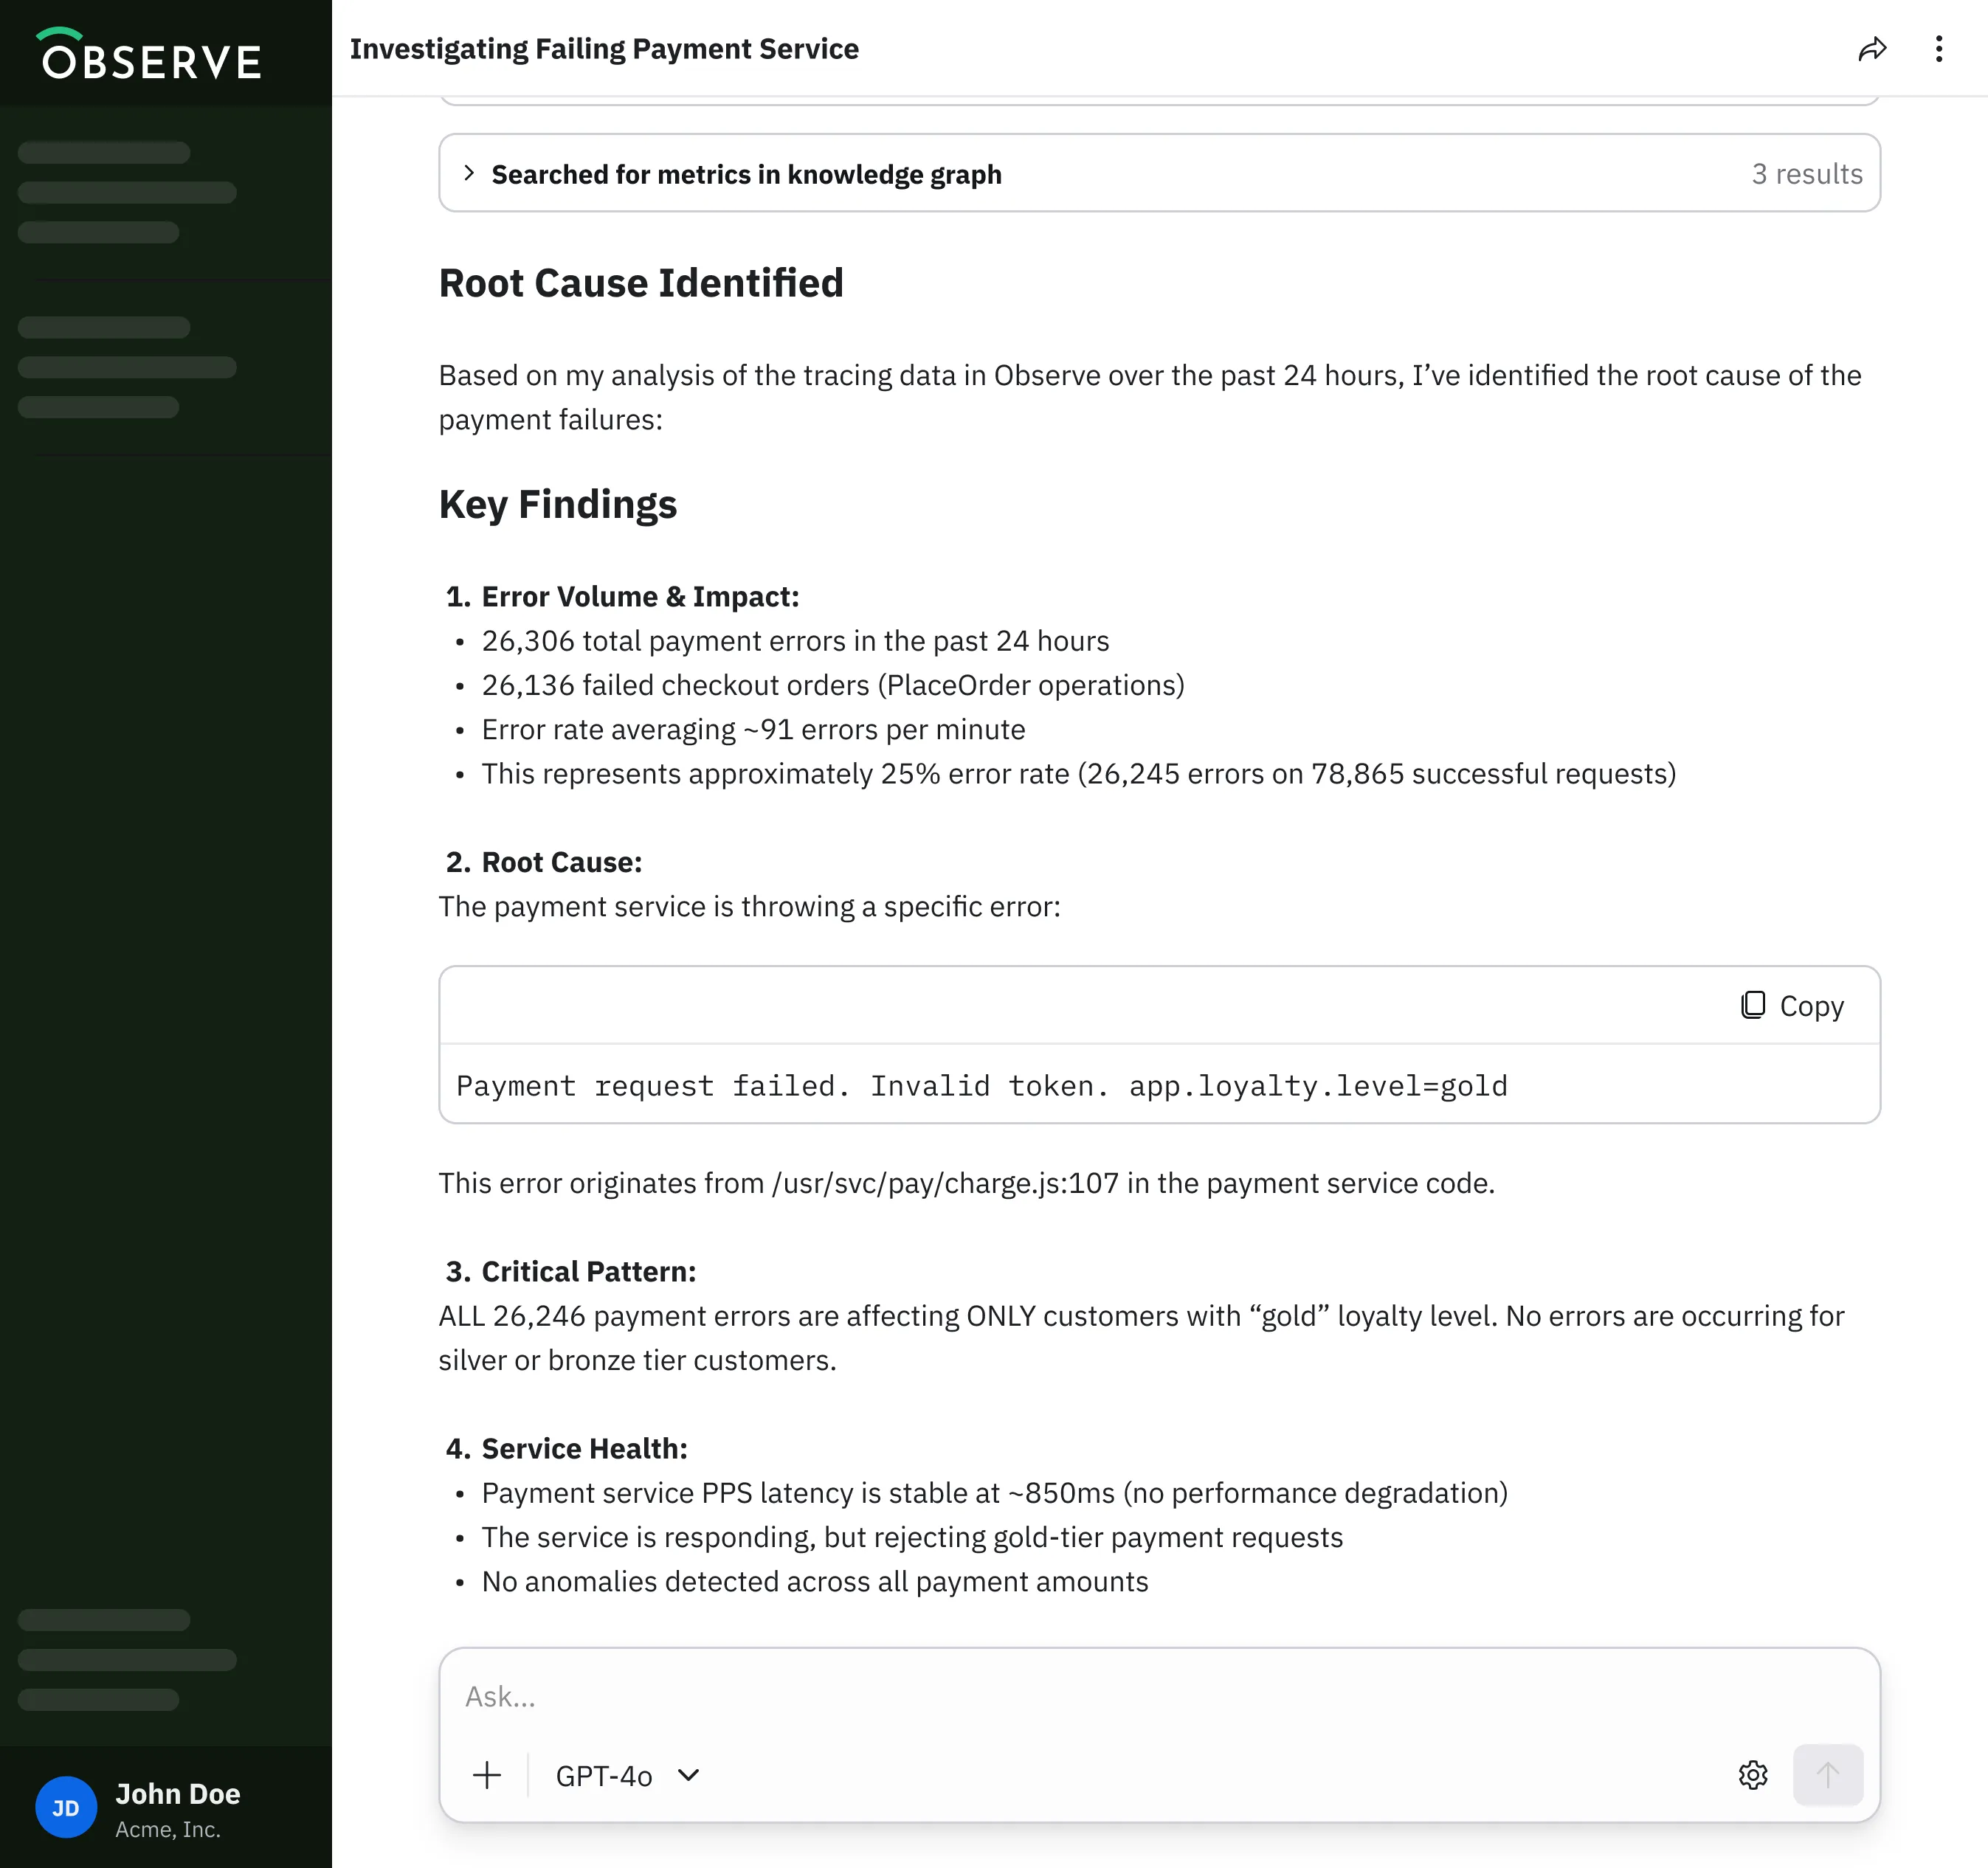
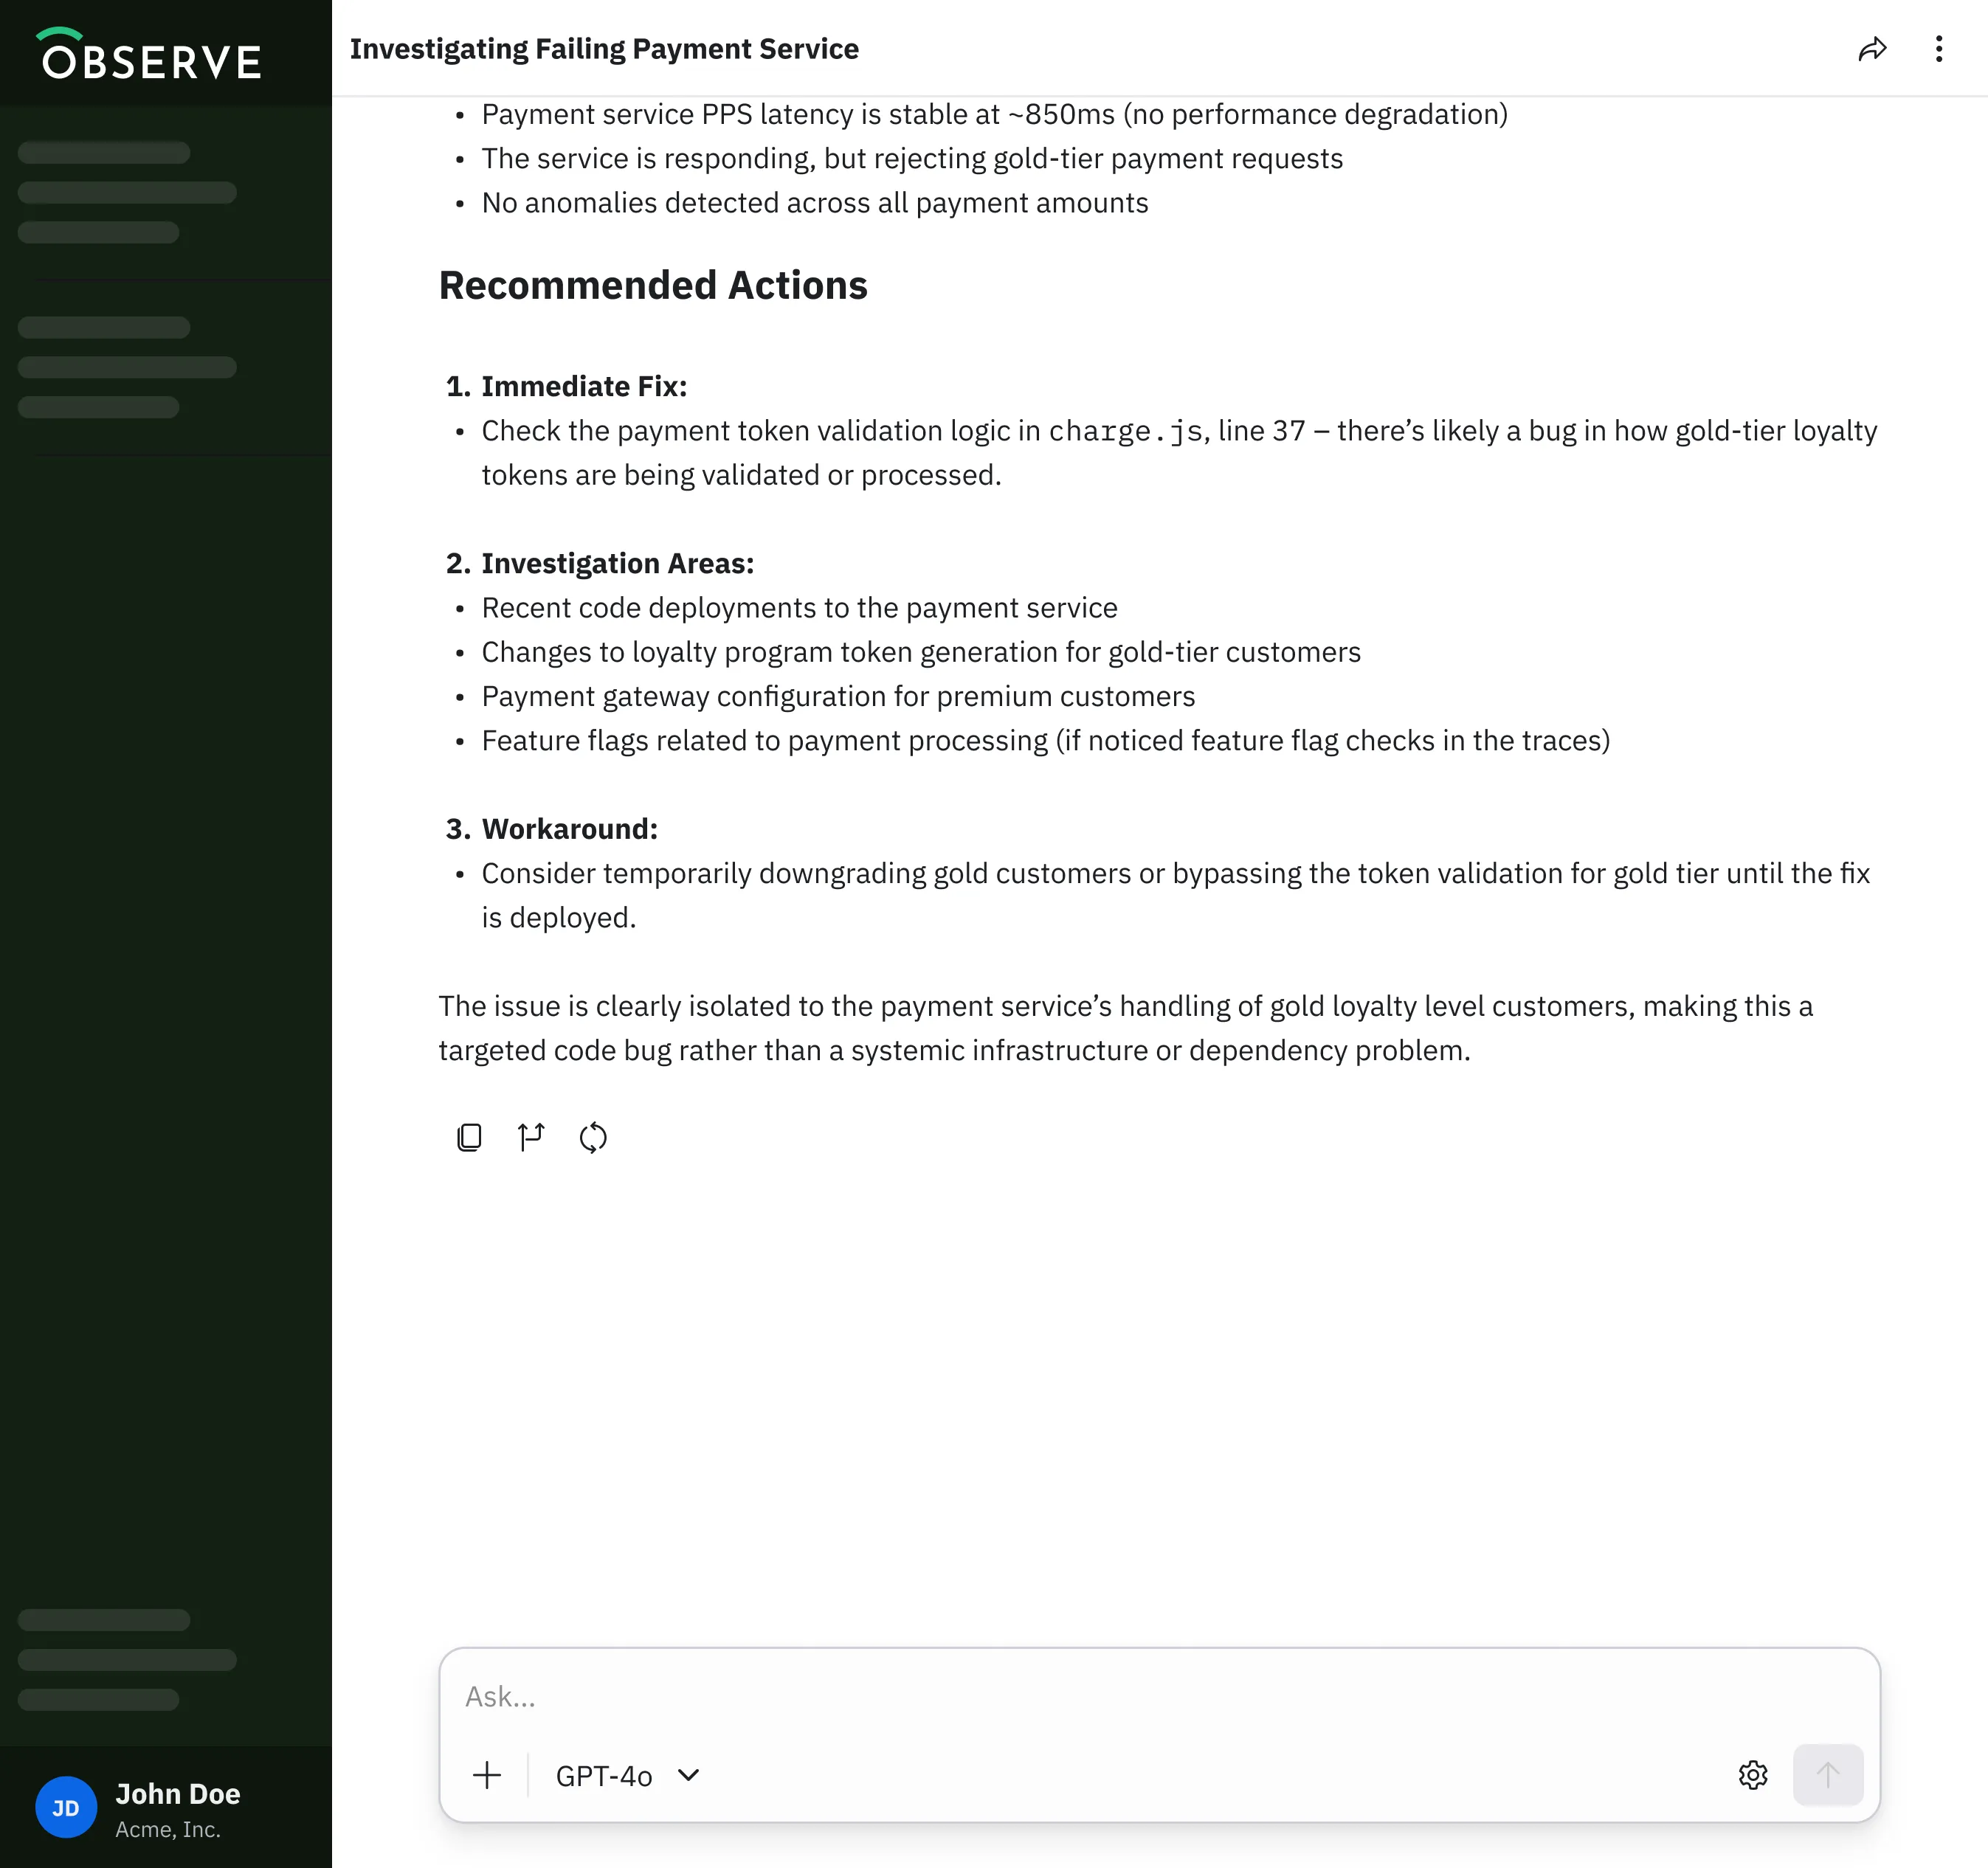
Create a monitor for payment service 5xx HTTP error responses.
400+ Pre-Built Integrations
Easily get data in with 400+ pre-built integrations into infrastructure and popular technologies across cloud services, containers, Kubernetes, serverless functions, and more.
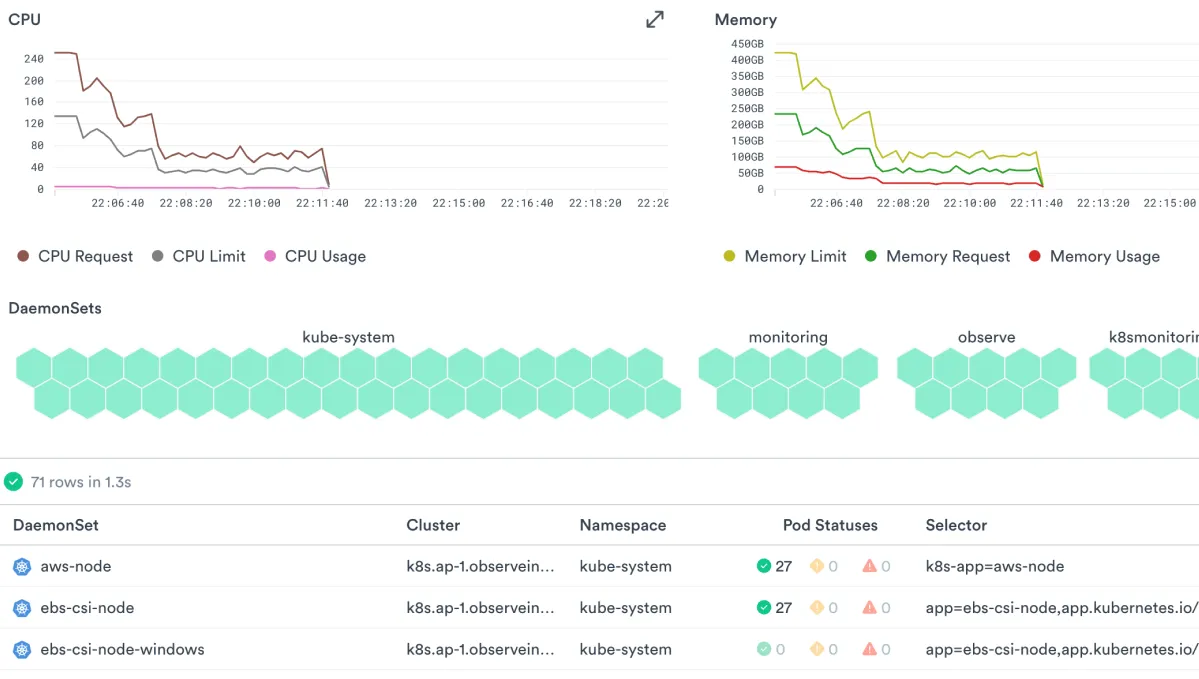
Visualization and Contextual Alerts
Out-of-the-box visualization and contextual alerts into health and performance of infrastructure services.
Historical Data
Get historical performance data even on ephemeral infrastructure such as containers or pods.
Observe’s AI SRE and MCP Server have the potential to transform how we investigate incidents and reduce the time engineers spend on resolving issues by providing faster, more contextual insight into system behavior.
It’s a major unlock for our SRE practice, empowering teams to proactively analyze systems and address potential issues before they impact players.
Observe's AI SRE knows more about my products and services than my best engineers at this point and I can prove it. The level to which this is going to transform my tech team is unimaginable at this point.
- Financial Services Institution
Every Stack. Any Scale
400+ Pre-Built Integrations
Easily get data in with 400+ pre-built integrations into infrastructure and popular technologies across cloud services, containers, Kubernetes, serverless functions, and more.
Visualization and Contextual Alerts
Out-of-the-box visualization and contextual alerts into health and performance of infrastructure services.
Historical Data
Get historical performance data even on ephemeral infrastructure such as containers or pods.
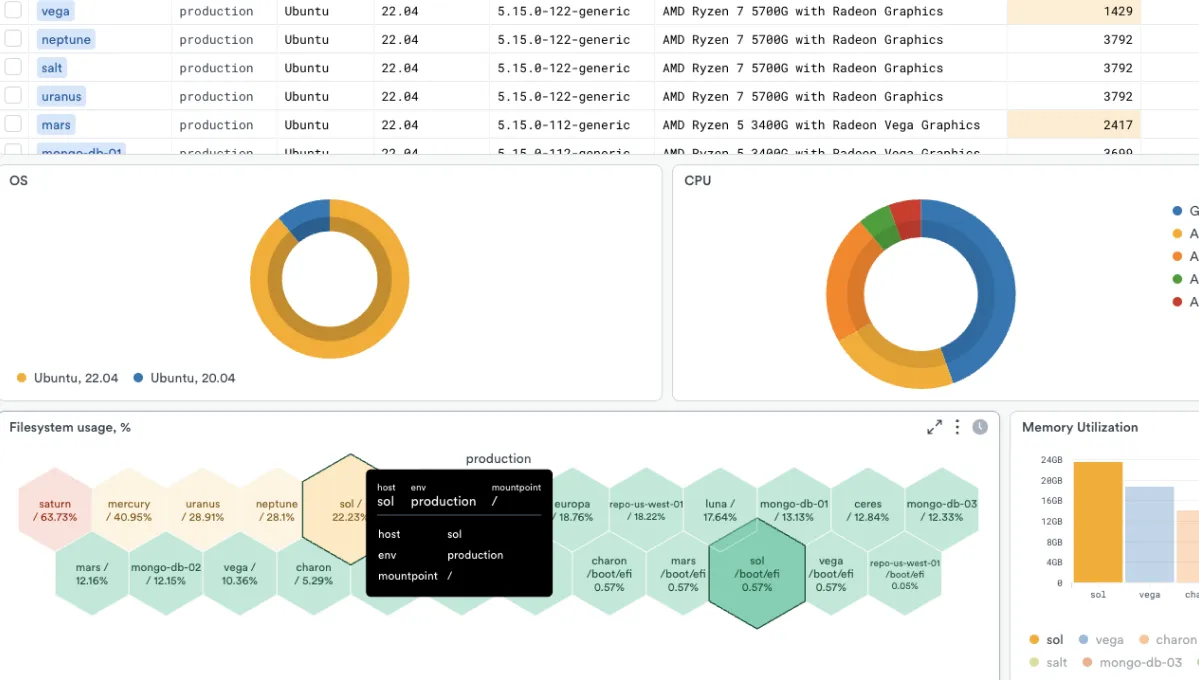
High Cardinality Analytics
Get Granular Insights
Slice-and-dice metric data to get granular insights using tags and labels.
Extract Key Metrics
Easily extract key metrics from logs using point-and-click UI.
Control Costs
Never pay extra for log-derived metrics and control the spiraling costs of high-cardinality analytics.

Contextual Pivots
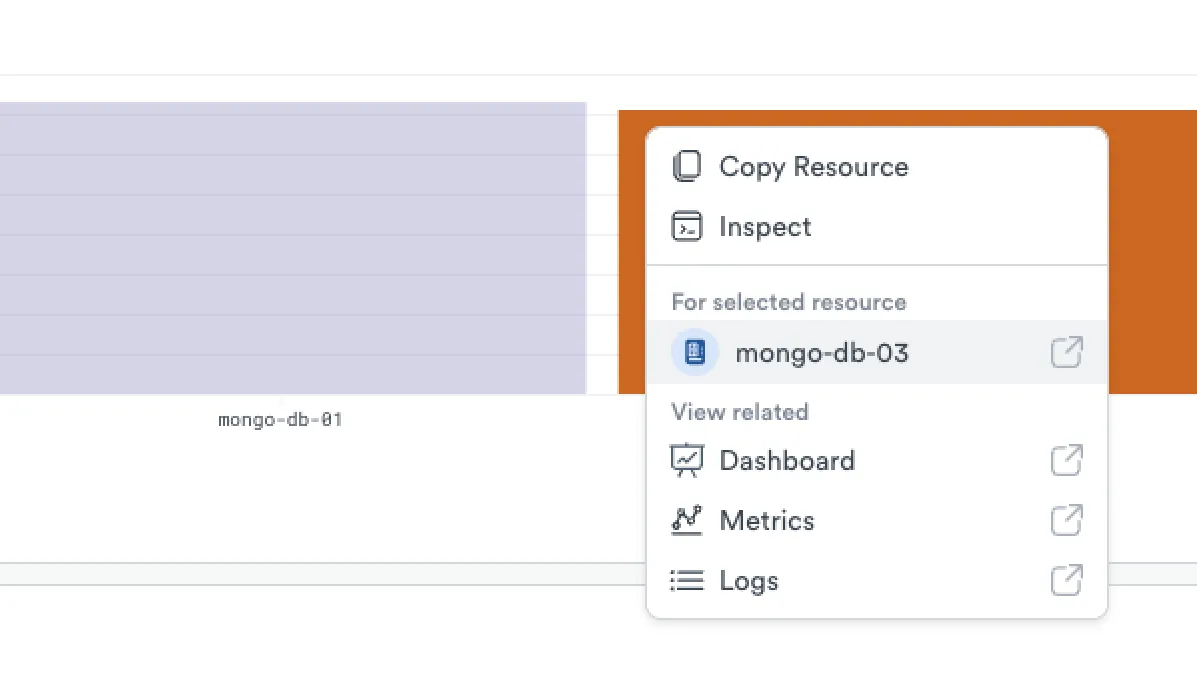
Understand Cloud Interdependencies
Understand the interdependencies of complex cloud-native infrastructure and applications with automatically created correlations.
Dashboard to Help You Troubleshoot
Pivot to contextual logs from infrastructure dashboards to troubleshoot and resolve performance incidents.
Resolve Issues Quickly
Get actionable alerts with in-context alerts to quickly detect and resolve issues as they arise.
Prometheus-ready
Scale More Easily
Outgrowing Prometheus? Eliminate the complexity of maintaining and scaling Prometheus with elastically scalable and cost efficient Observability solution.
Reduce MTTD and MTTR
Use Observe’s native support for Prometheus using remote-write protocol. Stream Prometheus metrics in real-time to reduce MTTD and MTTR.
Aggregation and Analysis
Send metrics from multiple Prometheus instances to Observe for aggregation and analysis.