Book a Demo
For information about how Observe handles your personal data, please see our Privacy Policy.
For information about how Observe handles your personal data, please see our Privacy Policy.


Splunk and Observe are both observability platforms designed to ingest, store, and analyze telemetry such as logs, metrics, and traces. Each provides search and visualization capabilities to help engineers troubleshoot systems and understand application behavior. While both platforms are commonly used for log management and analytics, there are many differences in the way they have been designed and implemented. This paper highlights how these divergent approaches impact their suitability as scalable log management solutions.
Splunk, founded in 2003, was a breakthrough product for its time, offering indexing for logs so IT teams could search and analyze them. Its design reflected the infrastructure norms of the time: primarily on-premises deployments, smaller data volumes, and log-centric telemetry. Over time, Splunk expanded its scope to include metrics, traces, and security analytics, but its core architecture remained index-driven.
Observe, founded in 2017, was built during the cloud era, when telemetry volumes had grown significantly and elastic compute and cheap object storage were readily available. Rather than retrofitting an index-based system, its design is based on a cloud data lake, full separation of compute and storage, efficient columnar analytics instead of operating on raw logs, and a correlation model built for heterogeneous telemetry.
The following sections go into further depth into the technical differences between Splunk and Observe in areas such as architecture, data ingestion and storage, analytics, and operations. While Splunk has a Splunk Cloud offering that abstracts away a number of the concepts discussed below, it is important to note that the underlying architecture is fundamentally the same between cloud and on-premises products.
While the data lake is the foundational component in the Observe platform, Splunk relies on indexers at the core of its architecture. The indexers ingest raw machine data, parse it into events that are stored on disk, and build indexes to enable retrieval.
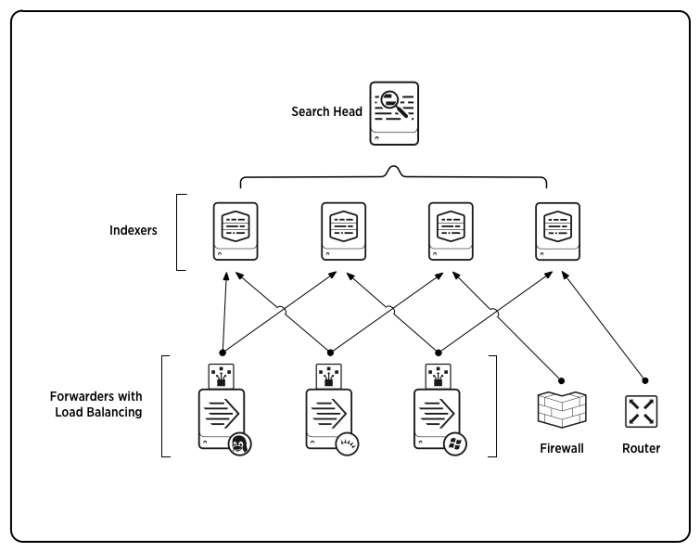
Indexers perform both storage and retrieval functions in Splunk. They are complemented by forwarders, which collect data from source systems and ship it to indexers, and search heads, which orchestrate queries across the set of indexers. Splunk organizes indexed data into buckets, which the indexers manage. In the default architecture, indexers store searchable buckets on local disk, although there is an option to offload warm and cold buckets to object storage with Splunk’s SmartStore feature.
Observe, in contrast, ingests all telemetry—logs, metrics, and traces—into a cloud data lake where data is kept hot and searchable. Using low-cost Amazon S3 storage for the data lake allows Observe to scale efficiently to large data volumes.
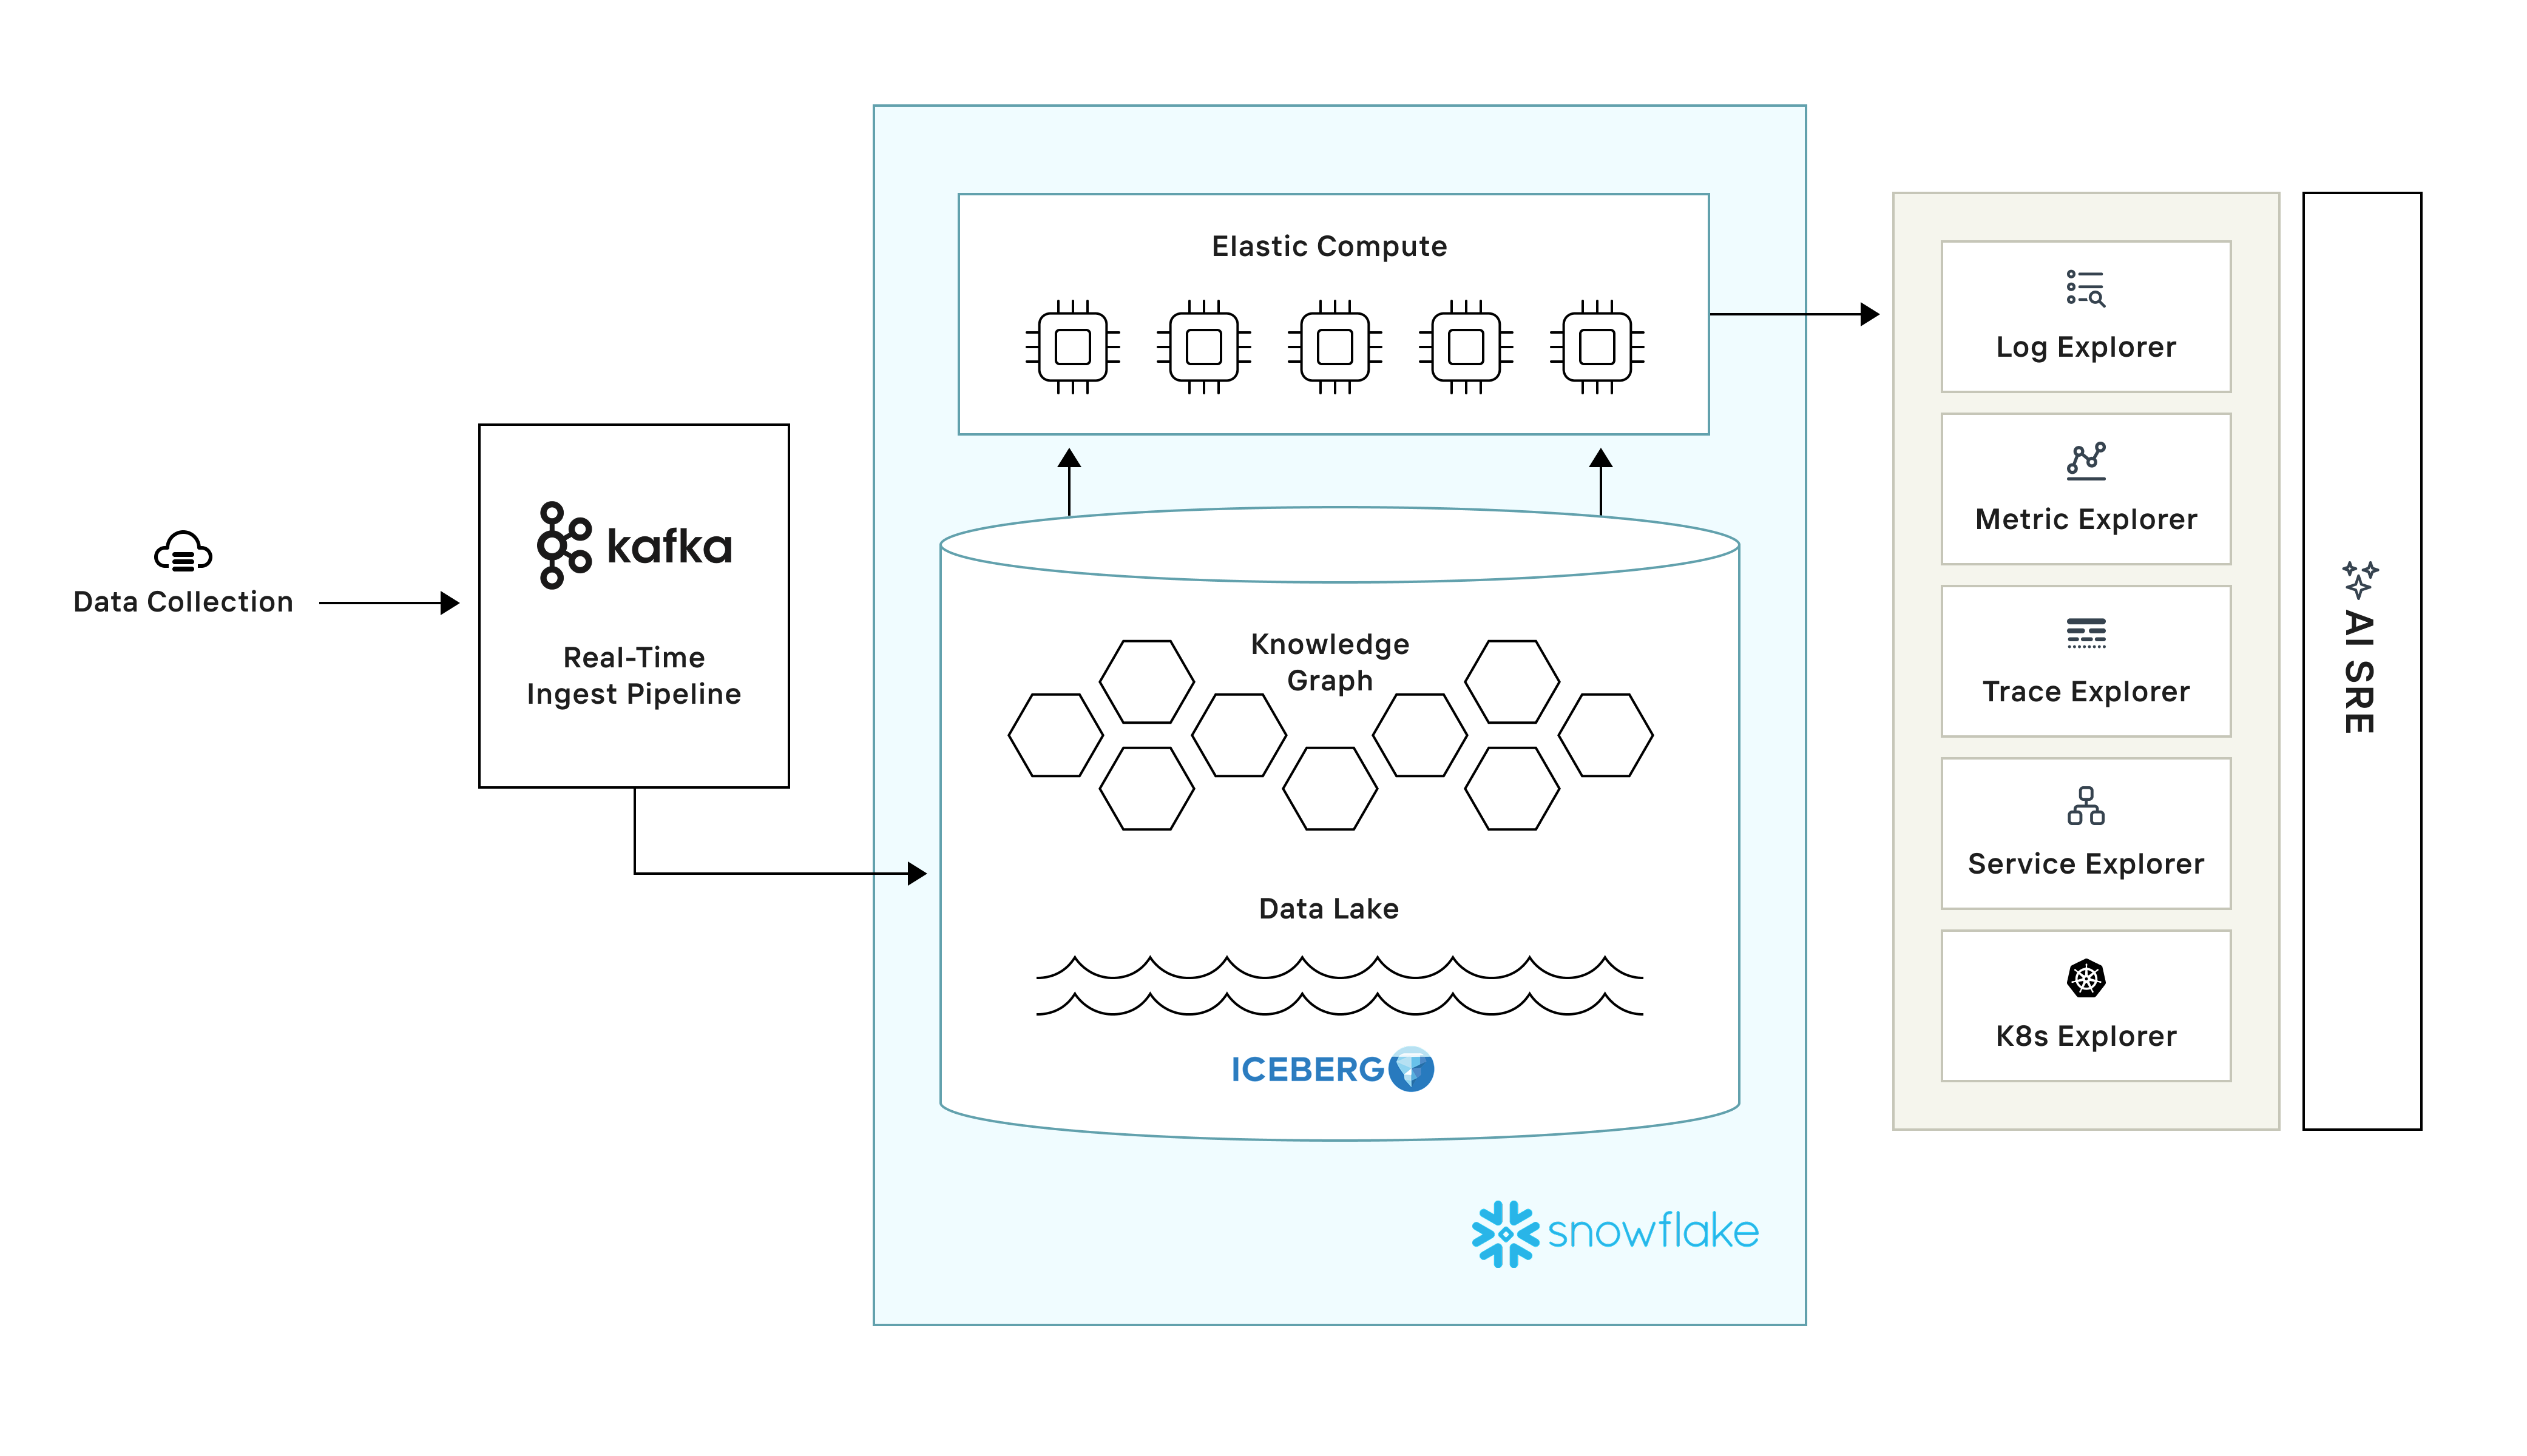
Observe ingests data through a real-time streaming pipeline using Apache Kafka. Running on Snowflake infrastructure, Observe allows data to be queried using Snowflake virtual warehouses for compute.
Splunk’s architecture colocates both compute and storage on indexers. The use of SmartStore can offload cold storage, but hot storage remains bound to compute, limiting elasticity and creating inefficiencies in resource utilization.
Observe decouples compute and storage, a concept popularized by Snowflake, allowing each to scale elastically and independently. Compute can be scaled up and down depending on ingest or query load while cloud object storage can economically hold as much telemetry as needed, ensuring efficient use of resources.
Splunk’s architecture uses the same servers to ingest and index data as well as to serve search queries. In addition, every search needs to run on all indexers in the cluster because data is distributed across the local storage of each indexer. There is no way to achieve performance isolation when every user’s ingest and search workloads compete for the same indexers, giving rise to noisy neighbor challenges. As resource consumption from one workload can easily interfere with another, Splunk users may need to run multiple Splunk tenants to isolate workloads, leading to further inefficiencies.
By using Snowflake virtual warehouses in its underlying infrastructure, Observe has access to compute instances that have their own independent compute resources, allowing users to run on different warehouses without runtime interference. Observe schedules queries on distinct warehouses, using cached data loaded from object storage. This effectively provides performance isolation at the query level, allowing multiple workloads to share the same data and removing the need for multiple tenants and multiple copies of the data.
Splunk has multiple engines for different telemetry types. While Splunk’s original use case is in logs with Splunk Enterprise and Splunk Cloud, metrics and traces are supported through Splunk Observability Cloud, by way of its SignalFx and Omnition acquisitions. Logs, metrics, and traces are stored across separate backends, queried using different query languages, and surfaced to users via different UIs.
Observe ingests all telemetry into its data lake and provides unified visibility across different logs, metrics, and traces. It enables analytics across disparate telemetry types using a single query language and one consistent UI, allowing users to easily pivot across related telemetry. In addition, Observe offers an AI SRE that allows users to ask questions about their system and investigate issues in natural language using a chat interface.

The most common way to ingest data into Splunk is through its Splunk Universal Forwarder. All Splunk-owned agents, including the Universal Forwarder, are proprietary. Several non-proprietary alternatives, such as for OpenTelemetry and Logstash, exist for Splunk, but they are supported through the community.
The Observe Agent, used to collect telemetry and send it to Observe, is built on the OpenTelemetry Collector to allow vendor neutrality and use of community-developed extensions. This approach ensures interoperability and avoids lock-in.
Splunk indexers are designed to ingest and make data searchable as quickly as possible through their parsing and indexing pipelines. Splunk optimizes for low-latency ingestion by distributing load across indexers in the cluster and tightly coupling the indexing to storage so data becomes queryable seconds after arrival.
Observe ingests into its data lake via its streaming ingest pipeline backed by Kafka. Kafka acts as a resilient, scalable buffer and is able to hold data for further processing, even if it is bursty or arrives at a high rate. Observe microbatches data from Kafka to the data lake, where it is made searchable. Users will typically experience ingest latencies in the 10s of seconds.
While Splunk can ingest with lower latency, its index-based architecture results in write and storage amplification. This indexing overhead drives up ingestion and storage costs, which become more significant at scale.
In contrast, Observe is tuned to balance latency and cost by buffering incoming data and writing optimally sized batches–up to 100s of MBs–to the data lake, with no indexing overhead. With this approach, ingestion efficiency increases with greater data volume, such that the economics of loading data into Observe become more favorable at scale.
Splunk maintains raw events in its indexes, alongside metadata and index structures, and does not enforce a fixed schema at ingest. The field structure is applied later at search time through the use of field extractions and lookup tables.
Since queries reliant on regex-based search-time field extraction will become slow at high data volumes, Splunk provides two options to aid with performance: index-time field extraction and data model acceleration. The creation of custom fields at index time generally yields better query performance but is impossible to change once configured. Data model acceleration involves computing summaries to speed up repeated queries of the data and retains more flexibility to evolve field definitions. Both methods incur a storage overhead because of the additional structures being built.
In Observe, all raw data lands in the data lake before being transformed into derived datasets, which are materialized views that can better take advantage of the columnar analytics Snowflake enables. While Splunk queries and dashboards may suffer poor performance because they are reading raw logs with search-time field extraction, Observe stores fields in columns and only reads the columns needed. With less data to scan, Observe offers vastly faster and more efficient analytics.
In summary, Observe users retain the full flexibility of a schema-on-read approach, with no upfront schema definition and the ability to rematerialize from the raw data if needed. Unlike with search-time field extraction, the optimized views in Observe deliver fast analytic performance at scale.
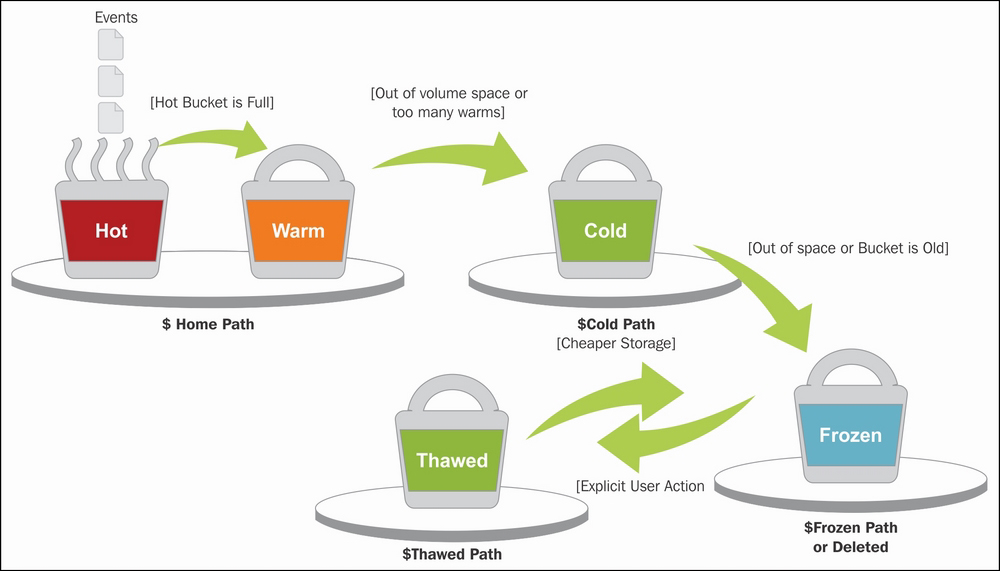
To mitigate the high cost of high-performance storage, Splunk organizes data into hot, warm, cold, and frozen buckets, representing different stages in the data lifecycle. Splunk Enterprise uses fast, high-IOPS disks like SSD for the hot tier and spinning disk for the warm and cold tiers, while frozen buckets are deleted and archived externally. For data tiering in Splunk Cloud, data is organized between a searchable tier and an archival tier.
No special action is required when data moves within the searchable tiers, although search will be slower on colder tiers. Rehydration is required to make frozen or archived data searchable again. The rehydration step, also called thawing, involves reingesting buckets, which can take hours and consume compute and storage resources.
Observe retains all data in cloud object storage, effectively forming a single hot tier. Keeping large datasets searchable is economically feasible in Observe’s case because the data is highly compressed–10x on average–and is stored on low-cost, commodity S3. Data in Observe’s data lake is instantly accessible without the need for rehydration or thawing.
Due to the much higher cost of storing data in Splunk, users will regularly employ techniques such as filtering and sampling telemetry or reducing data retention to shrink their data footprint. Side effects of retaining less data include the risk of blind spots in data coverage and the need to rehydrate data that has been archived after the retention period to make it searchable in Splunk. While Observe users typically implement a 13-month data retention, which is the default, it is not uncommon for Splunk users to retain less than 30 days of data for cost reasons.
Splunk’s SPL is a search-centric language that uses an event-first model. It has limited support for joins, with joins scaling poorly in Splunk. SPL is primarily used for log analytics. Since Splunk’s metrics capabilities were added later using a separate storage engine, users will experience inconsistent syntax between logs and metrics use cases in Splunk. Splunk Observability Cloud, which is used for metrics, has a different query language called SignalFlow.
Observe’s OPAL language borrows heavily from SQL and uses a table-centric data model, where users query rows and columns. Built for modeling cross-resource relationships, OPAL supports true relational joins and uses the same syntax across all telemetry and data types–logs, metrics, and traces. OPAL compiles down to Snowflake SQL to take advantage of Snowflake’s fast columnar analytics and scalable data warehouse backend.
It is essential to connect disparate telemetry types to form a coherent picture of system behavior. Correlation across datasets enables more effective root cause analysis and greater contextual understanding, including the ability to tie technical issues to business impact.
In Splunk, users connect related data in SPL using joins and transactions. Joins work similarly to SQL joins, merging two datasets on a common field. Transactions stitch together related events based on a correlation key and a time window to build a higher-level view of activity. Joins in Splunk are compute- and memory-intensive, making them less usable when working with large datasets.
Observe automatically builds a context graph that links resources and events based on foreign key relationships for easy correlation. Crucially, this correlation is pre-modeled into the system, so traversals are efficient and intuitive. This allows users to pivot across dimensions without using explicit joins at query time. As a result, users can perform faster root cause analysis even on large-scale telemetry.
Splunk supports a wide range of chart, table, and geospatial visualization types. Users requiring a high degree of customization can use Dashboard Studio’s drag-and-drop interface for more flexible layouts and more modern visualization options. Splunk users also have access to prebuilt dashboards from Splunkbase apps and can extend their platform capabilities with Splunk Enterprise Security, a SIEM solution that ships with many out-of-the-box dashboards that accelerate security operations.
Observe also offers a variety of visualization types and a drag-and-drop interface, with a focus on strong investigation and root cause analysis capabilities. Observe includes a number of visual explorers for logs, metrics, trace, Kubernetes, and APM use cases. Users can get comprehensive views of their systems by drilling and pivoting across telemetry types.
The core Splunk architecture has compute and storage colocated on Splunk indexers, so it is not possible to scale compute independently of storage. Capacity planning with this setup is complex, because users need to size Splunk for peak ingest and search workloads and take into consideration replication factors and storage profiles for different tiers. Common workarounds for the lack of elastic compute include overprovisioning, throttling workloads, or precomputing results to reduce CPU load.
Splunk Cloud may simplify scaling operations by separating compute and storage. In this cloud architecture, data can be persisted in object storage with Dynamic Data: Active Archive (DDAA), so independent scaling of compute and storage is possible. However, provisioning additional compute is not as automated, as customers go through Splunk support to adjust capacity.
Observe is a cloud-only platform, offered as SaaS, so users perform no manual scaling or infrastructure management. Due to its cloud data lake architecture, it autoscales compute and storage independently as needed. To optimize for query latency and resource utilization, Observe maintains pools of Snowflake warehouses of different sizes and routes queries to each size of warehouse depending on their complexity. This enables Observe to respond to bursty query and ingest workloads–based on time of day, holidays, or black-swan news events–without overprovisioning compute.
Splunk stores data in proprietary index files using an internal format, so other tools cannot directly access its data. The data would need to be replicated in both Splunk and a second system for the same data to be used in multiple places.
Observe is committed to open data formats to facilitate data sharing and reuse. It supports Apache Iceberg, writing and reading Iceberg tables in a customer’s data lake. This allows observability data to be used by multiple tools without the need for replication. It also bridges observability and other data analytics use cases, enabling observability data to be analyzed alongside business and application data.
Splunk is widely considered to be priced at a premium compared to other observability platforms, especially at high scale. In addition, its pricing is complex and unpredictable because of difficulty in forecasting usage and the use of mixed pricing models–workload-based and ingest-based. Lack of predictability can lead to overprovisioning in one direction or costly overages in the other.
Observe has adopted a simpler pricing model based on ingest. Elastic compute is included in the price to accommodate peak usage. To provide customers as much predictability as possible, Observe does not charge overages when workloads spike.
Splunk has been one of the pioneers of indexed log search. Its index-based architecture made unstructured logs searchable and provided engineering teams with increased visibility into their log data. Over time, Splunk expanded into metrics, traces, and security analytics, and now, as part of Cisco, is part of a larger suite of tools that is in use at many enterprises.
That said, Splunk’s architecture reflects what was possible at the time it was built. Indexers that couple compute and storage, reliance on tiered data retention, and fragmented backends for different telemetry types create inefficiencies that compound as data volumes grow. At scale, these design choices lead to higher ingestion costs, complex capacity planning, and limits on cross-telemetry correlation.
Observe takes a different approach, having been built in the cloud era where elastic compute and cheap object storage are the norm. Its architecture separates compute from storage, stores all telemetry in a unified data lake, and models relationships across datasets upfront. This enables efficient ingestion, long-term retention without rehydration, and consistent performance for queries and correlations at scale.
In short, Splunk remains a widely adopted platform today, but its index-driven design imposes structural limits when operating at scale. Observe’s data lake architecture, elastic separation of compute and storage, and unified telemetry model make it purpose-built for the volume, diversity, and economics of modern observability. For organizations facing observability challenges today, Observe offers the more scalable and future-ready platform.
