Book a Demo
For information about how Observe handles your personal data, please see our Privacy Policy.
For information about how Observe handles your personal data, please see our Privacy Policy.


The ELK Stack is a log-centric observability platform that originally comprised Elasticsearch, Logstash, and Kibana but has since grown to include newer components like Beats and Elastic Agent. Observe is a more modern observability platform, conceived as a SaaS offering and built to ingest, store, and analyze telemetry at scale. While both platforms are used for log management and analytics, their design philosophies diverge sharply. This paper explores how these differences affect scalability, performance, and operational simplicity.
Elasticsearch was first released in 2010, and the ELK Stack was formed in 2013. ELK built on Elasticsearch’s distributed search engine to provide a flexible platform for log analytics. It was architected in an era of self-hosted deployments and relatively smaller data volumes, especially when compared to today’s data requirements. Additional components were grouped under the ELK umbrella over time, but the core of the ELK Stack remained an inverted index–driven search system based on Elasticsearch.
Observe, founded in 2017, was designed for the cloud-native era, where telemetry volumes have grown exponentially and where object storage and elastic compute are widely used in scalable architectures. Instead of extending an index-based model, Observe builds on a cloud data lake, separating compute from storage, and applies columnar analytics to large-scale telemetry. Its design centers on a relational, cross-telemetry model built for real-time correlation.
The following sections examine the architectural and operational contrasts between the ELK Stack and Observe, including differences in data ingestion, storage, analytics, and management. Elasticsearch is the foundational component of the ELK Stack, so much of the discussion will focus on core Elasticsearch. While an Elastic Cloud Serverless offering exists, the vast majority of ELK users are on more conventional self-hosted or cloud-managed deployments. The technical discussion below will use a managed Elasticsearch service, such as Elastic Cloud, as a baseline, but will broadly apply to all types of Elasticsearch deployments apart from some storage considerations that are different in the serverless version.
Elasticsearch clusters are composed of several types of nodes. Master nodes manage the cluster’s state, elect leaders, and coordinate shard allocation to keep the system stable. Ingest nodes preprocess incoming data through pipelines that transform, enrich, or filter documents before indexing. Coordinating nodes handle client requests, distribute queries across shards, and merge partial results into a single response. Data nodes are the critical component of an Elasticsearch cluster, responsible for storing and managing the actual data.
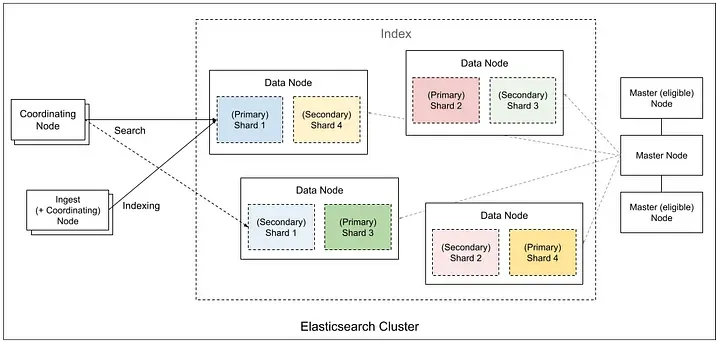
Data nodes are responsible for indexing, storage, and query execution. They hold the shards that contain the indexed documents, with data distributed across multiple data nodes using replicas for scalability and fault tolerance. Data nodes handle all data-related operations, including CRUD, search, and aggregations. They form the backbone of the cluster’s indexing and search performance, which is highly dependent on the speed of the underlying storage, so data nodes largely utilize local disk, particularly high-performance NVMe SSDs.
Observe, in contrast, ingests all telemetry–logs, metrics, and traces–into a cloud data lake through a real-time streaming pipeline based on Apache Kafka. Observe uses low-cost Amazon S3 for the data lake, while compute is provided through Snowflake virtual warehouses, enabling scalable query performance.
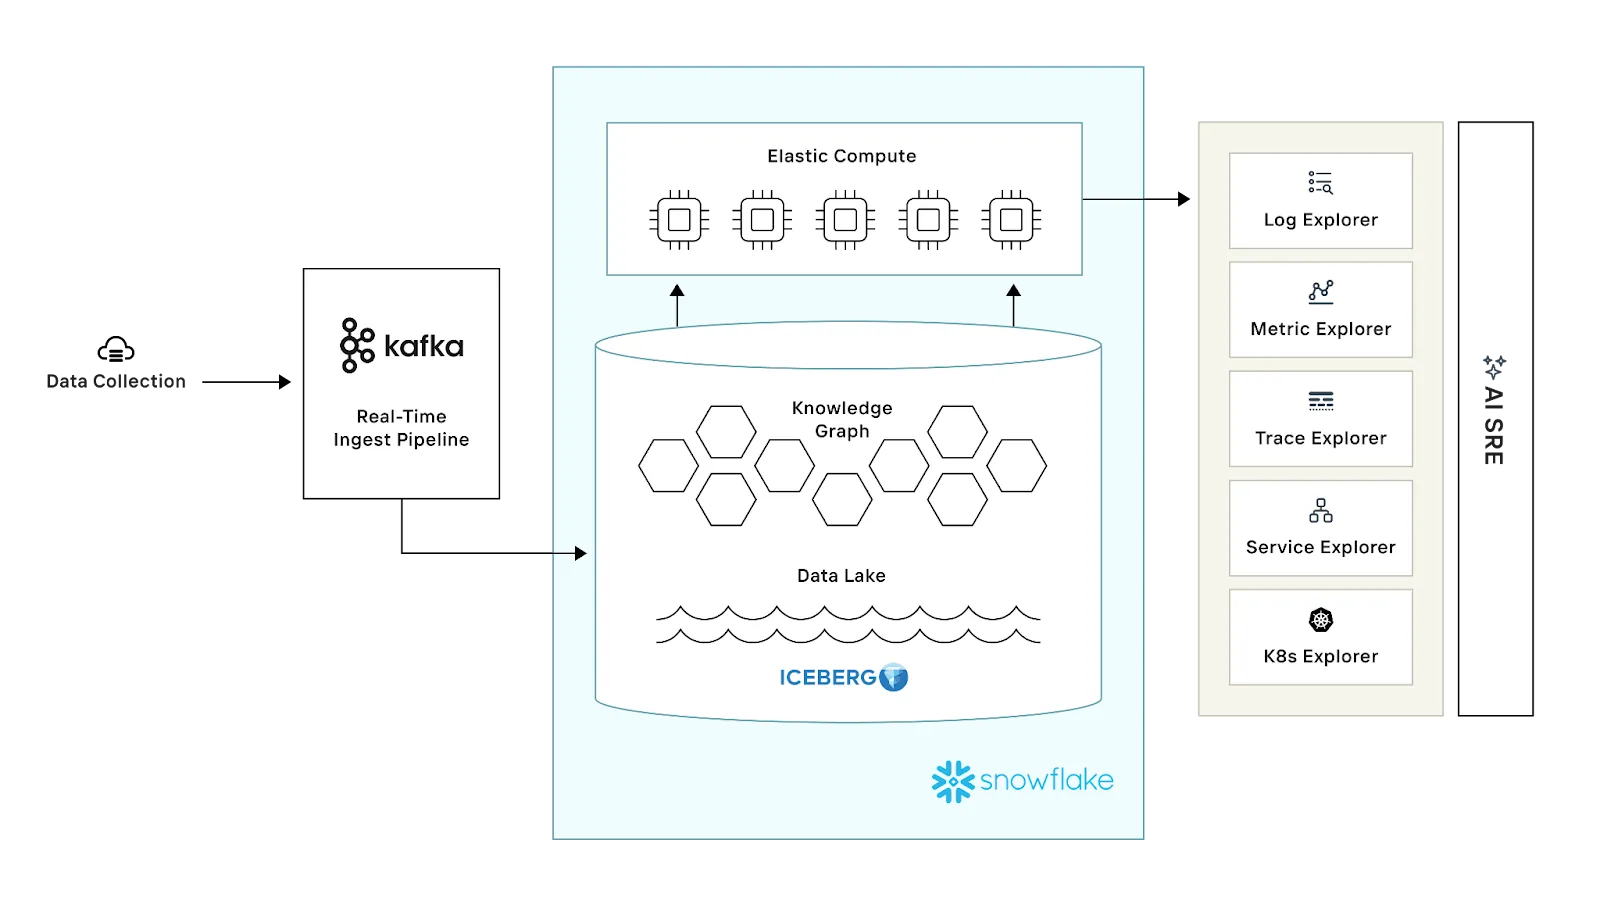
The Observe architecture allows the preservation of raw data in the data lake while maintaining derived, columnar views for fast analytics. Because the data lake provides effectively infinite capacity very cost-efficiently, data can be retained and kept hot and searchable far longer.
Compute and storage are colocated and tightly coupled in Elasticsearch’s data nodes. Scaling query or indexing capacity requires provisioning more data nodes, regardless of whether storage or compute is the bottleneck. Elasticsearch’s data node design creates inefficiency and complexity in scaling, especially for bursty workloads. Scaling for a short-term query spike means scaling out the entire cluster, which gives rise to underutilized storage and requires redistributing data in the cluster.
Elasticsearch’s frozen tier has the ability to offload data from the data nodes and use object storage instead of local disk–at the cost of much higher query latency. Elasticsearch also can use object storage with its newer serverless architecture, but adoption is still low and the vast majority of Elasticsearch users still operate data nodes that handle both storage and query execution.
Observe separates compute from storage completely, a concept popularized by Snowflake. Compute clusters in Observe can scale elastically and independently of data storage. This provides efficient resource utilization, enabling users to scale compute for query bursts or ingest spikes without overpaying for storage-bound resources.
In Elasticsearch clusters, indexing, and querying all occur on the same nodes. As a result, heavy search workloads can starve indexing processes, or vice versa. In addition, because all queries run across all nodes containing shards of the data, there is no native performance isolation. This noisy neighbor effect often forces administrators to create separate clusters for different workloads, increasing operational burden and data duplication.
Observe avoids this issue entirely by leveraging Snowflake virtual warehouses. Each warehouse has isolated compute, so ingestion and query workloads can operate independently. Multiple users can query the same data simultaneously without resource contention, ensuring predictable performance across teams and workloads.
The ELK Stack is primarily used for logs, and while it also supports metrics and traces, adoption is low. Logs, metrics, and traces are typically ingested via separate pipelines, and a possible setup for collecting telemetry may involve Logstash for logs, Metricbeat for metrics, and APM agents for traces. While logs, metrics, and traces are all stored in Elasticsearch indexes, their index structures, storage engines, and query paths are quite different under the hood. Correlation across telemetry types can be difficult, manual process, and recent updates such as Elastic Common Schema (ECS) and Kibana’s Observability UI seek to simplify this. ECS does have several drawbacks, however, as it is not extensible, locks users into a predefined schema, and does not allow for correlating business data to telemetry data.
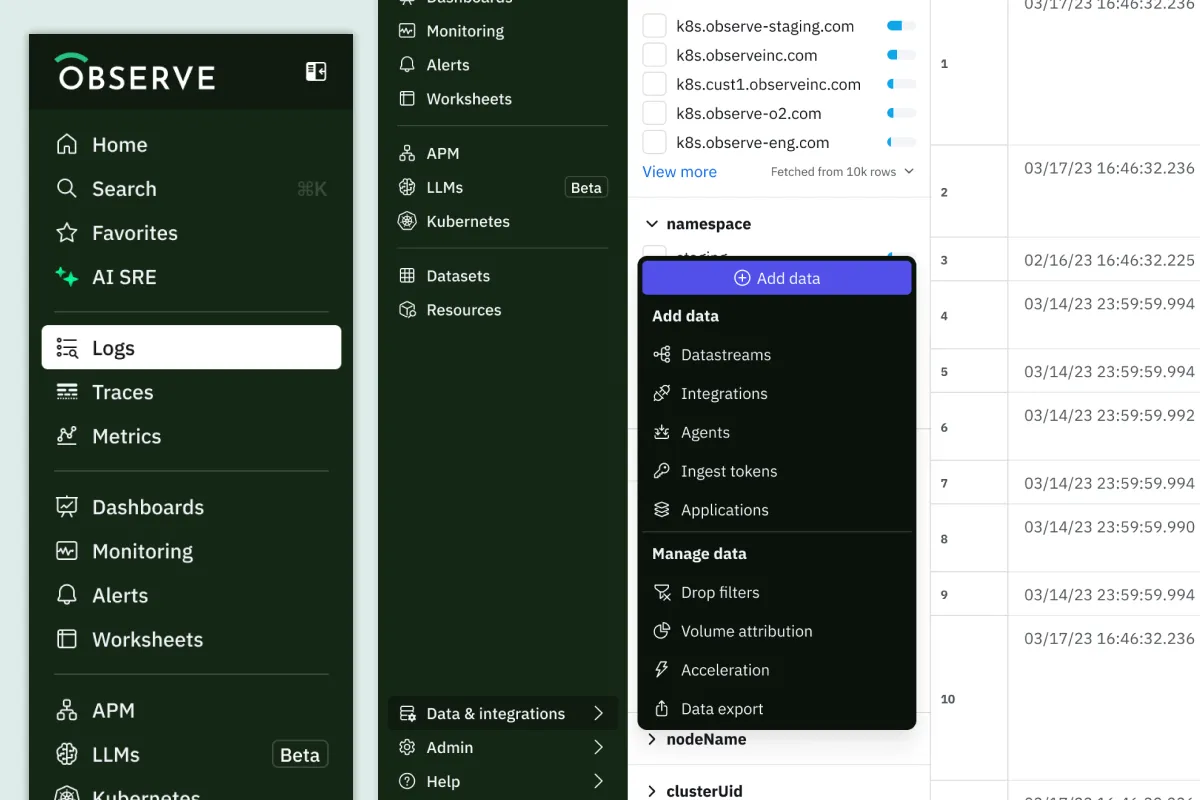
Observe provides unified visibility across logs, metrics, and traces. Its Observe Agent collects and sends all telemetry to Observe, where raw data is stored in a data lake, to be transformed and structured later. The common ingestion and backend make it easy to enable analytics across disparate telemetry types, using a single query language and one consistent UI, allowing users to seamlessly pivot across related telemetry and explore relationships in context. Additionally, Observe offers an AI SRE that allows users to ask questions across their telemetry and investigate issues in natural language using a chat interface.
The ELK ingestion ecosystem has expanded to include many tools aside from Logstash–the “L” in ELK. While legacy tools, like Logstash, Beats, and Elastic APM, are open source and Elastic provides an EDOT (Elastic Distribution of OpenTelemetry) Collector, the ELK Stack appears to be converging on the proprietary Elastic Agent as the recommended tool for collecting and forwarding data to Elasticsearch, increasing the risk of vendor lock-in.
The Observe Agent, used to collect telemetry and send it to Observe, is built on the OpenTelemetry Collector, ensuring vendor neutrality and compatibility with community extensions. This approach avoids vendor lock-in and simplifies integration with other monitoring and tracing tools already standardized on OTel.
ELK supports multiple methods for real-time ingest, both using Logstash and through direct ingestion. Elasticsearch’s distributed architecture spreads its shards across multiple nodes, which allows indexing to be parallelized for better ingest performance. Ingest latency can typically be in the single-digit seconds.
Observe ingests into its data lake via a Kafka-based streaming ingest pipeline. Kafka acts as a resilient, scalable buffer and is able to hold data for further processing, even if it is bursty or arrives at a high rate. Observe microbatches data from Kafka to the data lake, where it is made searchable with typical ingest latencies in the 10s of seconds–slightly higher latency but with much greater efficiency.
Index-based systems like Elasticsearch suffer from write and storage amplification due to its indexing data structures. It is common for 1 TB of ingested logs to expand to 1.3 TB due to indexing overhead, and with 2x replication, ultimately become 2.6 TB on disk. This amplification drives up both storage and compute costs, which become more significant at scale.
In contrast, Observe is tuned to balance latency and cost by buffering incoming data and writing optimally sized batches–up to 100s of MBs–to the data lake. There is no index amplification, and data is compressed 10x on average. With this approach, ingestion efficiency increases with greater data volume, such that the economics of loading data into Observe become more favorable at scale.
Elasticsearch stores logs as JSON and indexes data for fast search. It uses a schema-on-write model, meaning schema needs to be predefined. Every index must have mappings defining field names and types before ingestion, and there is very little post-ingest data transformation ability. Changes to data schema require reindexing, which can be operationally expensive. This rigidity forces teams to predict schema needs upfront and expend considerable SRE effort to manage indexes as telemetry sources evolve.
In Observe, all raw data lands in the data lake before being transformed into derived datasets, which are materialized views that can better take advantage of the columnar analytics Snowflake enables. Observe stores fields in columns, so queries scan only the relevant columns. With less data to scan, Observe offers vastly faster and more efficient analytics.
Observe users retain the full flexibility of a schema-on-read approach, with no upfront schema definition. Users can redefine or rematerialize derived datasets at any time, enabling flexibility and adaptability as data evolves.
Elasticsearch’s tiered storage model–hot, warm, cold, and frozen–was designed to reduce cost by moving older data to slower, cheaper storage. Hot and warm tiers reside on node-based local disks, while frozen data moves to object storage. However, this introduces operational complexity. Querying across tiers suffers from unpredictable latency. In addition, querying older data using searchable snapshots, typically in the frozen and cold tiers, requires rehydration, which is time-consuming and resource-intensive. Managing data tiers becomes less of an issue with users moving to the serverless architecture, but data tiering is hard to use in general and remains a major pain point with users of the ELK Stack.

While the use of data tiering does mitigate the cost of data retention, the cost of storage in Elasticsearch remains high due to write amplification. As a result, ELK users typically keep only 7-30 days of searchable data for cost reasons.
Observe dispenses with tiering entirely. All telemetry remains hot and queryable on S3 object storage. Keeping large datasets searchable is economically feasible in Observe’s case because the data is highly compressed–10x on average–and is stored on low-cost, commodity S3. Data in Observe’s data lake is instantly accessible without the need for rehydration.
Due to the much higher cost of storing data in the ELK Stack, users will regularly employ techniques such as filtering and sampling telemetry or reducing data retention to shrink their data footprint. Side effects of retaining less data include the risk of blind spots in data coverage and the need to rehydrate data that has been archived after the retention period to make it searchable in Elasticsearch. Observe users typically implement a 13-month data retention, which is the default, significantly more than the days to weeks of retention that is typical with ELK.
Users may interact with multiple query languages in their use of the ELK Stack. Elasticsearch Query DSL, a JSON-based query language, is the native language for searching and aggregating data in Elasticsearch indexes. If accessing data through Kibana, KQL (Kibana Query Language) provides a simpler, human-readable syntax for filtering and searching observability data in dashboards.
While existing ELK deployments may use KQL and Query DSL, ES|QL is being promoted as the new unified query language for the ELK observability stack. ES|QL is a SQL-like language operating on a table-based model and integrated with Kibana.
Observe’s OPAL (Observe Processing and Analytics Language) is purpose-built for observability. It borrows heavily from SQL and uses a relational, table-centric mode, where users query rows and columns. Built for modeling cross-resource relationships, OPAL supports true relational joins and uses the same syntax across all data types–logs, metrics, and traces. OPAL compiles into Snowflake SQL, taking advantage of Snowflake’s distributed, columnar computation and scalable data warehouse backend.
When using Elasticsearch, correlation depends on adherence to the Elastic Common Schema. Users structure telemetry around ECS, which provides a consistent way to model data, but this can constrain flexibility and require significant upfront schema work. ECS also cannot easily model business-specific schemas that do not map cleanly to existing fields that were designed for IT infrastructure concepts.
Another way to perform correlation at query time is through cross-index joins, which ES|QL supports. While this improves upon the functionality available in Query DSL and KQL, performance is very much dependent on factors like dataset size and cardinality. ES|QL joins are possible on small tables but do not scale efficiently to handle large datasets.
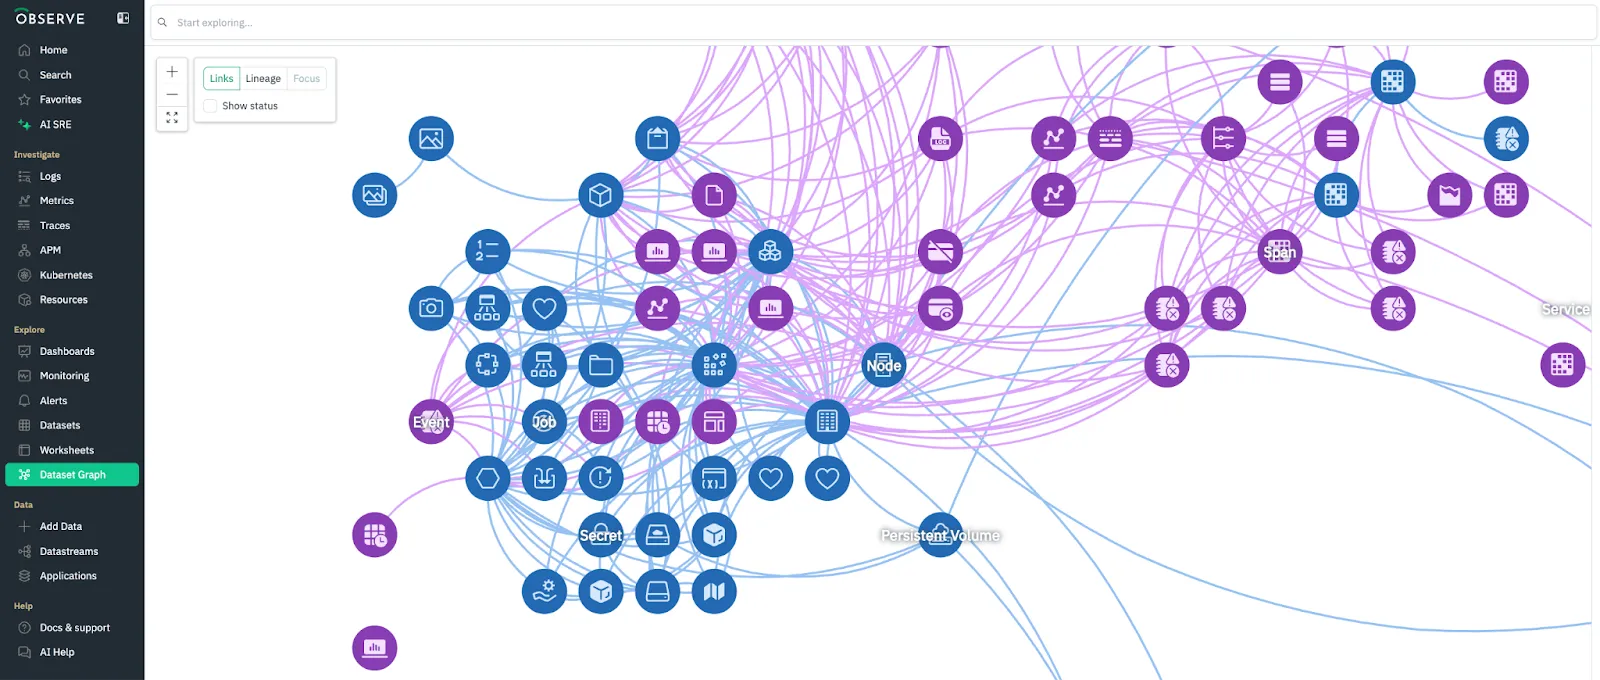
Observe automatically constructs a context graph that links resources–pods, services, users, and hosts–and events based on foreign key relationships for easy correlation. Crucially, this correlation is pre-modeled into the system, so traversals are efficient and intuitive. This allows users to pivot across dimensions without using explicit joins at query time. As a result, users can perform faster root cause analysis with rich context even on large-scale telemetry.
Kibana, ELK’s visualization layer, offers diverse chart types and many customization options. Users can configure visualizations using drag-and-drop arrangement and resizing of panels. Given its tight coupling to Elasticsearch, Kibana serves multiple use cases, including observability, security, and search, and is reliant on the underlying Elasticsearch cluster and the consistent use of ECS for performance.
Observe also offers a variety of visualization types and a drag-and-drop interface, with a focus on strong investigation and root cause analysis capabilities. Observe includes a number of visual explorers for logs, metrics, trace, Kubernetes, and APM use cases. Users can get comprehensive views of their systems by drilling and pivoting across telemetry types within a unified interface. Observe users have the additional option of interacting with telemetry through its AI SRE chat interface, which is able to generate relevant visualizations in response to the questions asked.
Capacity planning for ELK clusters presents significant operational challenges primarily because the architecture colocates compute and storage on data nodes. This tight coupling necessitates a complex scaling approach where administrators must size node counts and storage tiers to accommodate peak workloads for both ingestion and querying.
While Elastic Cloud offers some relief by managing the infrastructure, it is closer to a PaaS offering than a true SaaS, as users must still perform capacity planning and scaling by selecting and sizing specific node types and tiers. Since underestimating the load can lead to critical issues like query failures or data ingestion backlogs, overprovisioning is a common and costly practice to ensure resilience.
Operating at scale requires continuous, manual tuning of parameters such as shard counts, replica factors, heap sizes, and index rollover schedules in addition to time-consuming upgrades. The newer serverless architecture will mitigate the need for capacity planning and cluster management, but most at-scale ELK clusters today remain self-managed or Elastic Cloud deployments.
Observe is a cloud-only platform, delivered as fully managed SaaS, so scaling and cluster management are abstracted away from users. Due to its cloud data lake architecture, it autoscales compute and storage independently as needed.
To optimize for query latency and resource utilization, Observe maintains pools of Snowflake warehouses of different sizes and routes queries to each size of warehouse depending on their complexity. This enables Observe to respond to bursty query and ingest workloads–based on time of day, holidays, or black-swan news events–without overprovisioning compute.
Built upon Apache Lucene, Elasticsearch ingests data in JSON format and then stores it using Lucene’s index format. While the Lucene file format is publicly documented, it is meant as an internal format. To share data outside of Elasticsearch, users would need to retrieve documents in JSON format via Elasticsearch’s API and duplicate it into other systems.
Observe is committed to open data formats to facilitate data sharing and reuse. Its data lake is open by design, supporting Apache Iceberg for writing and reading tables in a customer’s data lake. This allows observability data to be used by multiple tools without the need for replication. It also bridges observability and other data analytics use cases, enabling observability data to be analyzed alongside business and application data.
Elastic Cloud pricing is based on resource usage. Users need to specify node types and sizes and plan for peak usage. Predicting total cost is challenging, and many teams overprovision to avoid performance degradation.
Observe has adopted a simpler pricing model based on ingest. Elastic compute is included in the price to accommodate peak usage. To provide customers as much predictability as possible, Observe does not charge overages when workloads spike.
ELK revolutionized log search and analytics, providing a flexible, open-source foundation for observability, but its index-based design struggles to scale efficiently as telemetry volumes grow. Tightly coupled compute and storage, data tiering, and schema rigidity create complexity and high operational overhead.
Observe takes a cloud-native approach built for scale. By separating compute and storage, unifying telemetry in an open data lake, and leveraging columnar analytics, Observe provides long-term data retention, low operational cost, and true correlation across telemetry types, unlocking faster and more intuitive root cause analysis.
In short, while ELK remains a powerful search platform, its architecture imposes structural limits on scalability and cost efficiency. Observe’s modern data-lake foundation and elastic compute architecture make it purpose-built for the volume, diversity, and economics of today’s observability workloads. For organizations facing observability challenges today, Observe offers the more scalable and future-ready platform.
