Product
Unified Observability
One Scalable Platform
Observe integrates logs, APM, and infrastructure monitoring into a single platform built for AI-driven investigation. Collect, analyze, and retain all your telemetry in a streaming data lake, without the cost or scale limits of other platforms.


Smarter, Contextual Troubleshooting with Observe
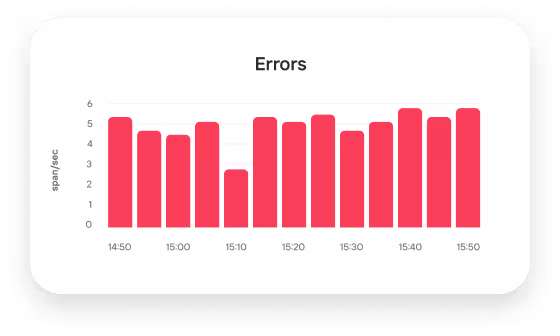
Frontend error rate is high
Critical errors, potentially leading to user frustration and lost revenue, are detected. On-call engineer receives an urgent notification.


AI SRE formulates a plan
AI SRE builds an investigation plan and delegates tasks to its agents. As work completes, it displays the results to the engineer responding to the incident.


Visualize service dependency map with APM
Correlate the frontend issue with degradation in the cart service using a consolidated service map automatically generated from OpenTelemetry data.


Infrastructure monitoring
Analyze pods for frontend services using out-of-the-box visualizations. Pivot to contextual logs as needed for faster root cause analysis and incident resolution.


Log analytics
Validate reasons for cartservice pod crashlooping. Search and analyze your logs without scale limits or retention constraints.

Chat-based root cause analysis
Because O11y summarizes your investigation as you go, you’ll never forget a step and always remember how you got to root cause. And it's stored securely in case you see something similar in the future.


One Product
All the Answers

Customer Success
Spot errors faster before customers do. Understand workflows with complete visibility.
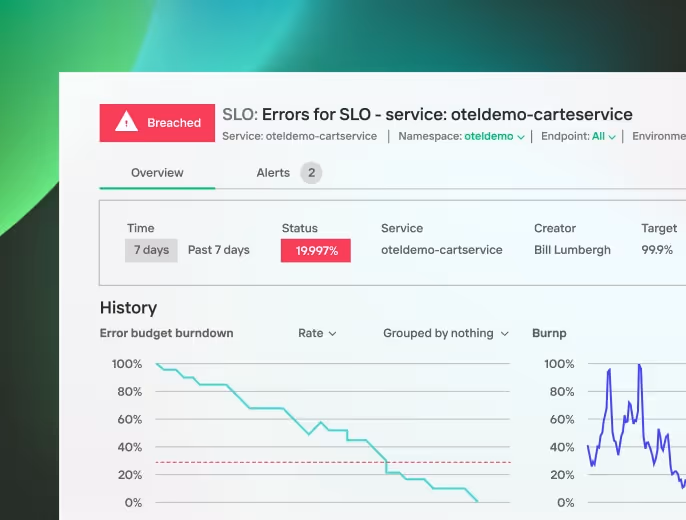
DevOps and SRE
DevOps and SRE teams achieve SLOs while spending less time putting out fires.

Application Developers
Whether it's logs, metrics, or traces, engineers will find the interface familiar and consistent with existing workflows.
