

Introducing Observe LLM Observability

Unlike traditional applications where errors are binary (it works or it doesn't), AI applications can fail by producing plausible but incorrect responses. A customer service chatbot might confidently provide outdated pricing information, or a code generation tool might produce syntactically correct but functionally broken code.
When your AI agents start hallucinating responses, you need visibility into multi-step reasoning chains, not a pile of logs or latency metrics. Your teams need to quickly trace through complex agent workflows, examine prompt engineering decisions, and correlate tool outputs to identify root causes before quality issues impact customer trust and revenue.
Today, we're excited to announce the public beta of Observe LLM Observability, which gives engineering teams complete visibility into AI application performance, costs, and behavior. We’ll walk through how the new LLM Explorer feature can be used alongside existing Observe functionality to enable three LLM use cases:
- Investigating quality of AI responses
- Cost optimization and token analytics
- Troubleshooting underlying AI infrastructure
Investigating Quality of AI Responses
Here's how you can use Observe LLM Observability to detect quality degradation and reasoning failures in your agentic AI workflows.
Let's say you're a major bank building a customer support chatbot and your testing shows that it’s providing incorrect account information and unhelpful responses. Instead of resolving customer inquiries or directing them to appropriate services, it's giving outdated fee information and suggesting irrelevant products that don't match customer profiles.
Start by locating the problematic session in LLM Explorer using the session ID. The trace view immediately reveals the complete request flow from user prompt to final response:

The agent, built using a planner-executor pattern, made several key decisions:
- Planned the initial customer inquiry analysis
- Made an OpenAI call to understand the customer's request
- Called the account lookup tool to retrieve customer data
- Planned a follow-up task based on the findings
- Made another OpenAI call to generate personalized recommendations
- Used the product catalog tool to suggest relevant services
- Returned the final response to the customer
To debug response quality, the first step is examining each LLM call's inputs and outputs. Clicking into the initial OpenAI call shows the full prompt structure and tool context. The model received the customer inquiry: ”I'm interested in opening a business account and want to know about monthly fees and minimum balance requirements.” It had access to the account lookup, product catalog, and customer history tools.
Next, examine the completion from this LLM call to understand the model's reasoning:
Here you discover the first issue: the model's response shows it correctly identified this as a business banking request but chose to use the account lookup tool instead of the business product catalog tool. The customer is asking about opening a new business account, which requires product information and fee schedules—not existing account data. But because the account lookup tool returned irrelevant personal banking details (the customer had no business accounts yet), the model mistakenly used this context to drive its recommendation.

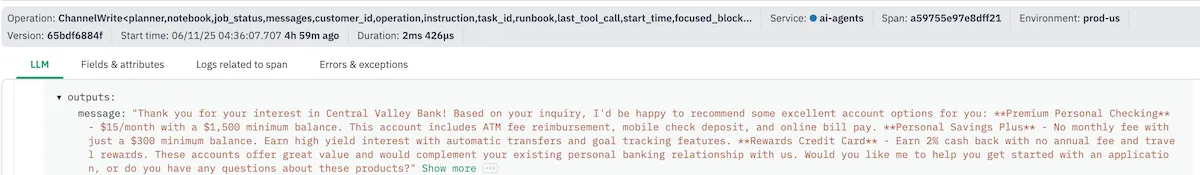
This incorrect customer context contaminated the entire downstream recommendation process. Check the final product recommendation tool call to see how this cascaded into the poor customer experience:

The model, working with irrelevant personal banking data, recommended consumer savings accounts and personal credit cards instead of the business checking accounts, merchant services, and commercial lending products that the customer actually needed:
Now you have enough information to identify what caused the poor AI response quality: the initial account lookup used incorrect customer identification logic, retrieving irrelevant personal banking context that led the model to provide consumer recommendations rather than business banking solutions. The fix involves improving the customer classification logic to properly distinguish between personal and business inquiries before performing account lookups.
Cost Optimization and Token Analytics
Your AI application that worked perfectly in testing can quickly become a budget nightmare in production. Real users have unpredictable interaction patterns – they ask longer questions, trigger complex reasoning chains, and use features in ways you never anticipated during development.
Observe's real-time cost tracking becomes essential once you're serving real traffic. You'll get immediate visibility when that seemingly innocent new feature starts consuming 10x more tokens than expected, or when a particular user workflow is driving up your OpenAI bill faster than your revenue can keep up.
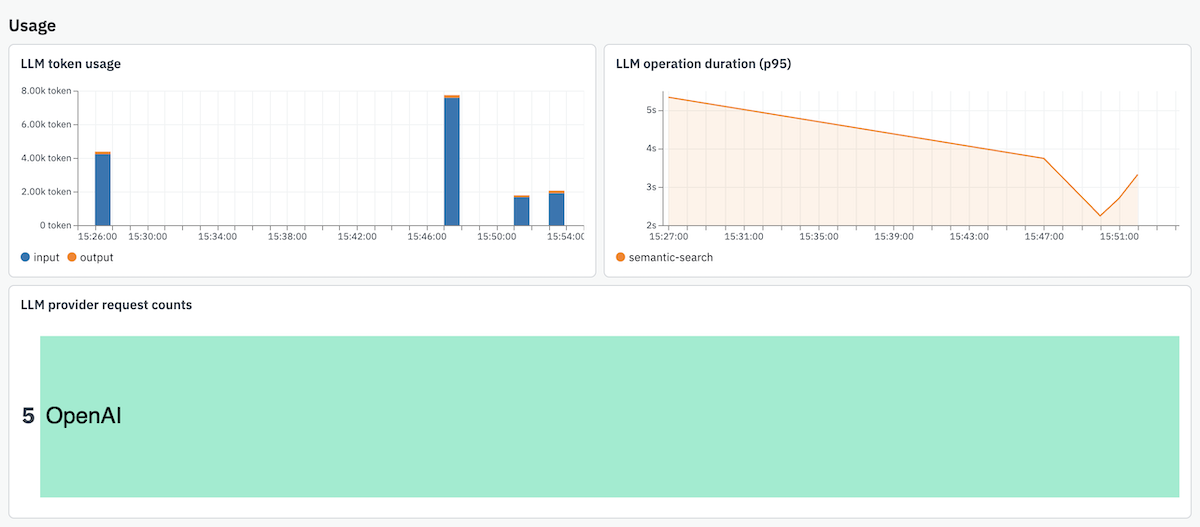
The token usage breakdown helps you optimize without sacrificing the quality you worked so hard to achieve. Maybe you discover that your verbose system prompts are inflating input costs unnecessarily, or that certain response formats are generating much longer outputs than needed. Provider cost comparison becomes crucial when you're operating at scale – the model that seemed cost-effective during testing might not be the best choice when you're processing thousands of requests per minute.
Troubleshooting Underlying AI Infrastructure
AI applications don't exist in isolation – they depend on databases, APIs, and container orchestration just like traditional services. When your AI agent starts crashing or becomes unresponsive, you need to quickly determine whether the issue stems from the AI logic itself or underlying infrastructure problems.
Here's how Observe helps you diagnose a real reliability issue: Your AI service enters a crash loop, taking down the entire container. Starting with Kubernetes Explorer, you can see the container restarts and navigate to the logs, which show a pattern of retry attempts and Postgres connection timeouts.

But the logs alone don't reveal why the connections are timing out – you need to understand what the AI application is doing that's causing these database issues. You then pivot to Observe APM, where you trace from the AI application failure back to the underlying Postgres transaction that's causing the issue.

The investigation reveals that the AI service is holding database transactions open too long during startup, exceeding Postgres timeout thresholds and causing connection termination.

By connecting AI application data to infrastructure and APM data in one platform, you avoid the manual correlation work across separate monitoring tools that typically makes these investigations time-consuming and error-prone.
Join the LLM Observability Public Beta
Ready to be among the first to gain complete visibility into your AI applications? Join our public beta today and help shape the future of AI application observability. Sign up for a free trial or contact your account team to get early access and see how comprehensive LLM observability transforms your AI development and operations.
