Blog


Observe Direct 2023: Our Biggest & Most Innovative Release Ever

Welcome back to Observe Direct! If you missed the full announcement video hosted by astrophysicist and astronomer Erika Hamden you can watch it via the embed below. Erika’s work has involved developing the advanced tools needed to observe the circumgalactic medium, so she knows more than a thing or two about the power of having good observability. To quote Erika, “If you want to discover a new thing about the universe, then you have to look at the universe in a new way.” Speaking of observing the unknown, it’s no coincidence that our latest update bears the name Project Hubble.
In a nutshell, Hubble is about allowing users to discover things they could never see before, and at a scale they never thought possible. Hubble is more than just new features, the new UX and purpose-built Explorers – with GPT built in – are a totally new way to look at your data. A year ago we introduced The Observability Cloud. Now we’ve built a whole new experience for The Observability Cloud that builds on the advantages of the Data Lake and Data Graph to make it even easier to explore your universe of data.
Company Update
Observability is more important than ever to organizations, even as unfavorable market conditions are forcing them to do more with less. This year 44% of organizations said they had negatively been affected by unfavorable market conditions and 61% of them experienced reduced budgets. The existing headwinds to reduce MTTR are being compounded by the need to reduce operating costs. Being able to achieve better observability for less money is exactly why so many of our customers have come to Observe.
Because observability is so critical to organizations of all kinds we’ve seen continued growth over the course of 2023. Commercially, Observe had already hit its yearly target by Q3. Observe now has almost 2,000 monthly active users, and they’re ingesting 175TB+ of data on average per day. We’ve already ingested more than 42PBs of data this year so far! A large financial services customer has even seen spikes amounting to an ingest rate of 1PB per day. This magnitude of data ingestion speaks to the elasticity Observe’s backend architecture is capable of.
To fuel our continued growth we’ve raised $50 million in Series A3 financing led by Sutter Hill Ventures, bringing total funding raised to date to $164.5M.
Project Hubble: A New Way to Observe
Project Hubble has been our code name for this set of major updates to Observe. There are already a lot of ways to use Observe to explore your data. Whether it’s starting with an alert and pivoting to the corresponding telemetry, opening a dashboard and drilling into the data, or zooming in on the Data Graph, there’s no right or wrong way. You can still do all that, but we want to ensure that users are able to get the information they need as quickly as possible, and so we designed several new experiences within Observe we call Explorers.
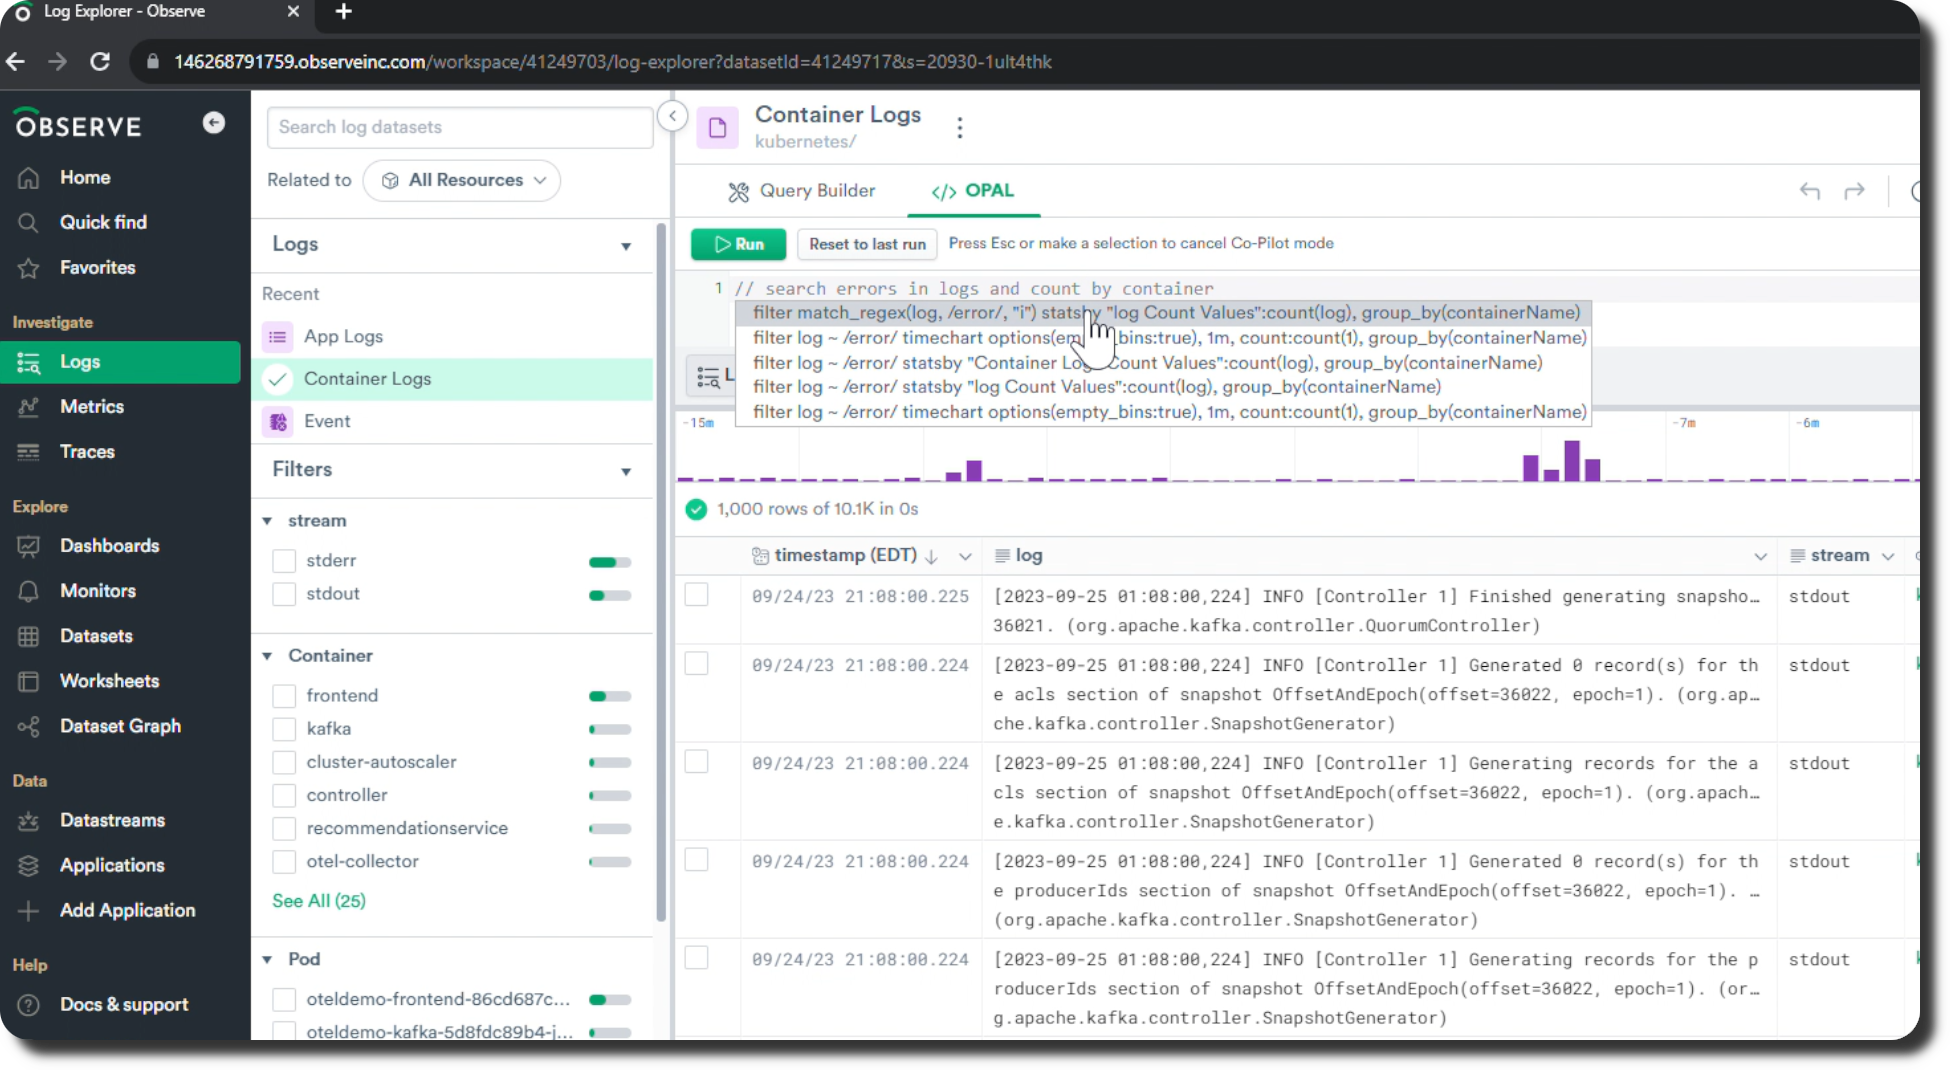
Log Explorer
If you want to go right to your logs to search, then you want Log Explorer. Looking at logs that lack useful structure? Right click and use O11y GPT Extract to automatically create the RegEx you need to bring order to the chaos. You may never have to write RegEx again! Log Explorer also features the Live Mode which lowers latency from ingest to query so you can see what’s happening exactly when it happens. Investigating a critical incident? Toggle on Live Mode to get in the moment insights and simply toggle it off when you’re done to return to your previously defined data freshness setting. Best of all, because your logs are in the Data Lake and correlated with your other telemetry in the Data Graph you can quickly pivot from Live Mode in the Log Explorer to metrics or traces. Log Explorer is GA now.

Metric Explorer
Metric Explorer brings you right to an expression builder where you can work to visualize your metrics. In Observe there’s no limitation on custom metrics or cardinality so you can look at the metrics you care most about, and you can switch visualization types at the click of a mouse to get the view you need. Fear not, even if you’ve gotten in the weeds with your metric visualization you’re only a click or two away from viewing the raw metric data or related Datasets (whether they’re metrics or logs). Metric Explorer is GA now.

Trace Explorer
Instantly get visualized “RED” metrics like trace rate, error rate and trace duration along with a summary of services’ spans and errors. You can apply filters to quickly focus on what you’re searching for like traces with errors. From the Trace Explorer page you can also drill into a specific trace to see a trace summary page and see detailed span information in a familiar “waterfall” view. Related, logs, events, and resources are a click away. With the Trace Explorer you can quickly go from a high level view of a service to the exact log you needed about an error in a slow span.
Resource Explorer
Resources in Observe are human-understandable things, they could be a user, a location, a server, or a CI job. They’re something you might want to ask a question about and they can be totally custom to your organization. With Resource Explorer you can easily track all of your resources and see any changes to their state over time. Dig into a specific resource and see exactly what changed and when it changed, better yet you can do side-by-side comparisons of two points in time to view the changes to the Resource between those points.
Open Data Access
Because we use open-source data collectors like OpenTelemetry to get your data into Observe, there’s no fear of vendor lock-in. The Data Lake architecture lets us provide unparalleled flexibility when it comes to how you get data in and out of your observability tool. We now support a public API, exporting to CSV, a Command Line Interface (CLI), and joint data sharing for existing Snowflake users. Your data is your data and it doesn’t have to be locked-in!
GPT Enhanced Observability
AI and ML have been a part of monitoring and observability for a while now, but no previous technology has had the potential that LLMs have introduced. We’re believers in AI not being the product in observability, but a tool to make observability better. That’s why we’ve become a leader in using LLMs in observability to boost user productivity anywhere from 20% to 50%.
O11y GPT Help
Digging into documentation isn’t always the fastest way to find an answer to a question especially for new users who may lack prerequisite knowledge. That’s why we have our GPT-enabled helpbot, O11y Help. O11y can help you quickly learn the basics of Observe, find out how to perform necessary operations, and more. O11y Help combines specific knowledge of Observe, having been trained on our documentation, with the general context that OpenAI already has. This means practical results that can help new and veteran users alike get more familiar with Observe.

O11y GPT Extract
What if you never had to write RegEx again? One of the most common uses of regexes in observability is for parsing logs. Log files often contain a wealth of data, but they’re usually in a raw and unstructured format. To extract valuable information, users have to spend considerable time writing RegEx. That’s why we developed O11y Extract which will auto generate RegEx for you so you can give structure to your log data in just a few clicks, eliminating the overhead of having to constantly write your own regex.
OPAL Co-Pilot
Observe Processing and Analysis Language (aka OPAL) is a key component of what makes Observe what it is. When you use the UI in Observe OPAL expressions are being generated behind the scenes, and particularly savvy users even learn to master OPAL and use a console workflow alongside the UI. OPAL Co-Pilot helps bridge the gap between users that prefer to stick to the UI and those who want even more granular control via the console. With OPAL Co-Pilot you can use natural language text to express the action you want to take on a Dataset and you’ll get suggestions with the OPAL command needed to make that happen. Check out a practical example with IP Address filtering here.
O11y GPT Slack Assistant
Slack Assistant brings some of Observe’s features, namely O11y GPT Help, directly into Slack. Incident response is often a team activity and communication is crucial. For that reason we want to bring the data to the people. You can use O11y GPT directly from Slack to get help as you would in Observe, but you can go even further.
After you get an alert, have O11y create a dedicated incident response channel for collaboration. From there O11y can gather relevant data and give you a logical starting place in Observe for your deeper investigation. Send data from the Observe UI back to Slack and the incident channel for other responders to see. When the incident is closed you can even have O11y create a summary and save it for future reference and postmortem use.

Apps – AI, Security and Database Observability
When we unveiled Observe Apps in 2022 we said we would continually add new ones to meet the needs of our customers, and that’s exactly what we’ve done! Apps are a key component of The Observability Cloud, they give you a way to quickly start analyzing your data through pre-built out-of-the-box dashboards, monitors and Datasets. We’ve expanded our range of apps to include AI, security and database observability.
OpenAI App
We haven’t just brought OpenAI into observability, we’ve brought you observability for OpenAI. The odds are good your organization is already using or is currently planning on using LLMs in or alongside your products. Now you can extend your observability to those implementations. Want to keep tabs on GPT token consumption? You can do that with the App. You can also get visibility into questions that were sent to OpenAI and answers that were returned. Check out this post for more details on the OpenAI App and start observing OpenAI today.
Orca Security
We’re following up our Basic Threat Intelligence App with a new App for Orca Security. Orca is a popular compliance and security scanning tool, and we’re excited to announce a public preview of the Observe App for Orca Security. This app uses a Lambda collector to regularly pull Alerts, Assets, and Logs from the Orca Security API into Observe, where resources and events are already modeled for efficient use. Correlate instances and images with infrastructure reports to see what issues exist where, set monitors for correlation between significant findings and important deployments, and review long term historical changes in Observe. Selected Orca events can also be represented as metrics in Observe, making it very easy to monitor and alert on changes in the flows of findings or authentications.
MongoDB Atlas
We’re excited to announce the launch of the MongoDB Atlas App! MongoDB Atlas is a fully managed cloud database service that simplifies the deployment, management, and scaling of MongoDB databases in the cloud. And thanks to Observe’s latest App, monitoring these databases becomes effortless. The new MongoDB app, along with the MySQl and PostgreSQL apps have added database observability to the mix.
Free Trial and More Purchasing Options
The high costs and inaccessibility of many observability tools is a significant pain point for many organizations, and if you multiply that by the number of tools they have it’s a major issue that isn’t going away. That’s why we want to make kickstarting your observability as easy and affordable as possible. To continue this mission we’ve introduced a free trial version of Observe, as well as a new ingest-based pricing option.
14 Day Free Trial
For those that want to get hands on with Observe we now offer a fourteen day free trial. The trial provides full access to the Observe platform, and all the complete feature goodness our customers get. You can bring your own data or use pre-populated OpenTelemetry data. There is a limit on the number of Observe Compute Credits that can be used during the two week duration, but we’ve provided a high ceiling to ensure you can fully experience what Observe can do. To sign up for the free trial now click here, we’ll be launching it mid-October.
Ingest-based Pricing
One of the unique aspects of Observe is our usage-based pricing. That pricing model ensures that your observability costs don’t scale unsustainably as your organization experiences massive data growth year-over-year. Our new ingest-based pricing is not a replacement for our usage-based pricing, but another option for customers just getting started with Observe and looking to ingest relatively small data volumes.
Ingest-based pricing offers a flat fee per GB. For users coming from other tools this will provide a familiar model and make it easy to forecast your likely spend so you can adhere to your budget. As data volume grows, typically after a few terabytes a day, customers will switch to usage-based pricing where they can realize significant cost savings compared to ingest-based pricing models.
AWS Marketplace
Observe is also available through the AWS Marketplace. If you’re already an AWS customer, you can use your AWS credits on Observe. Simplify billing and budgeting by including Observe alongside your AWS services. Looking to get started with Observe, or get more credits? Reach out to your account team for more details.
Ready to get your hands on features like log explorer and O11y GPT? Sign up for access to your free trial here and start Observing.


