

Getting Started with Microsoft Azure Observability

Azure observability often starts with Azure’s built-in monitoring tools, but the best observability strategies rarely end there.
If you deploy workloads in the public cloud today, there's a good chance that you use Microsoft Azure—or that you might use it in the not-so-distant future. According to this recent Stack Overflow survey, in the past year, nearly a third of developers have done extensive work in Azure. As the second most widely used cloud, following Amazon Web Services, it’s also one of the fastest-growing providers, having grown its market share by a rate of over 25 percent since 2019.
If you don't have an Azure observability strategy in place, now's the time to think about creating one. Otherwise, you risk having limited visibility into your Azure environment or data siloed in native Azure monitoring tools—problems that make it hard to identify and troubleshoot Azure performance and reliability problems effectively.

To conquer these challenges, it’s first crucial to understand how Azure works, which built-in monitoring and observability services it offers, and its limitations. From there, you can identify solutions that plug Azure observability gaps and also allow you to correlate your Azure telemetry with the rest of your observability insights to gain deep visibility into your Azure environments.
This resource breaks down everything that DevOps Engineers, SREs, and their organizations need to know about Microsoft Azure Observability to get started with their o11y strategy today. We’ll also explore how you can take your Azure observability strategy to the next level and connect it to other observability data outside of Azure for a broader understanding of your entire IT ecosystem.
The Basics of Azure Observability
To understand Azure observability, you must first understand how Azure works and the services it offers. This is a straightforward task if you're familiar with other public clouds because Azure provides the same core types of cloud services, including.
- Virtual machine instances (Azure Virtual Machines)
- Object storage (Azure Blob Storage)
- Managed databases (such as Azure SQL Database)
- Serverless functions (Azure Functions)
- Container hosting (Azure Kubernetes Service or “AKS”)
Beyond these bread-and-butter cloud computing services, Azure provides a wide variety of complementary tools and solutions, ranging from software development tools, such as Azure Pipelines to big data solutions, Data Lake Analytics, and more.
What Do You Need to Monitor on Azure?
Similar to other cloud providers, Azure provides the foundation to deploy various types of workloads with some degree of automation, but it doesn't automatically monitor them for performance, reliability, or security problems.
This means that you need to take explicit steps to deploy an Azure observability solution that can collect data from the Azure services you use, then analyze it to detect issues that could affect workload health or security. Azure exposes monitoring data for all of their services to assist customers in this task. The exact nature and form of the data vary from service to service. Azure monitoring data also allows users to assess the status and performance of their workloads. Azure also provides basic built-in monitoring solutions, although as we explain below, their functionality is limited.
Ideally, you'll also want to correlate your Azure observability telemetry with other data sources to gain the deepest possible context into what's happening in your Azure environment. But more on that later.
Azure Observability and Monitoring Tools
Besides exposing monitoring data, Azure also provides you with various native tools that you can use to collect and analyze that data. We’ll take a brief look at what’s provided, and then later talk more about the limitations of some of these tools.

Azure Monitor
Azure Monitor is Azure's primary monitoring tool. It's a SaaS product that can collect metrics from virtually every cloud service and resource found in Azure. Azure Monitor also provides basic visualization tools to help interpret monitoring data, making basic cloud infrastructure monitoring relatively straightforward.
Application Insights
Compared to simple and generic cloud monitoring, Application Insights extends Azure Monitor with features designed specifically for real-time application performance monitoring (APM). Similar to OpenTelemetry (OTEL), you can instrument your application to emit traces and then analyze them with application metrics and telemetry data to evaluate applications hosted on Azure.
Log Analytics
Azure provides Log Analytics as a tool for running log queries against log data collected using Azure Monitor. This tool can search for particular types of data or patterns across logs that are collected using Azure Monitor.
Azure Advisor
Azure Advisor provides recommendations to optimize workloads for performance, reliability, security, and cost-efficiency. It's not a monitoring application, per se, because it doesn't monitor individual workloads on an ongoing basis. But it can help you work proactively to rightsize and optimize your workloads to reduce the risk of issues.

The Limitations of Microsoft Azure Observability Tools
Azure's built-in observability tools are useful for basic data collection and monitoring. The fact that they're available as SaaS solutions that require no special deployment or setup effort by users makes them attractive, too. Especially in a world where tool sprawl is getting out of hand.
That said, there are important potential downsides to relying on native tools alone for Azure observability.
No Multi-Cloud Support
Unsurprisingly, Azure’s monitoring tools are built only to monitor workloads hosted on Azure. In certain cases, they can also support workloads in a hybrid cloud built with Azure Arc or Azure Stack, but they are not designed to work with other public clouds.
This means that if your services or apps are built using a multicloud environment—for example, you use Azure Virtual Machines to host your windows applications, but analyze their logs using Google Cloud Platform’s data analytics services—Azure's monitoring solutions won't address all of your observability needs. You'll have to use additional tools to monitor your other cloud environments. Worse, with Azure-native tools (or any cloud-based tools) you can’t correlate and compare that data to observability data found in other cloud environments. Now that multi-cloud is here to stay, that seems like an unnecessary limitation.
Diverse Metrics
Azure monitoring solutions like Azure Monitor provide a centralized place for collecting and visualizing data. However, they don't address the challenge that different Azure services expose metrics and log data in different ways. The types of monitoring data generated by each service can vary, and sometimes even the intervals at which data is ingested into monitoring tools are different.
As a result, Azure's built-in monitoring tools leave you with siloed monitoring data and make it difficult to correlate different types of information. For example, if you want to understand how an application performance issue, which runs on a VM, relates to increased wait times in a database, you may have trouble finding this information.
Lack of Customization
Azure's monitoring tools provide some features for customization, but they are limited. For example, you can configure custom visualizations in Azure Monitor based on prebuilt options. However, you’ll have a pretty frustrating user experience if you want to generate a fully customized data view that’s not supported by the pre-existing configurations.
There are also other issues with Azure monitoring tools, such as the inability to provide state & threshold monitoring, severely limited alerting conditions, and a lack of diverse notification channels. At best, Azure Monitor and similar tools provided by Azure leave big gaps in your observability planning and necessitate the adoption of yet another tool.
Cost
Although Azure's monitoring solutions are simple to deploy, most come with a cost. For example, Azure Monitor charges fees based on how much data you ingest into it and how long you retain that data. With current trends in observability data growth that are concerning, the last thing you want is a pricing model based on data ingest.
Likewise, Azure Advisor is subject to special case-by-case pricing, with details available only by talking to an Azure sales representative. Yet, another hurdle to observability and cost transparency.
Taking Azure Observability to the Next Level
Microsoft Azure native monitoring products are useful as the basis for building a simple Azure monitoring and observability strategy. However, on their own, they’re not enough when it comes to building a robust observability solution. Getting the most out of your Azure observability strategy requires finding ways to extend and enhance Azure observability tooling.
Whether your goal is purely observing your Azure environment, multi-cloud observability, or observability across your entire IT infrastructure, you should consider the following features and functionality when looking for an observability product.
Easily Ingest Data of All Types
In an ideal world, your observability tooling should make it easy to ingest all of your observability data—regardless of format—into a single data store. The last thing you and your team needs is another data silo, and to spend countless hours massaging data before it’s useful.
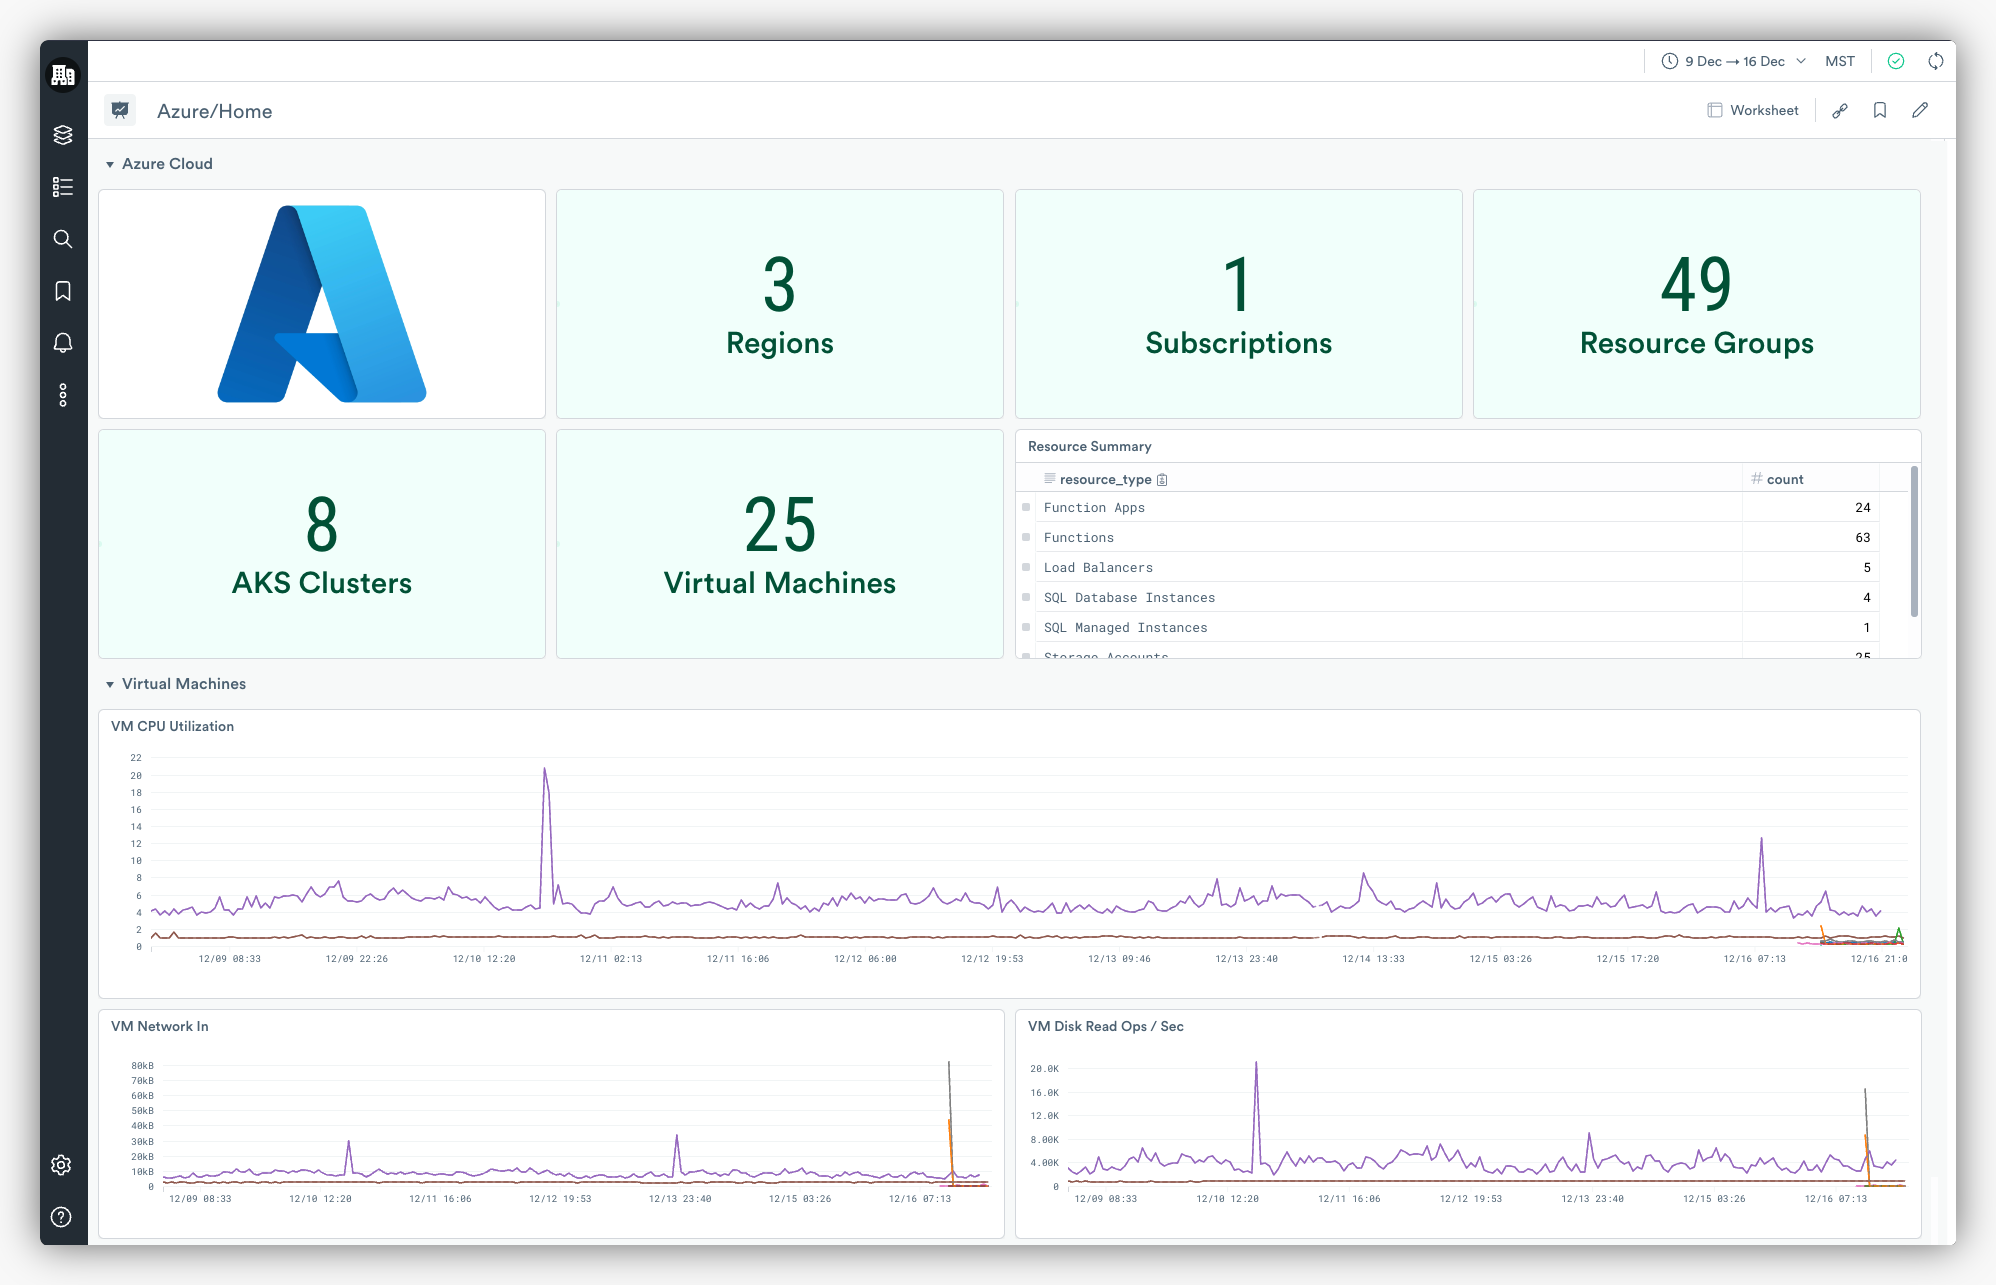
With the Azure App from Observe, getting your observability data from Azure couldn’t be easier. In a few clicks, your Azure telemetry begins to flow into Observe’s Data Lake where it’s easy to navigate and find relevant context during investigations. But, the Azure App is just the tip of the iceberg. At the moment, Observe supports over sixty popular services and applications thanks to an ever-growing host of Apps and integrations.
And because the Observe Data Lake was built on Snowflake, you have all the flexibility you need when ingesting various types of data. No need for tagging, indexing, parsing, or architecting complex forwarding and ingestion pipelines. Simply install an App to get your data flowing into Observe, and we’ll make sense of it—no matter the format.
Cost-Effective Storage
Between the relatively high data ingestion volumes and storage costs of native Azure monitoring tools, you may end up overpaying if you rely only on them. Or worse, you might feel pressured to dial down your collection efforts—losing crucial context in the process—to cut costs.
Thanks to Observe's usage-based pricing, you don’t have to make hard decisions about your data. Once your telemetry is ingested into the Data Lake, Observe then compresses that data 10x and stores it in Amazon S3 for 13 months—resulting in inexpensive long-term storage.
This means that if your business and data complexity grows exponentially, your costs don’t—a 50% increase in observability data shouldn’t mean a 50% price hike. Nor should you have to pick and choose which data to keep, because you never know where the issue may occur after all.
With Observe, you can ingest all of your telemetry, store it for as long as you like, and pay near S3 prices to store it.
Meaningful Data Correlation
An Azure observability strategy should make it easy not just to collect data from various Azure services, but also to compare and correlate distinct types of data. Furthermore, you should be able to link disparate data sets together to identify relationships between workloads and resources that you might otherwise overlook.

Observes’ built-in Data Graph was built just to do this. To help you make meaningful connections, Observe first accelerates data out of the Data Lake into the Data Graph to make it easier to navigate. From there, Observe turns that data into Datasets—or “things” that you care about such as users, pods, or even customer tickets. From there, you can link Datasets together to ask questions such as, “How were my customers affected by the latest push to production?” or “Do we need to increase our node count after deploying the latest feature?”
And with thirty-eight distinct Datasets provided by the Observe Azure App, you can observe the overall state of your Azure Environment effectively—no matter which services you use.
True Multi-Cloud Support
No matter how robust a cloud provider’s observability and monitoring tools are, you’re still far from true observability and relegated to yet another silo if you rely on them solely.
With the latest Azure App from Observe, Observe now officially supports all three major cloud providers—AWS, GCP, and Azure. This means that no matter which cloud you use, powerful insights are at your fingertips.
These Apps come preloaded out-of-the-box with Datasets, Dashboards, and Monitor templates to make everything from ingesting data to analyzing data, and correlation of data as painless as possible. Combined with the power of the Data Graph, Observe Apps ensure you can relate data from across multiple cloud providers as easily as data found within a single cloud using cloud-native tooling.
Answer questions like, “How is the performance of my Kubernetes pods in AKS related to the number of customer tickets we see in Zendesk?” or link your CI/CD build logs to Google Cloud Functions to get enhanced visibility into failed deployments to your serverless infrastructure.
Smart Dashboards
Sometimes, Azure's default query types, dashboards, and visualizations aren't enough to deliver the level of observability you need. You must be able to create custom data views tailored to your unique requirements.
The Azure App lets you do that. Although the App provides pre-built Dashboards and templates designed to support a wide array of use cases, it’s also fully customizable. Select from any combination of the 768 metrics types, dozens of visualizations, and custom fields that Azure App supports to interact with your data in whichever way makes the most sense for you.
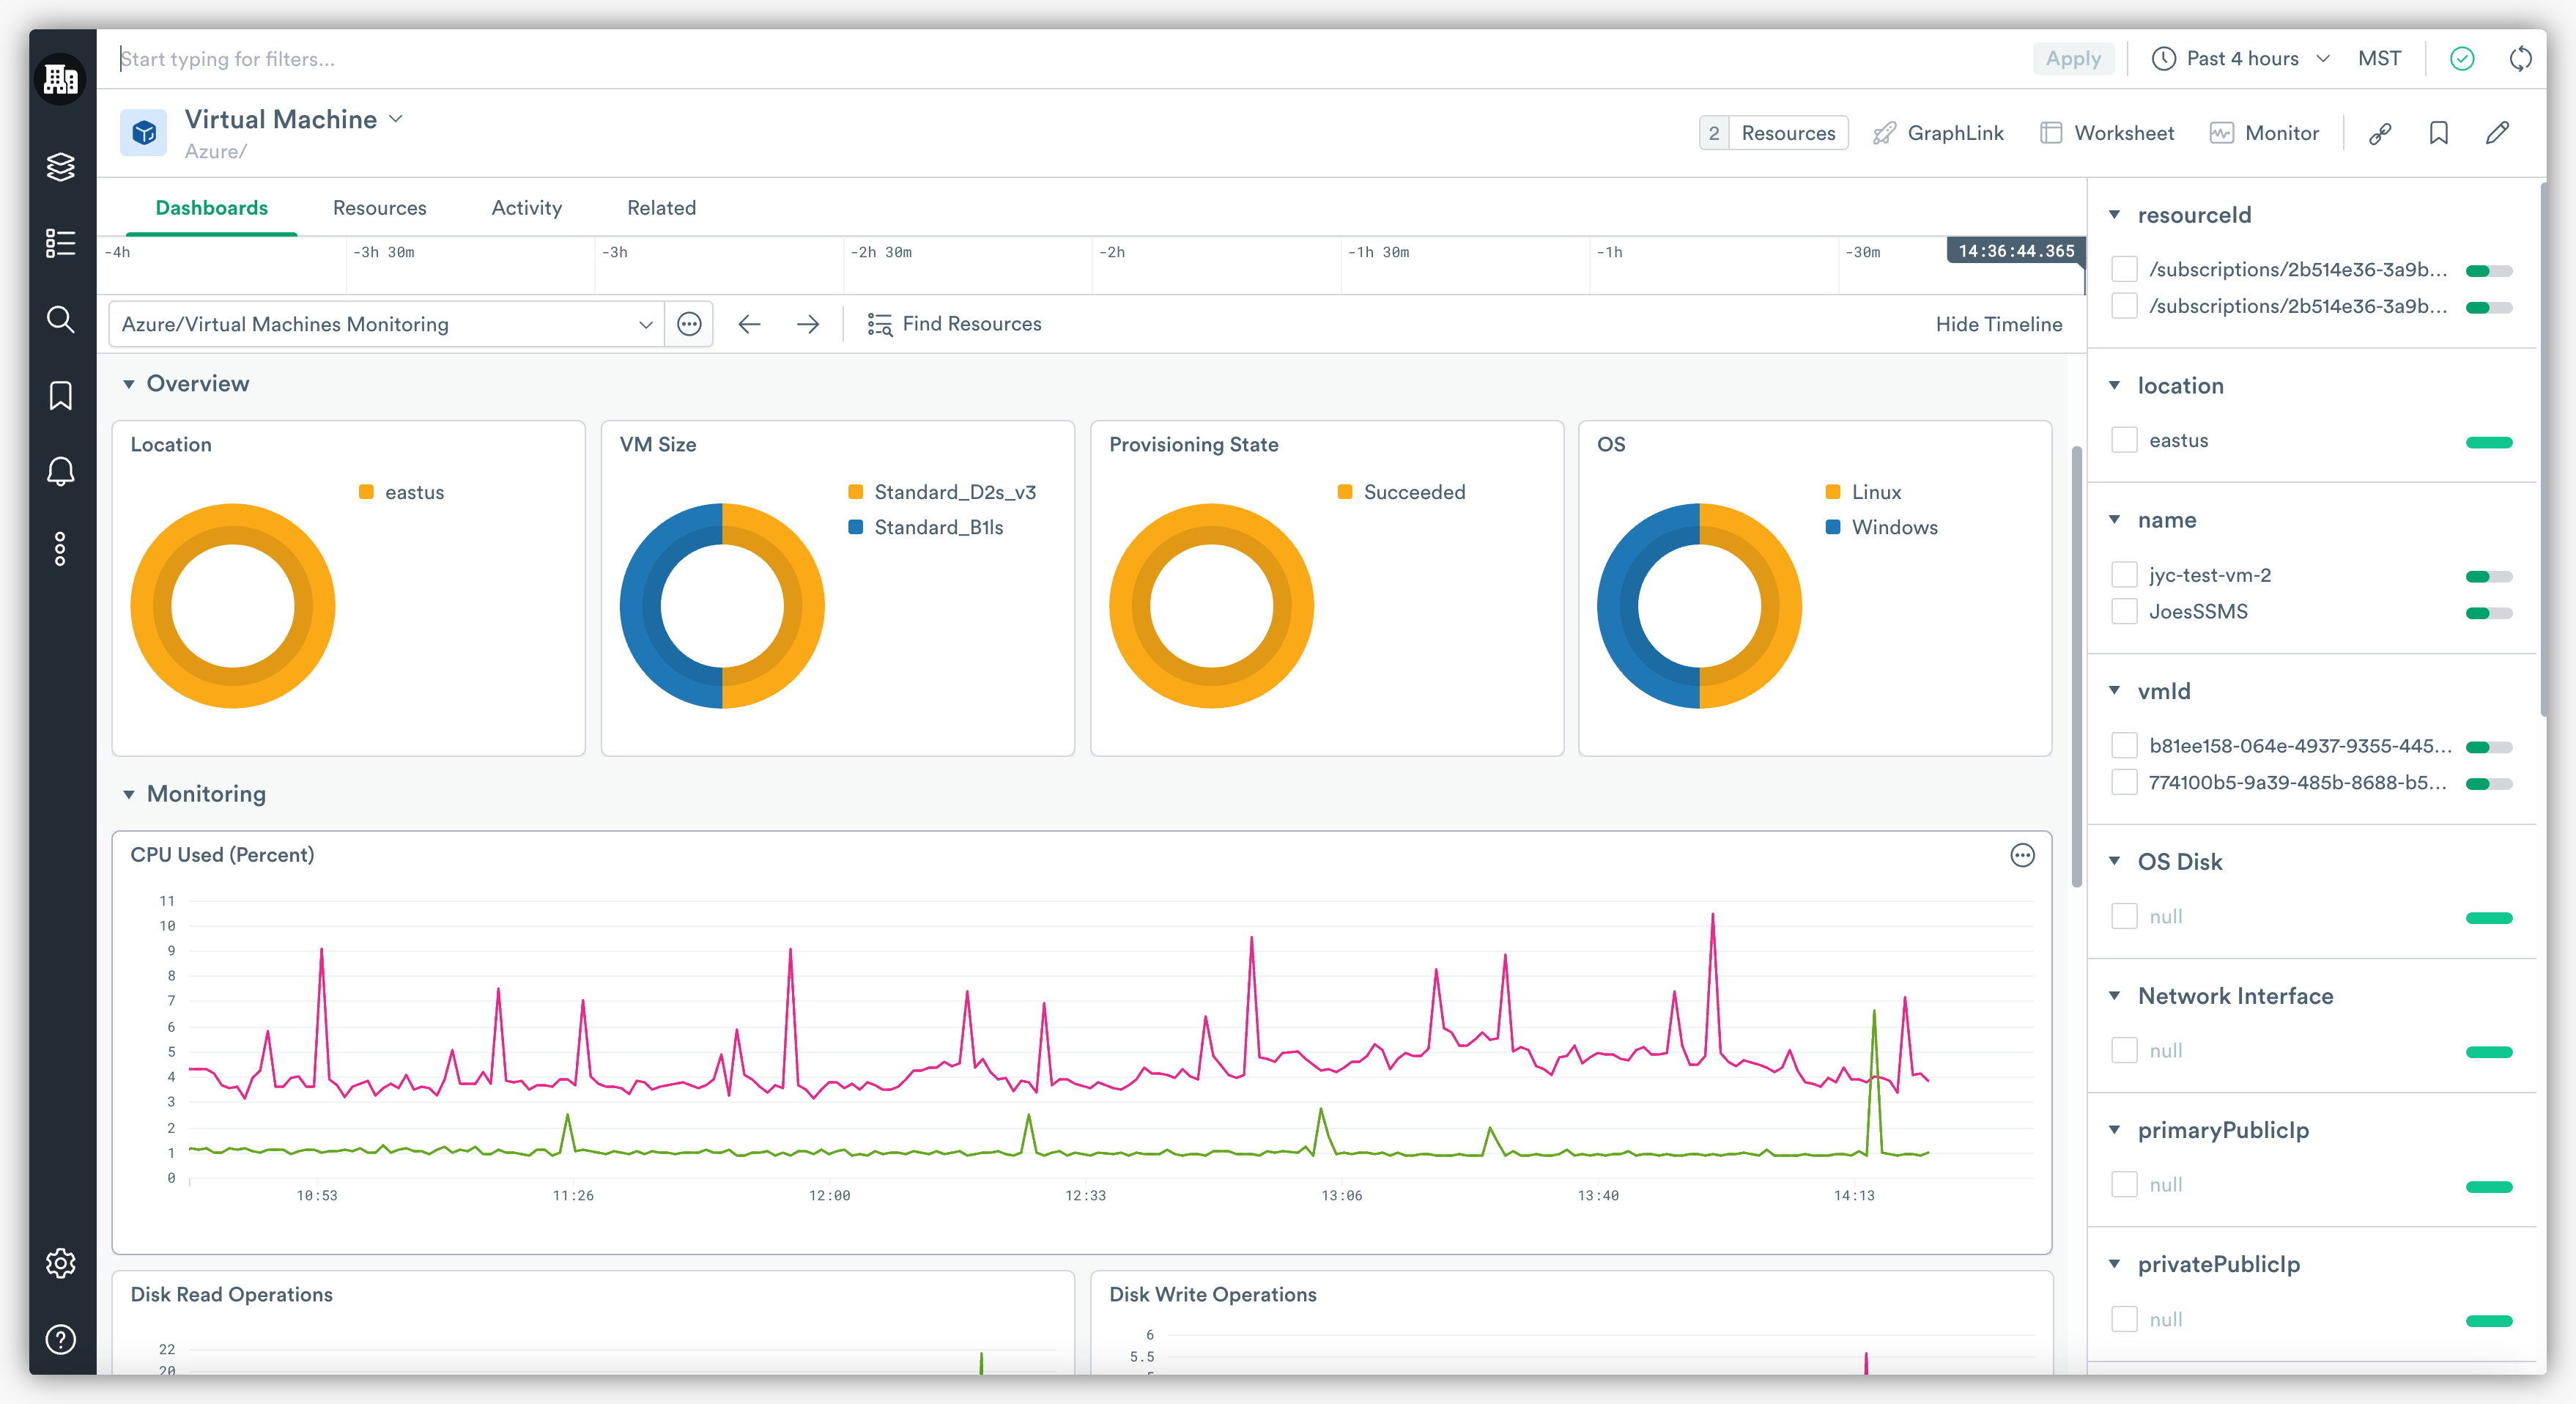
As nice as customizable Dashboards are, they’re not the end-all-be-all. Observe also auto-generates Dashboards. Observes’s dashboards are “smart”, meaning that they go beyond pretty visuals and graphics. Behind these metrics, logs, and traces are resources, and Observe lets you dig further into them from any Dashboard to gain crucial context that other dashboards are missing and get to the root cause quickly.
Turbocharge Your Microsoft Azure Observability
Azure observability often starts with Azure's built-in SaaS monitoring tools, but the best observability strategies rarely end there.
To amplify the effectiveness, flexibility, and cost-efficiency of your Azure observability operations, consider tools like the Observe Azure App. By delivering true multi-cloud observability and the deepest level of context-aware data analytics and correlations, the Azure App helps you simplify observability for your Azure—and other—cloud environments.
