Without Context, You Can’t Have Observability
 By Jeremy Burton,April 1, 2021
In a split second, your brain joins the dots between the feathers from the cushions and the feathers in your dog’s mouth.
What is Context?
Context is critical to analyze any situation we find ourselves in. If you come back home to find your favorite ornament smashed and cushions on the sofa ripped…and you then see your dog with feathers in its mouth, you probably have enough context to determine the cause of the incident before your eyes. In a split second, your brain joins the dots between the feathers from the cushions and the feathers in your dog’s mouth. But what if your dog had no feathers in its mouth? Or it was asleep in its crate? You would then go looking for more context to assess the situation – may be a forced entry through a door or a broken window…anything which would help you establish the root cause.
From Dogs To Distributed Applications
The example above is a bit of fun but the principles are identical when troubleshooting modern distributed systems. The only difference is that you get a brand new dog – or puppy – to troubleshoot every day. Most modern software development teams release new code into production every day, and this often means multiple teams updating their specific microservices in parallel. Because of this, it is quite possible to see brand new – unknown – issues every day of the week. This is very different from the world we’ve come from where huge changes were released a couple of times a year and underwent long acceptance testing cycles to surface issues before pushing into production.
Today, when investigating an incident, the contextual data is fragmented. The investigation may start with an alert on a metric – perhaps a high restart rate on a pod, or a high error rate on the website. That tells you what is happening, but not why and, most importantly, how to fix it. To find out “why?” SREs go looking for additional context – perhaps in other metrics…or diving down into relevant logs.

Mmmm… breadcrumbs
But what does it mean to go ‘diving down into relevant logs?’ Today that simply means searching all logs for a breadcrumb of data that the SRE has eyeballed, like the Pod ID or Error Code. It’s certainly possible to get lucky and find the exact log line that pinpoints the root cause but, more likely, the search returns hundreds or thousands of hits…and then the real work begins!
SREs use their intuition and experience to sift through logs and try to ascertain what happened. But eyeballing logs alone may not be conclusive and so, if available, the SRE may then need to dive into distributed tracing events and understand the performance characteristics of the application. Here again, intuition and experience play a central role as relevant trace events are not logically linked to either logs or metrics. And the investigation continues…
So Let’s Just Scrap CI/CD?
A logical conclusion to all of this could be “this is too hard, maybe we should just release less often”. After all, it’s the rate of change of code going into production that is causing problems in the first place -right? Well, not exactly.
Ahh… that’s so much easier to understand
Micro-service architectures are incredibly productive from a developer standpoint but, as time passes, the application gets increasingly complex. This is the root of all evil as there are now many (many) services that depend on, and interact with, each other. The surface area for possible errors is just too large for testing…so the best bet is to actually (and counter-intuitively) release more often so that issues can quickly be narrowed down to the smallest possible incremental change.
The punchline is that if you’re going to go down the CI/CD and microservices path (and most are) because of the ability to deliver more features, more often for your customers – then good observability is an essential complement to that strategy. Let’s face it, If you can’t trace back an incident to a change then what are you even looking for?
The $64,000,000 Question(s)
So, we’ve established that in modern application development, Observability is essential. The next logical question is, “What are the critical capabilities of an Observability product?”
I’d suggest the following:
1. Enable the investigation of ‘unknown’ incidents in production.
With new code going into production every day, you’re going to see things you’ve never seen before in production every day.
2. Retain, and provide more, context as you investigate.
Enable immediate navigation to related telemetry data without complex tagging schemes or firing up multiple tools.
3. Ability to investigate issues without expert knowledge.
To get repeatable outcomes in investigations expert knowledge must be democratized and embedded in everyday tooling.
Observe: Structuring & Relating Event Data
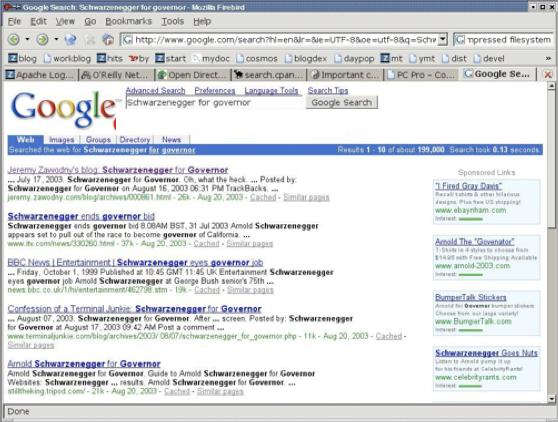
Google, as it was 10 years ago
Observe ingests all your event data and in doing so provides maximum flexibility to investigate ‘unknown’ application and infrastructure incidents. But this mass of event data cannot overwhelm the user – it must be logical to navigate. Observe takes a unique approach to first structure and then relate event data so users can quickly navigate it and retain context as they do so.
If this sounds complicated then consider this analogy. A decade (or more) ago, Google search results were returned to users as just a list of web hits. The user would browse down the list and continue to refine their search until they found the thing they were looking for. If they want to go look for related information to something they found, then they would start over with a new search and the context for the initial search would be lost.
If you look at Google search today, it has changed. Re-running the search shown above for “Schwarzenegger for governor” presents this set of results.
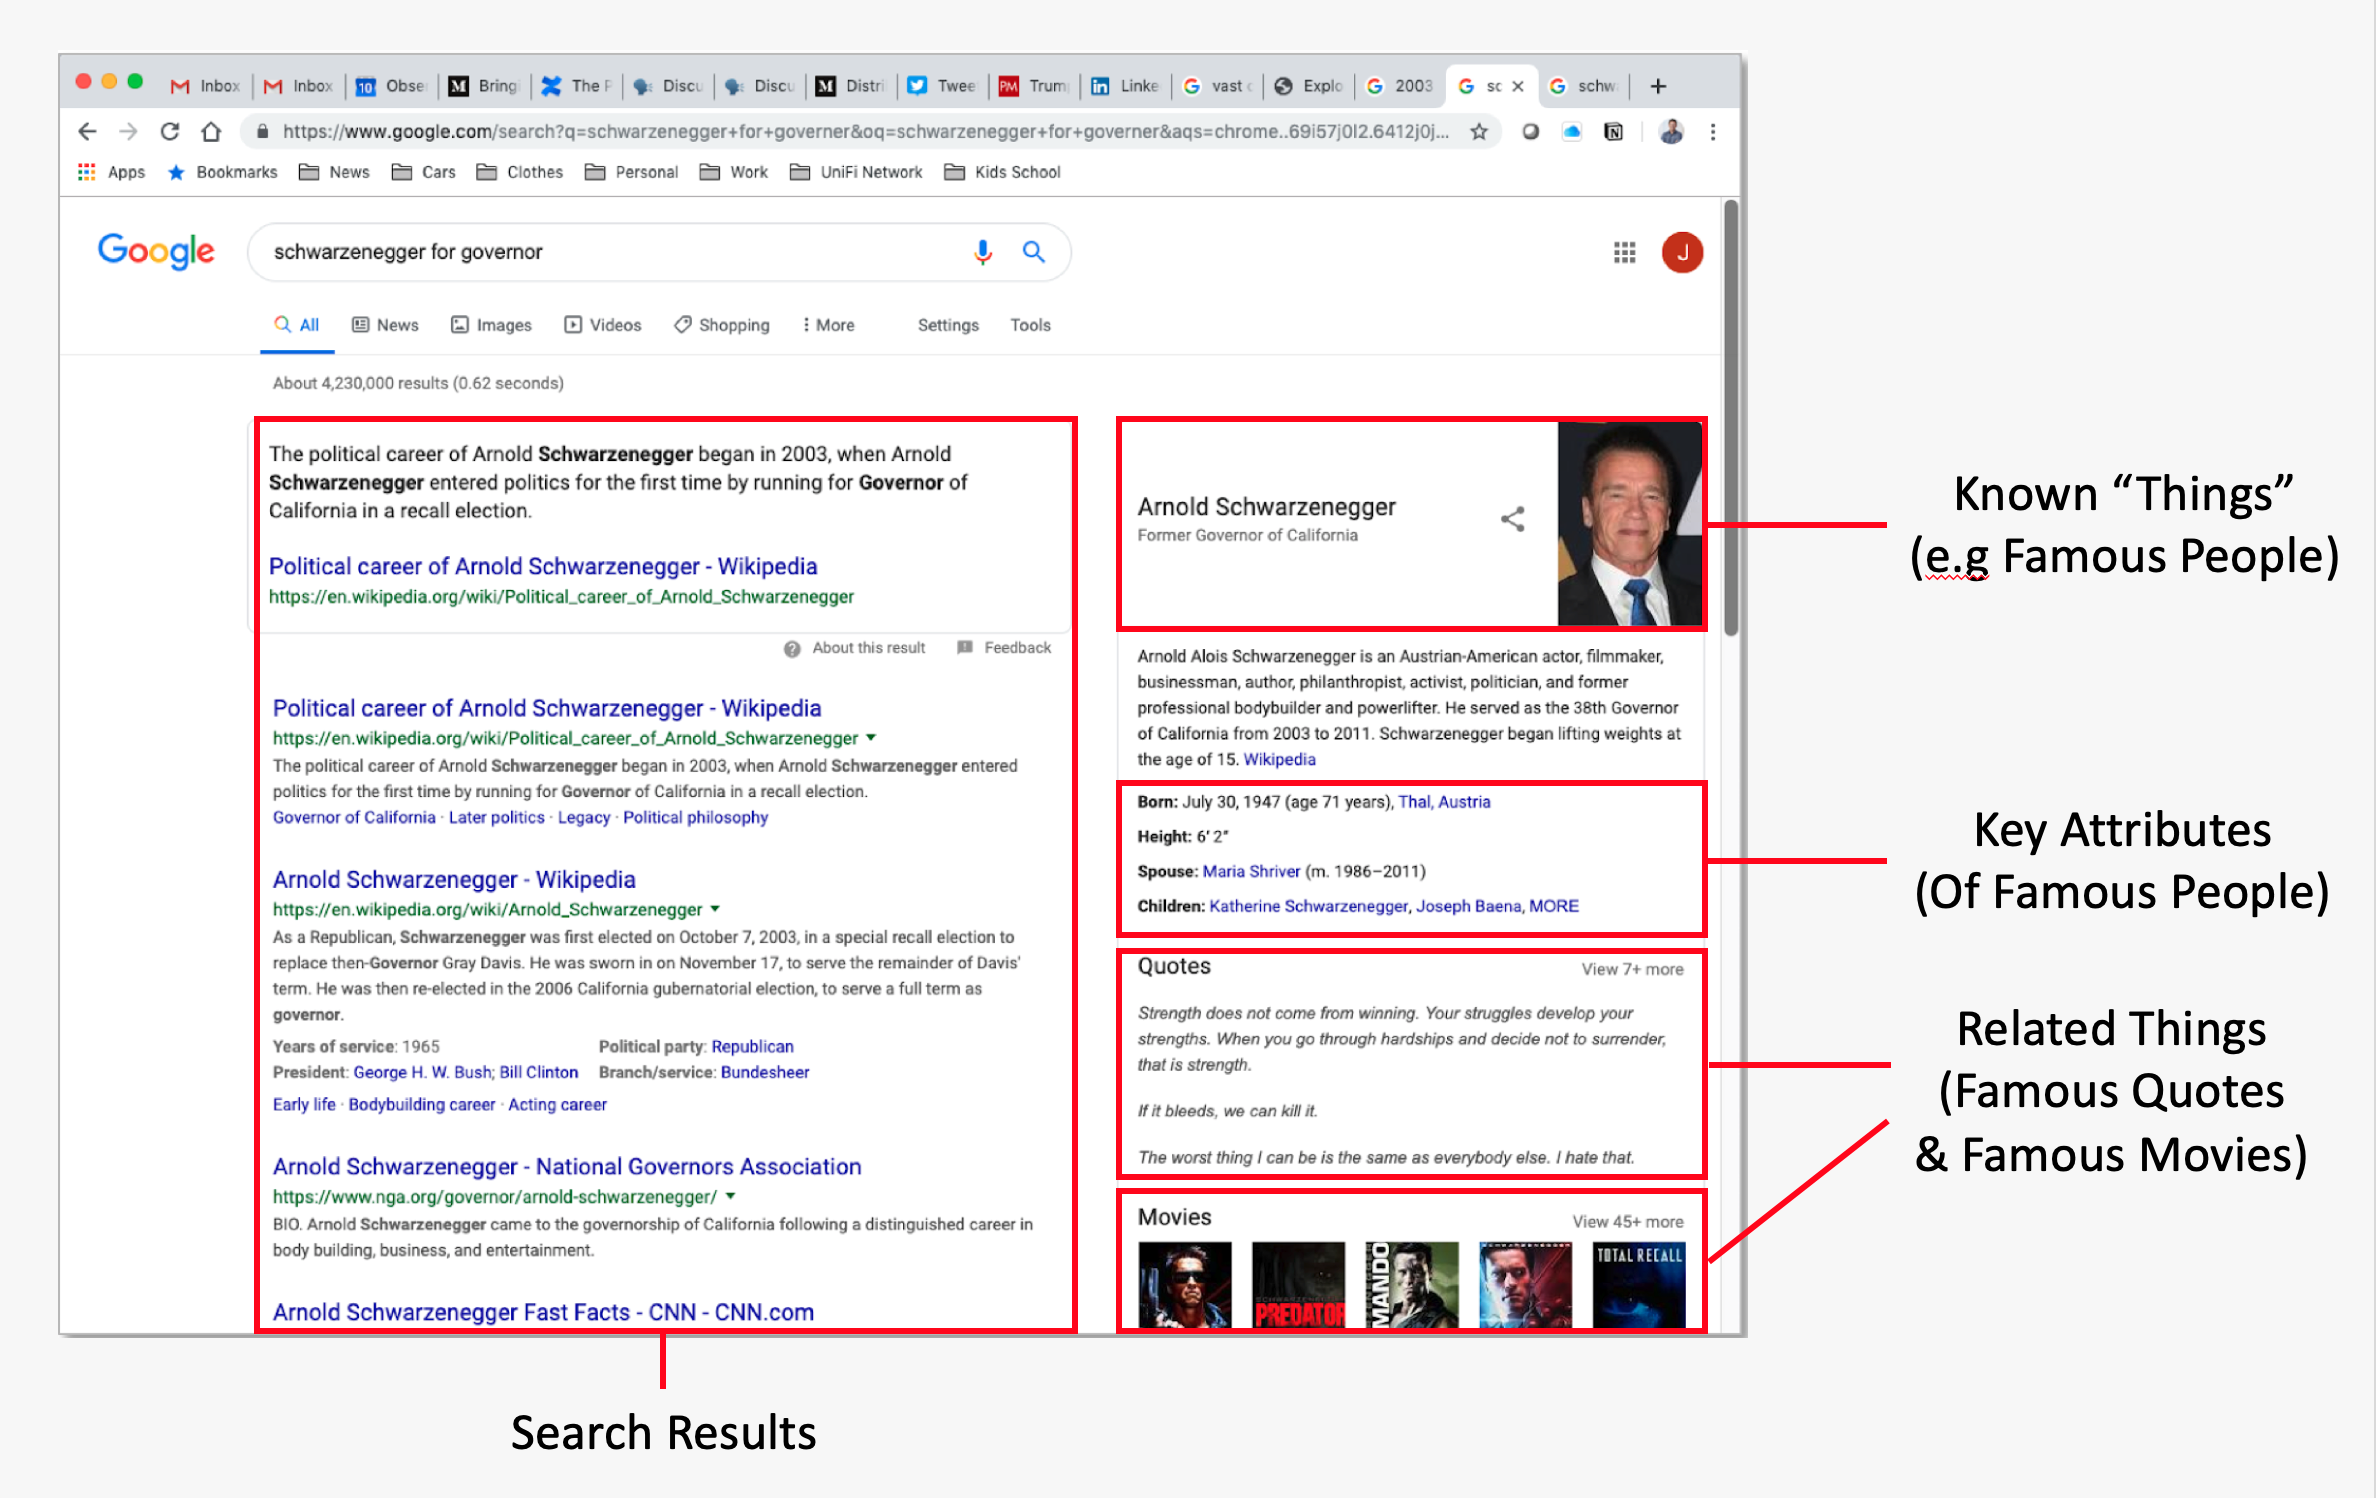
We still see the same list of search hits … but we also see some structured search results on the right-hand side of the page. There, we are presented immediately with a list of structured, relevant, “things” about Arnold Schwarzenegger – like birthdate and height. And we also get related information such as Arnold’s famous quotes and famous movies. Nine or ten searches have now become one search – users find what they’re looking for much more quickly.
How can we apply everything Google has learned about structuring and relating unstructured search results to the world of Observability? Instead of presenting users with a search box and having them iteratively perform breadcrumb searches can we take a different approach? Can we present the user, immediately, with relevant contextual information and retain that context as they dive deeper?
Observe A World Of Resources
After ingestion, Observe curates event data (metrics, logs, traces, etc) into things users find familiar and would like to ask questions about – called ‘resources’. Our users don’t analyze famous people, movies, or quotes…they analyze much more interesting things such as users, sessions, shopping carts, pods, containers and lambda’s, etc.
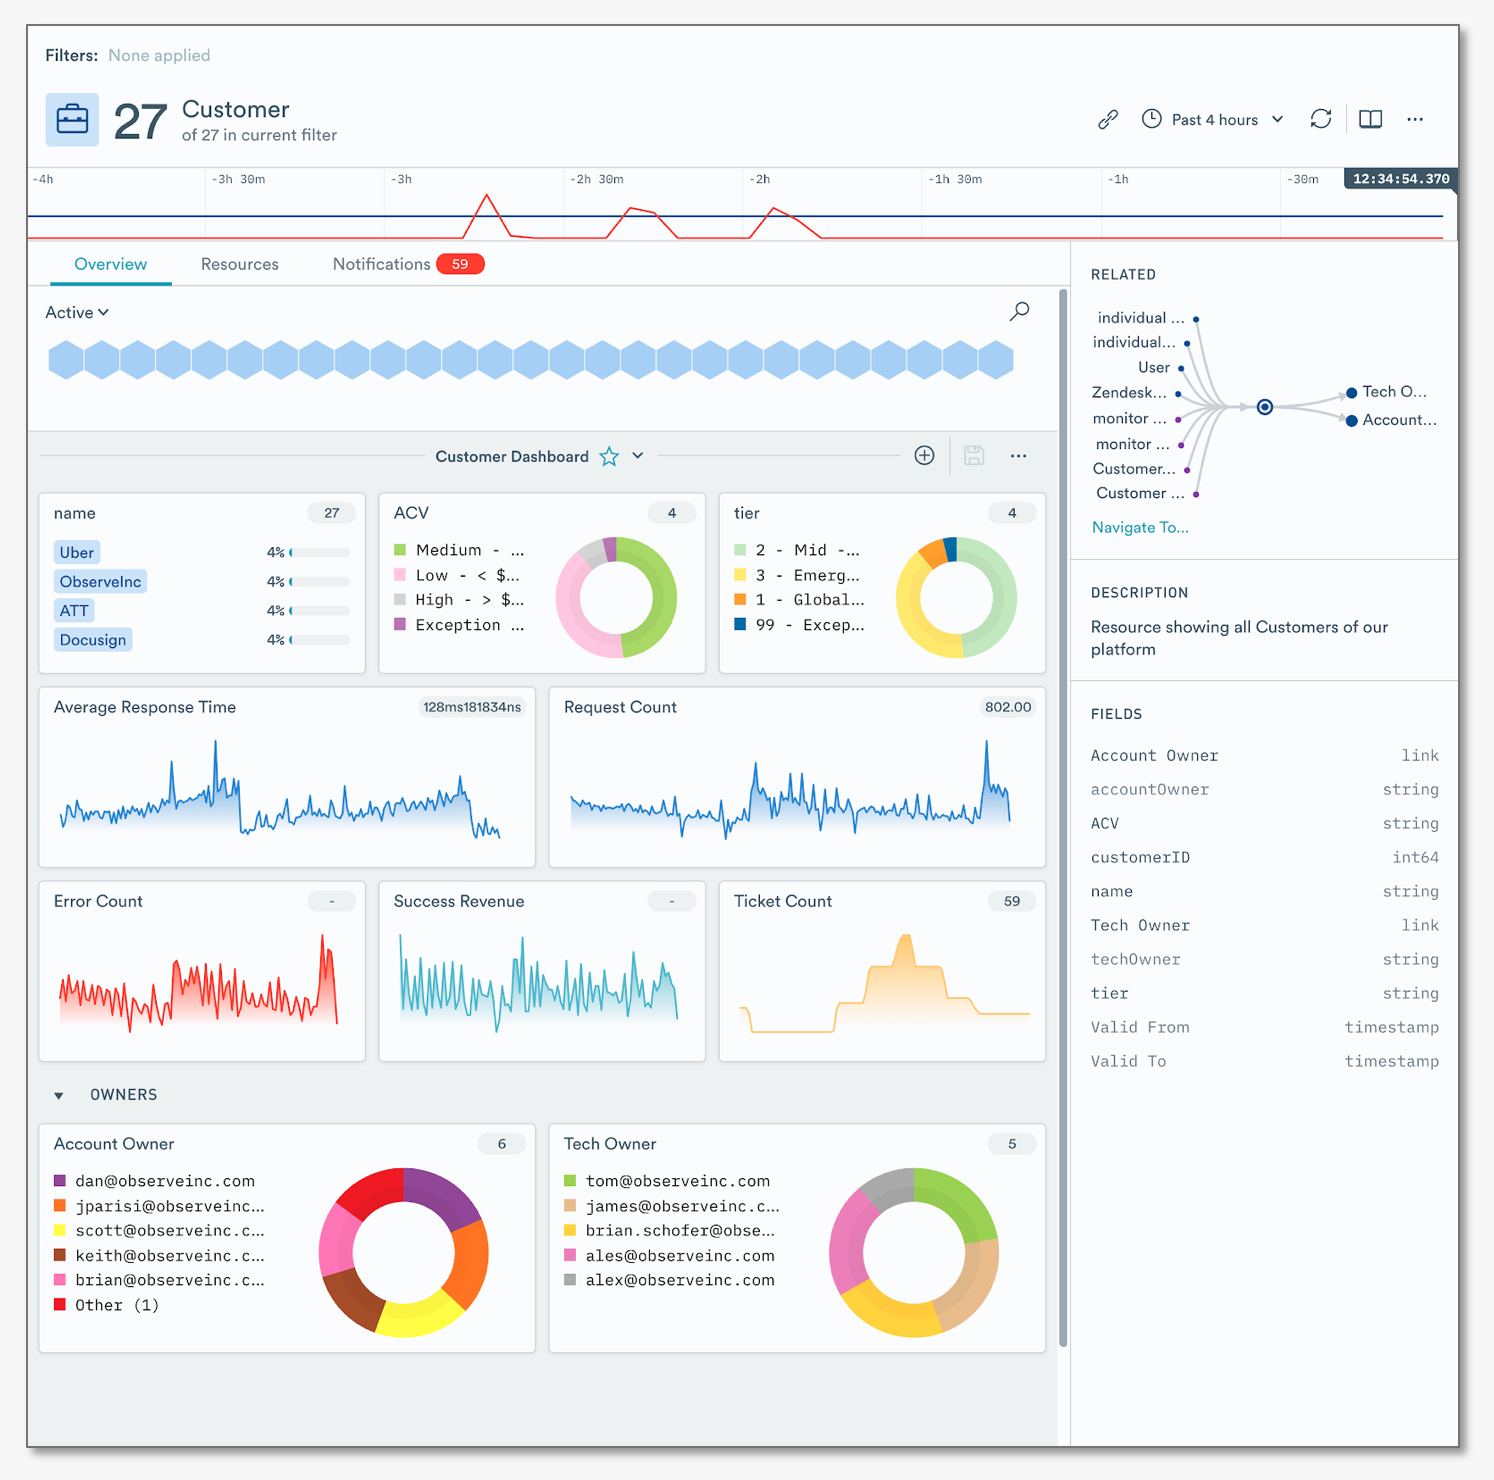
Observe Resource Landing Page
Many resources are created “out-of-the-box” – the user simply points their event stream(s) at Observe’s endpoint and everything lights up in a matter of minutes.
There’s no longer a need for users to dive into the event dumpster and go searching for breadcrumbs. Observe creates an understandable abstraction on top of the event data opening up a whole new world of possibilities.
First, all resources have attributes – for a Customer, this could include basic things like ‘Name’ but also perhaps the number of support tickets they’ve raised or the count of errors they’ve received on the website. Modern systems are incredibly dynamic so the state of these attributes changes all the time. Observe discerns those changes from the event data it processes and the net result is that every resource – and how its state has changed over time – can be viewed through a visual landing page that is procedurally generated from the underlying data i.e. you get it “for free” – there’s no need to spend hours creating it!
Provide Context Through Relationships
We’ve established that the abstraction of ‘resources’ on top of event data is a useful thing. SREs can now start troubleshooting top-down with things they recognize instead of diving into the dumpster of event data and searching. But arguably any tool which allows you to create a dashboard can – on the surface at least – do something like that.
With issues that have never been seen before it’s hard to know exactly which direction the investigation will take
The challenge for users really begins when the dashboard shows that something is wrong. Can they filter the data on the dashboard to triage the issue? Drill into the event data from the dashboard and retain context as they do so? Drill from the application down to the infrastructure and back up again? And, maybe most importantly, can they truly begin to ask ad-hoc questions in the areas where they see the issue? After all, with issues that have never been seen before it’s hard to know exactly which direction the investigation will take.
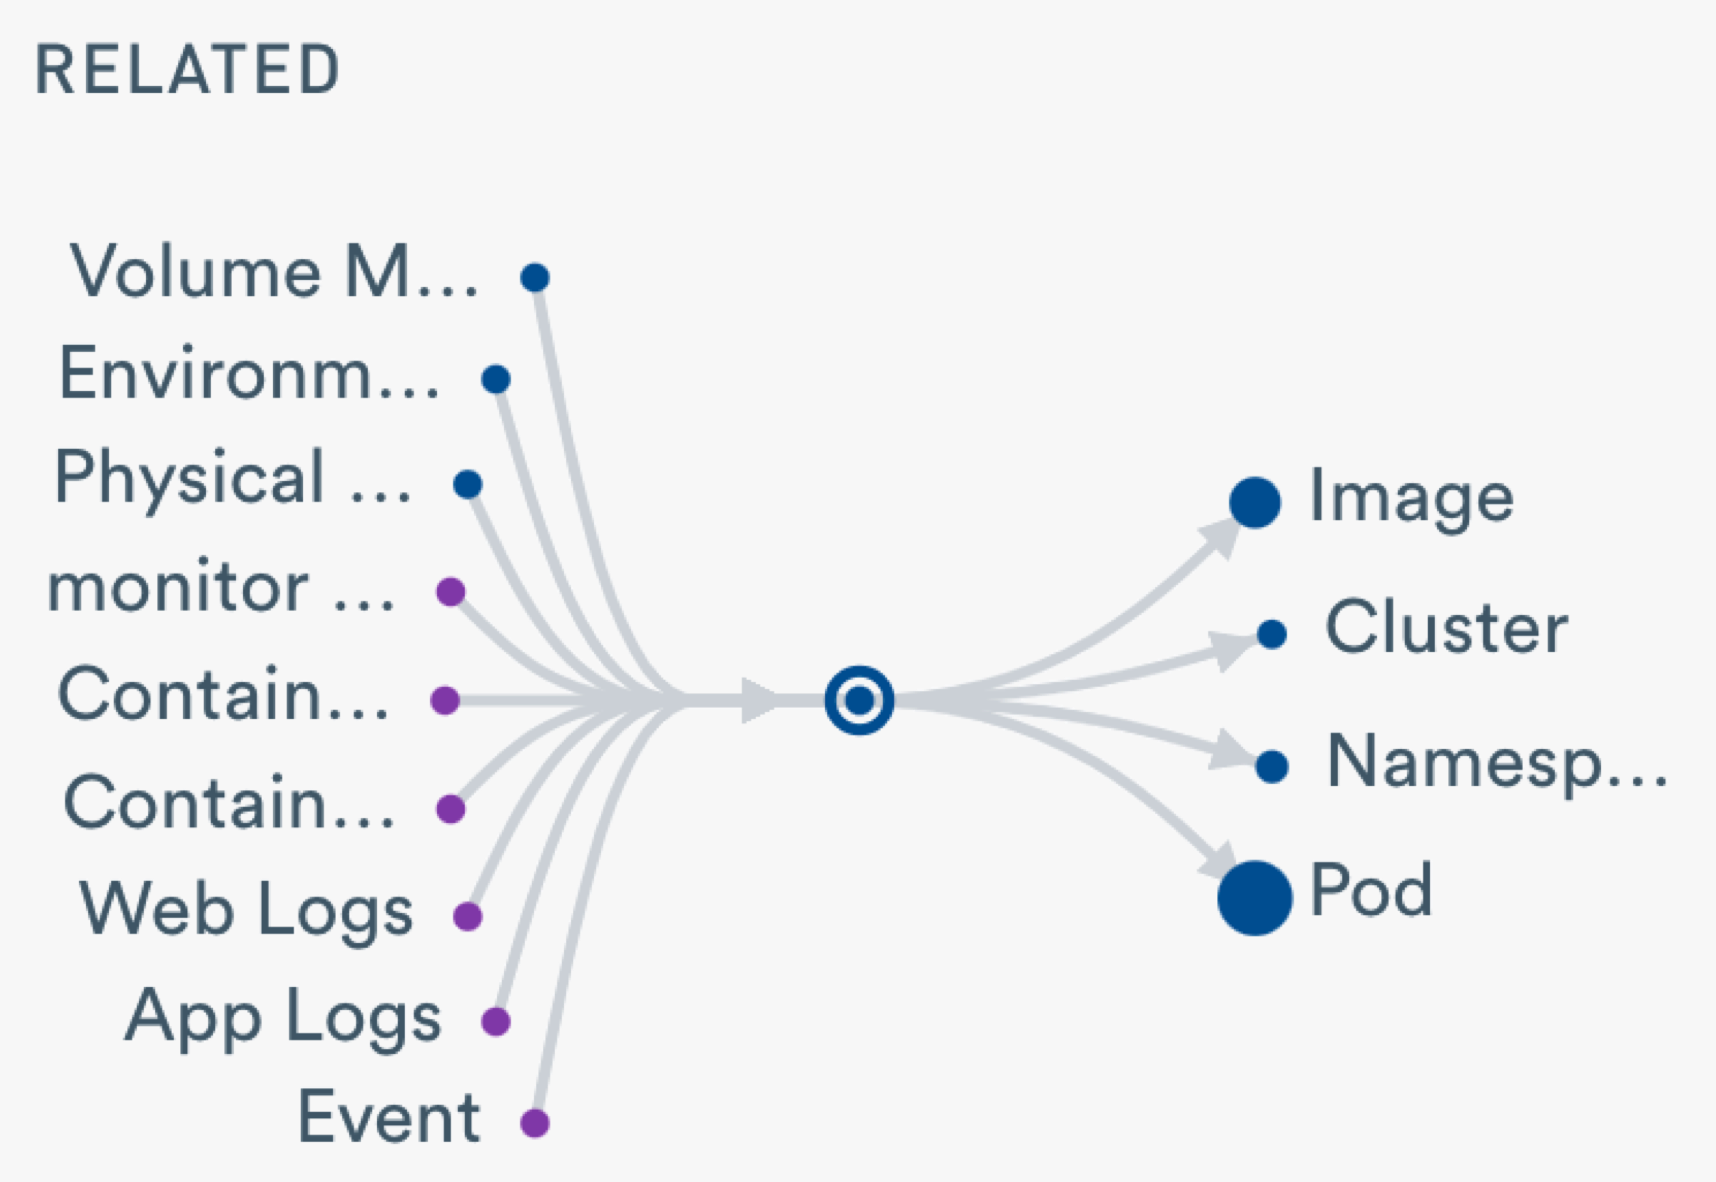
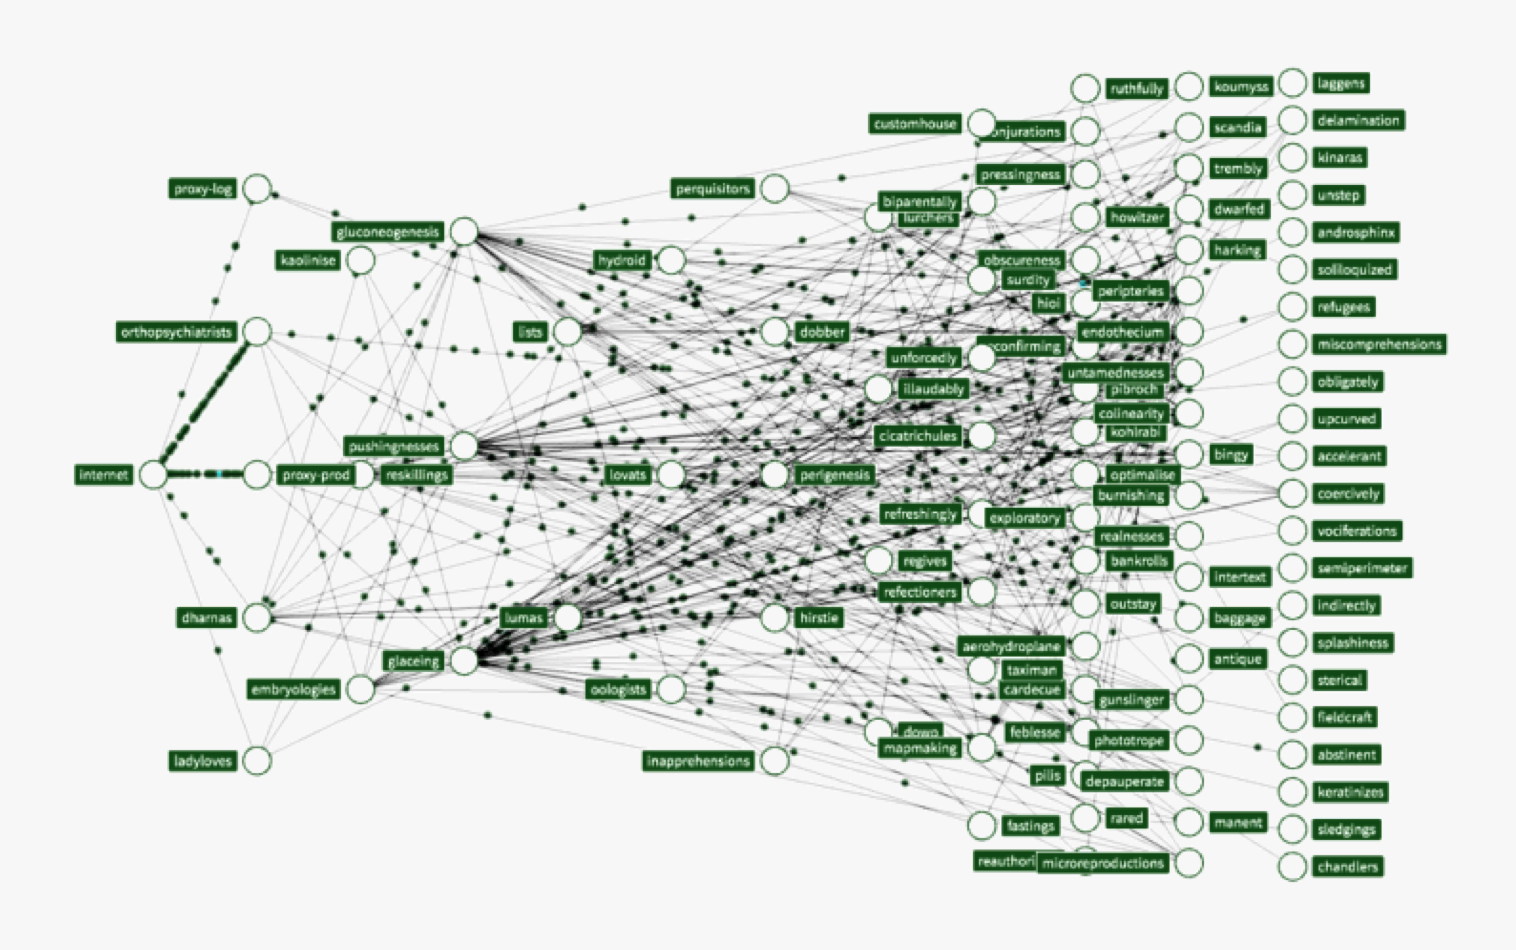
Understand data relationships with Observe Universe Maps
With Observe, dashboards are simply a visual depiction of an underlying ‘resource’. So far we’ve talked about resources as discrete entities but in reality, resources are often connected to one or more other resources. In fact, under the covers, Observe maintains an entire graph of interconnected resources – a feature we call GraphLink. The graph is dynamic and can be extended at any time.
This enables some pretty amazing capabilities. For example, if I’m looking at Customers then it’s easy to navigate immediately to the open Zendesk tickets for my top customers. And from there, immediately navigate to logs for user sessions within those customers. All the time, context is maintained…and it doesn’t stop at the application – it carries on down into the containers which generated those logs, which images were running in those containers…and perhaps even which Jenkins builds resulted in those images being created. And maybe the best bit – the user does not need to remember how to navigate the graph, no knowledge of the relationships is required. The user just needs to ask Observe to take them where they want to go.
With Observability, There’s No Free Lunch
The good news is that for many infrastructure use cases e.g. Kubernetes, AWS, Jenkins, etc. the user need not need to create any resources. Event data that infrastructure emits is usually well defined and its’ structure known in advance. Over time, for most infrastructure use cases, users can simply point their event data at Observe and the graph of related resources will be automatically populated with their data. Observe manages these resources as part of the product and provides regular updates as new versions of the various infrastructure components are released.
Our goal was to make it as easy to create a resource as it is for users in most tools to create a dashboard.
This leaves users to spend most of their time ensuring that their applications are as observable as their infrastructure. Now, Observe can’t possibly know the structure of a users’ application log events, trace events, or custom metrics in advance, so it provides the ability for the user to define that structure and create their own resources. Our goal was to make it as easy for a user to create a resource as it is for them to create a dashboard item.
As an example, consider Observe ingesting Zendesk tickets as JSON blobs via a webhook. In their most raw form, they look like this inside Observe.
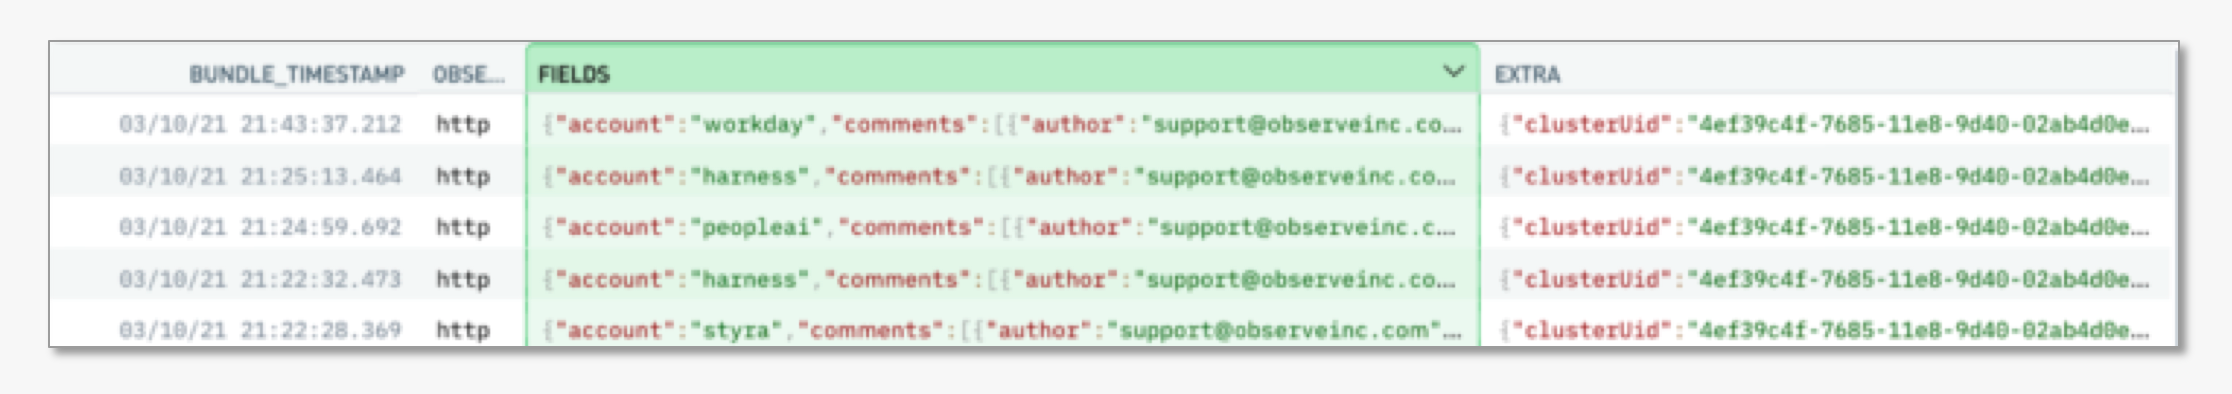
As you can see, it’s still pretty raw and difficult to parse. The good news is that because Observe has implemented Schema On-Demand, the user can quickly parse the JSON fields and make sense of the data – picking out the columns the regular day-to-day users of Observe would like to see. This takes a matter of minutes – our goal was to make it as easy to create a resource as it is for users in most tools to create a dashboard.
Once the structure of the new resource has been defined, the final step is to determine how it links into the graph of resources Observe is already maintaining behind the scenes. This is done using simple primary / foreign key relationships – in the Zendesk example, this could simply be the ticketCreator field… essentially an email ID. So now the Zendesk tickets are linked, it’s easy for users to go from their customer accounts to the users with those accounts to the Zendesk tickets created by those users.
Manage Resources Like Code
It is expected that, over time, the structure of resources will change. There will be new attributes that users will add to enrich the data and links will be created to newly defined resources to bring more context to the user more quickly. In order to enforce discipline around the updates, Observe provides for resources to be defined in Terraform and version controlled in Git – this is exactly the way Observe’s own engineering team maintains the out-of-the-box Kubernetes and AWS resources.
Once these resources and relationships are defined, everyone – even the most junior members of the team – benefit from that knowledge.
With Observe we envisage that the senior SRE talent who understands how the application and infrastructure hang together will spend time laying out the important resources that team members want to ask questions about…and how they are related. Once these resources and relationships are defined, everyone – even the most junior members of the team – benefit from that knowledge. Knowledge is no longer locked inside the brain of the smartest person in the room. This enables the organization to scale – everyone on the SRE team can carry more water when there is a fire burning… and because additional context can be brought to bear on the problem immediately, issues get resolved more quickly.