OPAL: A Primer
 By Knox LivelyMarch 10, 2022
Introduction
OPAL, or the Observe Processing and Analysis Language, is a powerful data processing language that allows Observe users to model their observability data to create new and actionable insights with relative ease.
Users don’t have to write OPAL if they don’t want to – every action in the UI generates an OPAL equivalent. Therefore, users may choose to perform operations in the UI, write OPAL by hand, or a mixture of both.
This article is intended to be a primer, an easy starting point for all things OPAL. In the coming weeks, we will launch a new blog series that will cover certain OPAL elements in more detail and with helpful real-world examples.
Note: Users can find the full OPAL reference guide here.
A Brief History
Because Observe was built with a temporal-relational foundation — how we combine time-series data with relational data — we quickly found that writing SQL queries was not scalable for the complex operations that Observe needs to perform. We created OPAL to “repackage” these unnecessarily complicated mathematical operations into a much more user-friendly syntax. This means our users don’t have to write, or debug, PhD-level SQL queries to use Observe most effectively.
OPAL is designed to perform declarative transformations (i.e. operations with no “side effects”) to allow users to quickly model and analyze data with no negative consequences. As an example, when you “drop” a column, OPAL doesn’t actually drop the column, it computes what the result would be when dropping that column, and then stores the result – while leaving the original unmodified.
This allows our users to change their minds and try different scenarios, re-analyze old data with new rules, non-destructively.
Anatomy
To make writing and understanding queries easier, we structured OPAL in a “pipeline” format that’s familiar to users of most observability tools. An OPAL pipeline is essentially a sequence of statements where the output of one statement is the input for the next statement.
This allows users to simply “chain” operations together, without having to worry about the order of operations and simply focus on their desired result. An OPAL pipeline can be a single line with one statement or many lines of complex shaping and filtering.
A pipeline contains four types of elements:
- Inputs: Which datasets to analyze
- Verbs: What processing to do on those datasets
- Functions: How to transform individual values in the data
- Outputs: What dataset to pass to the next verb (or the final result.)
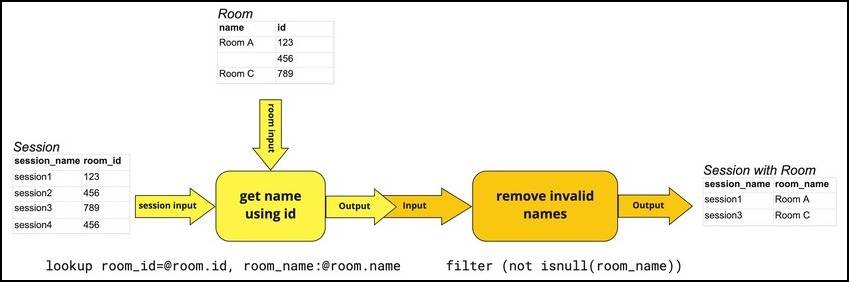
A complete pipeline, also called an OPAL script, consists of a series of inputs, verbs, functions, and outputs that define the desired result. The diagram below illustrates combining multiple elements: the first verb statement passes the results of its lookup operation to a second verb, which then uses a function to remove null values.
Inputs
Pipeline inputs are data sets or a structured representation of data from a given source. A common example in Observe would be an Event Stream. Pipelines may use as many data sets as required, although individual verbs vary in how many they accept. For example, the verb lookup accepts a main input dataset containing the field of interest and a lookup table dataset that maps those values to more useful ones.
A pipeline might be a single sequence of steps from input to output, or it may contain subqueries with individual processing of particular inputs. Users have the option to combine both for more complex operations. (See Language syntax for more details.)
Verbs
Verbs are the main actors in a pipeline. Each verb accepts a primary input, either the initial dataset or the output of the verb before it in the pipeline. Some verbs accept multiple dataset inputs, such as a join operation. A verb outputs exactly one output dataset.
Note: See the List of OPAL verbs for details on individual verbs.
Streamable vs. Unstreamable
An important consideration is whether the verb is streamable or not — meaning: the verb transforms one or more input data streams to an output data stream, and only then identifies which results are within the desired query time window.
To put it another way, if the results of a script depend on the size of the query time window (eg, ‘sum of all sizes’ with the statsby verb) then that cannot be accelerated, because there’s no way of knowing ahead of time what the query time window will be. But if the script uses no time window, or uses tumbling windows like with the timechart or align verbs, the time range of each bucket of data is known, and the script can be accelerated.
Streamability in verbs is an important concept to understand, as only streamable verbs produce datasets capable of being accelerated – which is necessary when building a dataset that will become a “building block” for other datasets. By contrast, worksheets and datasets that provide a “report” view on data, do not need to be streamable, because the user viewing the dataset will configure some particular time window when viewing it.
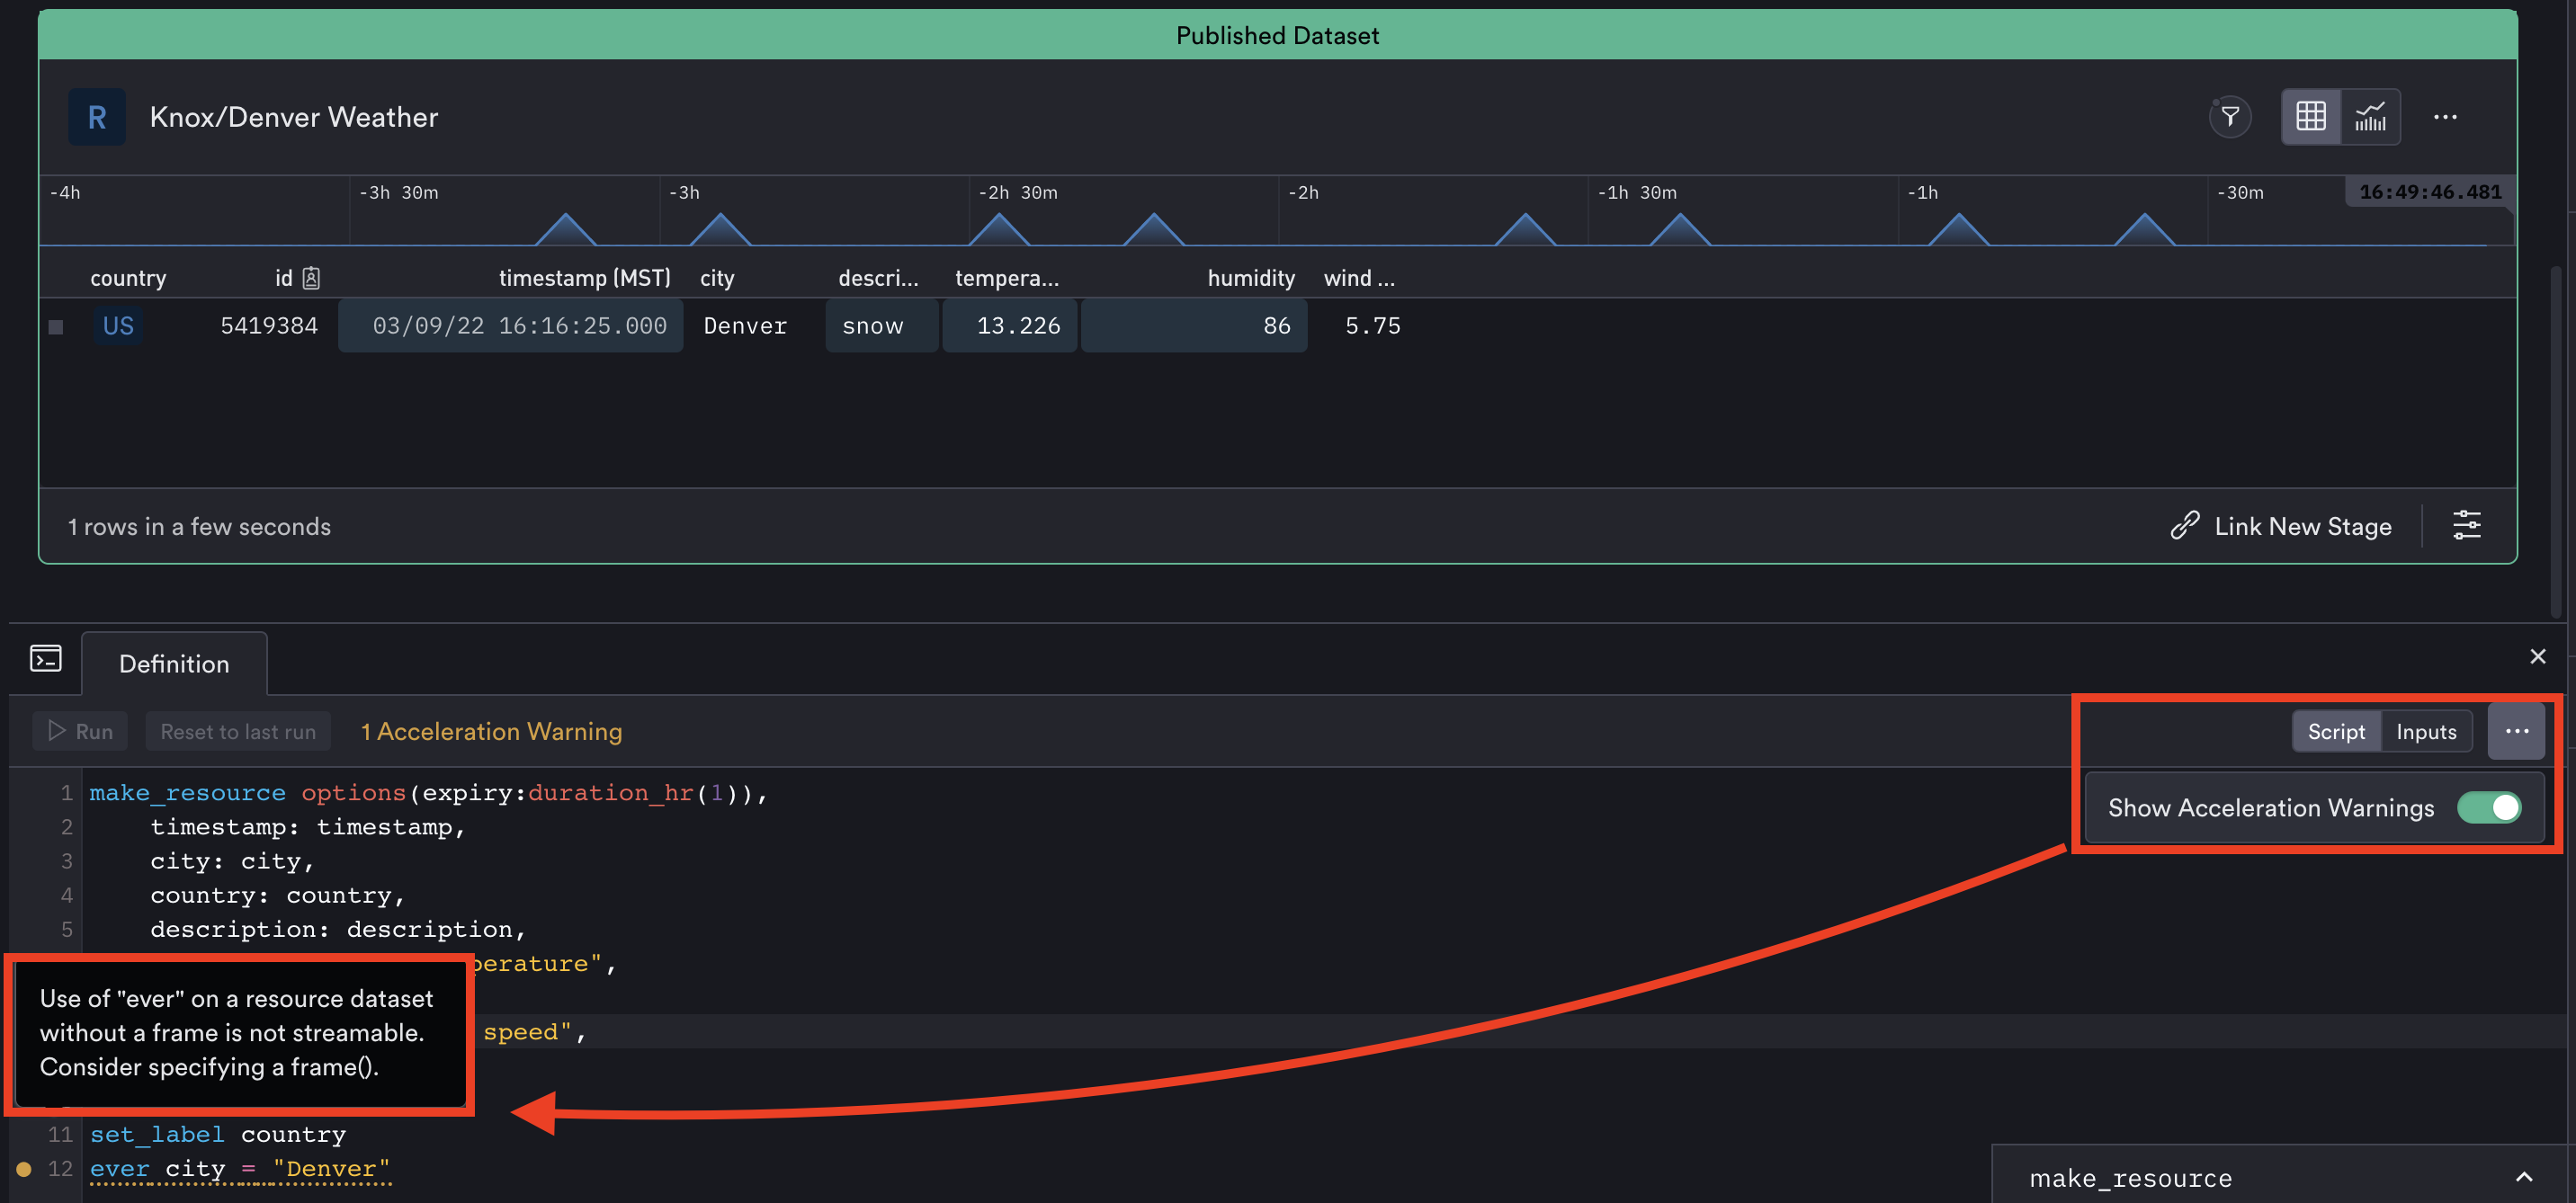
By default, “Show Acceleration Warnings” are enabled in the console to alert users whether a verb is streamable or not. Similarly, if a dataset is created using an unstreamable verb that dataset will display a warning stating that it “Cannot be accelerated.”
Streamable
Most Observe datasets are essentially data streams, where new data is continually being added and updated. Therefore, most OPAL verbs are streamable.
Note: Streamable verbs create streamable output datasets, which can be accelerated for better performance.
Unstreamable
A few verbs are unstreamable, meaning their output is different for different size query time windows.
Note: Unstreamable datasets can’t be accelerated, so the original filter must be applied each time the dataset is queried.
Unstreamable verbs perform many useful functions, particularly for ad hoc analysis in a Worksheet. But users can’t create a new dataset from those results, as it can’t be accelerated. To create a new dataset from a Worksheet, ensure that all its OPAL is streamable before publishing a new Event Stream.
Types of Verbs
Verbs are organized into several categories based on the action they perform. Some verbs belong to more than one category.
- Aggregate: Work with aggregate functions to summarize data.
- Filter: Select events matching an expression or condition, similar to
SQL SELECT WHERE. Afilterstatement might match a pattern or regular expression or return the top values for a group of values. - Join: Combine data from multiple datasets to generate an output value. For example, a
unionoperation adds new merged and appended fields from other event datasets to the primary input dataset. Theflattenfamily of verbs is also included in theJoincategory, as a special case of joining a dataset with itself to create new output events. - Metadata: Add information about the dataset itself, rather than act on the data it contains. These verbs add additional context about the dataset’s contents or define relationships between datasets. Common metadata operations are configuring foreign keys, registering types of metrics, and creating resources from event streams.
- Metrics: Specify how metrics are defined and aggregated, such as specifying the units of reported values.
- Projection: Create or remove fields based on existing fields or values. For example,
pick_colselects only the desired fields, dropping all others.
Note: For the complete list of verbs by category, see OPAL verbs by category.
Functions
Functions act on individual values rather than datasets; where verbs are set operations, acting upon input sets and returning output sets. A function is a scalar operation, as a result, it returns a single value per output row.
Note: See the List of OPAL functions for details on individual functions.
Types of Functions
Observe supports three general types of functions:
- Plain, or scalar functions: Act on values from an input event field, such as converting a timestamp or comparing two values. Scalar functions always output a single value per input event. Scalar functions may be used anywhere an expression can be used.
- Summarizing, or aggregate functions: Used within an aggregating verb statement (such as
statsby, to calculate a summary of multiple values across multiple input events. - Window functions: Look at the input events in the window and calculate an output value for each input event.
Functions also have a category, which is a useful aid in locating the correct function to perform the desired operation. For more, see OPAL functions by category.
Outputs
The results of a pipeline may be presented in a variety of ways like top K values, histograms, or small line charts (sparklines) for each column in the output dataset.
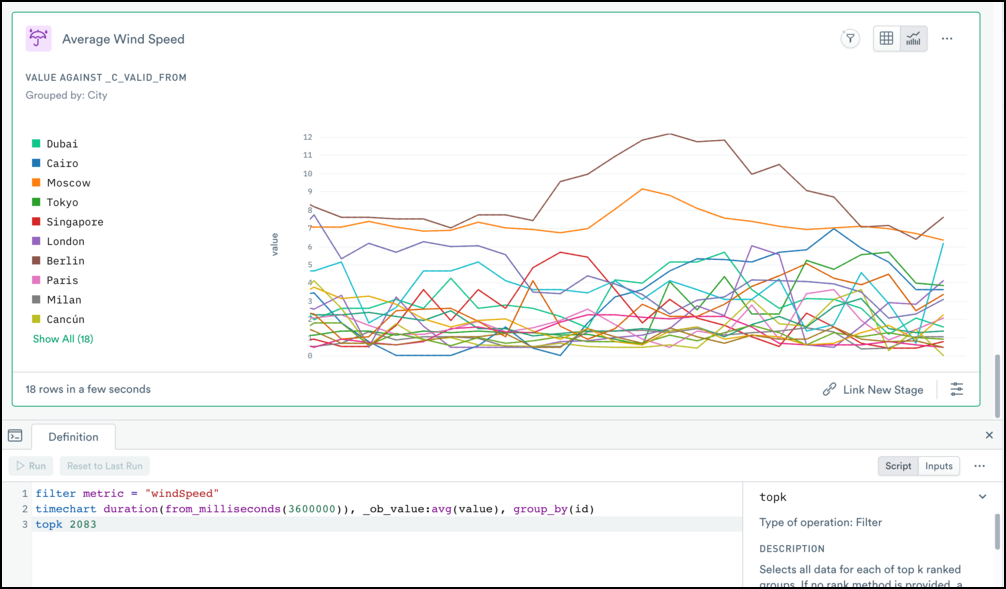
When users query or model data in the UI, many of these details are automatically handled for them – which may or may not be what they had in mind. If users want more control over how their data is visualized and modeled they can simply edit the OPAL generated by UI actions, or write the entire query (or model) in OPAL by hand. The defaults work for many cases, but there is always a way to adjust via OPAL if desired.
Next Steps
By default, Observe models datasets – which you can think of as a “collection of related information” – that we think the user wants to know more about, but each customers’ environment is as unique as your fingerprint. We can’t, and won’t, attempt to anticipate users’ needs or become prescriptive about the way users should model their data. That’s not what Observability is about because being overly prescriptive doesn’t work when users deal with unknown unknowns.
OPAL was designed specifically to let users model and analyze their data as they wish. As you might have noticed, there’s a lot to OPAL, but there’s no need to learn it all at once. You don’t need to be an OPAL expert to start getting value out of Observe, but familiarity with it will help you unlock even more potential in your data.
A good way to start is with navigating by using our UI, then editing the underlying OPAL as you get more comfortable. The more OPAL you read, write, and edit, the more familiar the language will become. Users can visit our in-depth OPAL reference guide, or visit our Slack support channel (#opal) should they need more context around what and which element to use.
Until then, keep your eyes out for our new blog series where each month we take a look at some verb, function, or other OPAL element in more detail.
If you or your company wants to take your observability strategy to the next level, we encourage you to try a free trial of Observe in action.