
Solving the Superman Problem: Observe offers GeoIP
 By Jack CoatesFebruary 20, 2024
It’s a troubling question.. are you sure it’s always your people using your VPN, or could their credentials have been stolen? How would you recognize valid login from an unauthorized user?
A powerful tool for detecting reuse of valid credentials is the Improbable Travel search. If you have two login events for an account, and your logs include an IP address for the user as well as a time stamp, then it’s a simple math operation to determine how fast that user would have had to move to physically perform both events. If it’s faster than an airplane, time to be suspicious – unless your user is Clark Kent. Observe customers have been using the Observability Cloud to tackle this rule with Azure Active Directory and Cloudflare data for a long time, but today it gets easier: we are releasing built-in IP Geolocation, powered by IPinfo.io, and native mapping visualizations.
If you’re already using Observe, you can get started with this quick tutorial.
The challenge with this sort of search is tuning down the false positives without introducing false negatives. Here’s a few tricks that might help your search to be more accurate and less noisy.
Filtering out Known Matches
The biggest problem in security operations is filtering out false positives… everyone’s terrified of a false negative, so tuning biases towards allowing false positives instead, which steals time from the analysts working the incident investigation queue. The Improbable Travel rule’s false positive looks like traveling sales people and DevOps engineers’ normal usage. A sales person or field engineer frequently changes networks as they move from hotel wifi to cell phone hotspot to customer guest network, and some of those networks backhaul to their internet point of presence far from your employee’s physical location. It’s not hard at all to physically travel forty miles at an average of forty miles per hour while leaving a network trail that looks like it went from Reno to Boise to Salt Lake City in the same time frame. An engineer with DevOps responsibilities can have the same appearance, remoting to systems and services all over; especially if their newer cloud service activities also include interaction with older systems via jump boxes. Add in a distributed company structure where that engineer might be traveling just like a salesperson, and the likelihood of a false positive goes up. There’s a few techniques to consider for reducing this sort of challenge.
- The bluntest and simplest tool is to reduce the set of considered actors. Groups of people, IPs associated with approved VPNs, or particular SSO (single sign on) targets that see a lot of use by travelers might be knocked out of consideration at the top. The downside of this is obvious: those users are highly interesting targets for an attacker trying to steal credentials.
- So, a more elegant solution is to compare the initial dataset (say, authentication logs) with other service usage: for instance if you’ve also got logs from 2FA SSO (two factor authentication) pings. While the two factors are unlikely to appear like they’re coming from exactly the same location unless GPS data is used, which is harder than it sounds, they probably should be within a few hundred miles of each other.
- A related tool that comes up with lower resolution GeoIP data is to use the radius of the returned data. For instance if the two locations appear to be 1000 kilometers apart but the data accuracy radius is 100 kilometers, that radius can be subtracted before doing the speed calculation. We don’t currently expose radius because it’s under 10 kilometers with IPinfo.io, but the same result can be met by setting a distance floor instead (for example, do not calculate speed if the distance is under 200km).
Visualizations
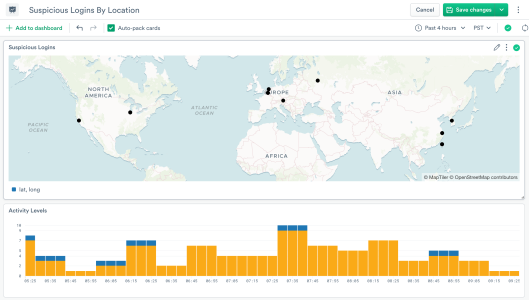
Once you’ve got this location data, the next step is obviously a dashboard! Observe makes it easy to visualize these logins to get an intuitive understanding of where activity is happening. The first visualization we’ve supported is location dots, which allow you to display event locations with interactive zooming and customizable tooltips.
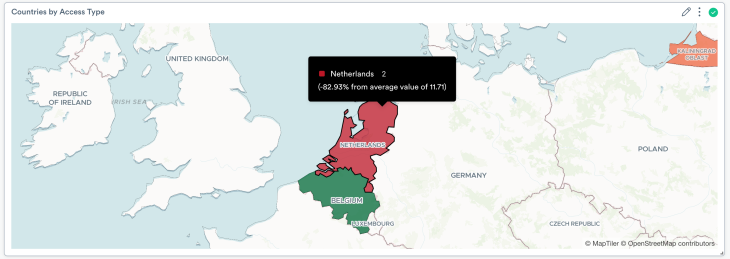
The second visualization is a choropleth, for differentiating two types or scales of data. For instance, you might want to show suspicious activity versus normal activity by country of origin:
What’s Next?
Improbable Travel is only the first step for geographic enrichment data… here are some other great ideas to think about.
Many organizations have to follow rules around countries or regions that they’re allowed to do business with. Geographic enrichment of logs can help determine if there’s something to investigate related to forbidden access. If there is interaction with unexpected countries or regions, you could determine if that activity is inbound or outbound, document the investigation, and automate a monitor for alerting on incidents that are more concerning.
On a more positive note, it’s useful to know where your business is coming from. Where do your customers work from, and are you able to provide sufficient speed and scale to those locations?
If you’re using Threat Intel, geographic enrichment can be a useful visualization to see where scanners, CnC, Tor, and other threats are coming from (or spoofing IPs from).Try Observe out today, and let us know what you think!