Integrating CloudWatch Metrics in Under 60 Minutes
 By Noah Martin,April 13, 2021
Overview
On March 31st, 2021 AWS launched a new feature called CloudWatch Metric Streams. The release of this new feature allows AWS customers to export CloudWatch metrics data with less configuration, less management overhead, and reduced costs. Traditionally, customers would need to deploy a third-party agent or a Lambda function to poll metrics via the GetMetricData API call. In addition to deploying proprietary agents or collectors, customers would then get hit with an AWS bill of $0.01 per 1000 metrics. If a customer is generating large amounts of metrics over multiple accounts this can quickly become a blocker in terms of exporting metrics to third-party systems.
With CloudWatch Metric Streams you can send AWS metrics directly to Observe by simply pointing Kinesis Firehose at our collector endpoint. This feature will reduce costs from $0.01 to $0.003 per 1000 metrics, reduce the management overhead of maintaining agents (or Lambdas), as well as reduce latency in terms of when metrics show up in Observe.
The ability to integrate this new data source into Observe was a trivial undertaking that required no code changes on our end. As a platform, Observe is designed to empower customers to be able to quickly and easily get value out of their data without being forced to use a proprietary agent or write any custom code.
We do this by not forcing customers to follow any particular formats or specifications upon ingestion, and by providing mechanisms to ingest from a variety of popular collection methods.
Ingesting CloudWatch Metrics into Observe
AWS makes it easy to quickly set up a Firehose delivery stream via the AWS Management Console. Observe accepts telemetry data from Kinesis Firehose via the Observe Kinesis Collector HTTP endpoint. In addition to setting up a Firehose delivery stream, customers will also need to set up a metric stream to feed into their delivery stream. Once those services are configured you will begin seeing the metrics appear in your Observe instance. Now, let’s explore what I saw when I first set up the integration.
Shaping and exploring CloudWatch Metrics in Observe – Part I
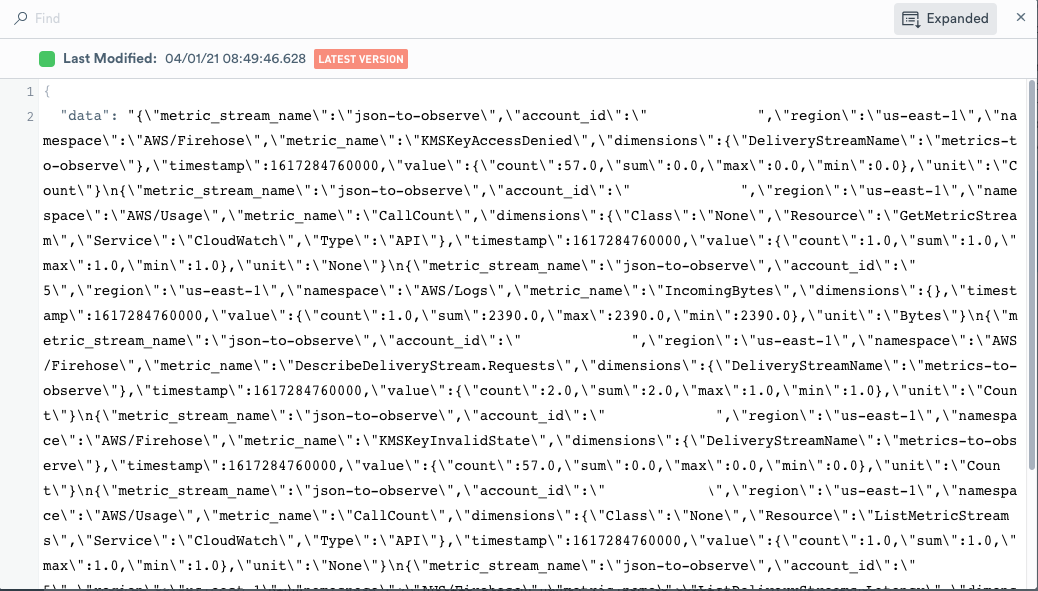
The first thing you see when ingesting these metrics is that these records are batched as newline delimited JSON objects. Fortunately, Observe doesn’t care about the structure of the data. These records can be easily broken into individual objects that you actually care about and presented in a human-readable way. To do this we are going to use OPAL (Observe Processing Analytics Language) to quickly extract the information we need, instead of using the UI. OPAL is our analytics and processing language which enables users to process event stream data coming into Observe.
It is important to note, the processing that we do on data not only applies to the live data coming into Observe, but it’s also retroactively applied to previously ingested data. Another wonderful thing about Observe is that if AWS were to change the way they format their data it is trivial to change the shape of that same data we previously defined. Let’s walk through the code line by line.
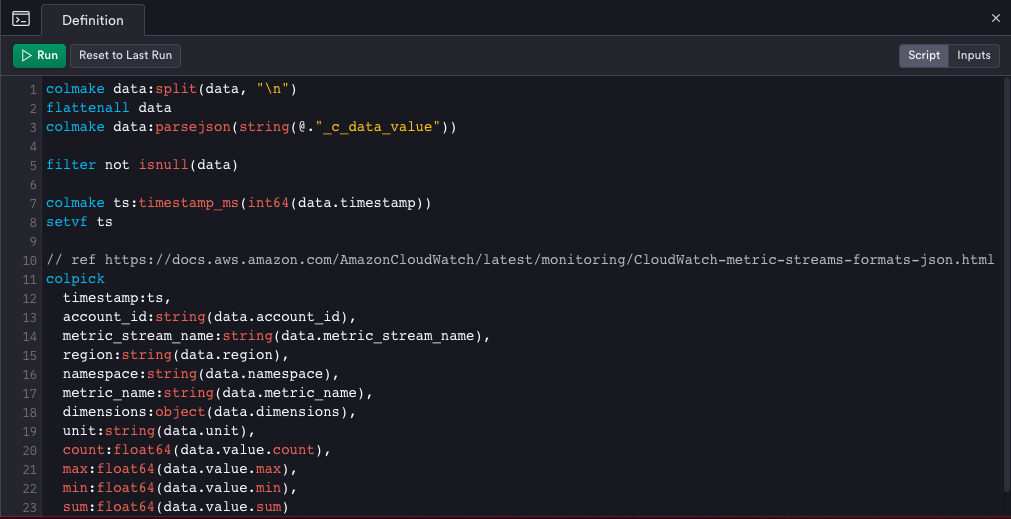
The first line in this snippet tells Observe to split the batched events into an array of JSON objects at each newline character. I then made each object in the array into its own unique event with the flattenall verb, while also converting the type with parsejson. Next, I replaced the timestamp (which is the time-at-ingest) with the timestamp that was provided by each event object. Lastly, I extracted the key/value pairs from the JSON Object events and assigned the keys to columns, and the values as the data in each corresponding row.
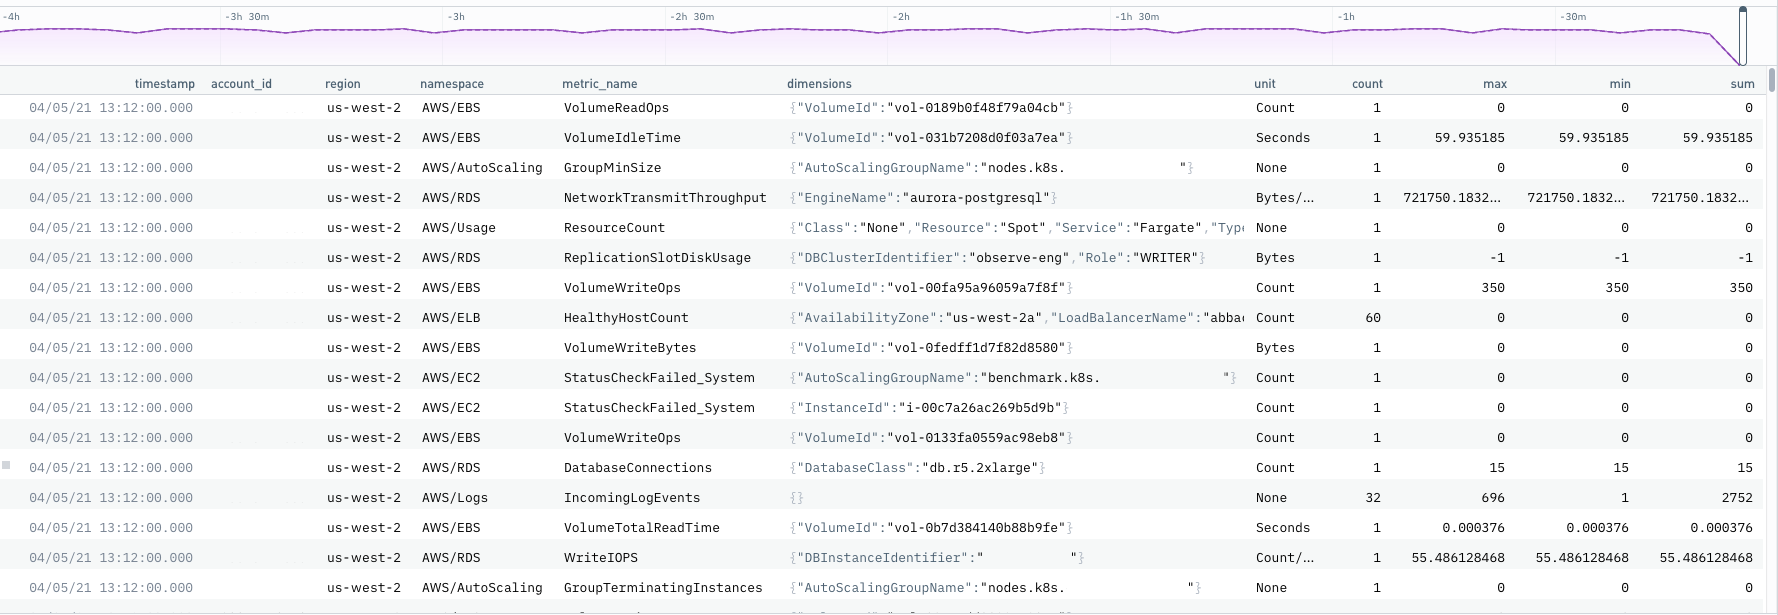
This fairly simple OPAL query allowed me to quickly get all the information I needed below!
Shaping and exploring CloudWatch Metrics in Observe – Part II
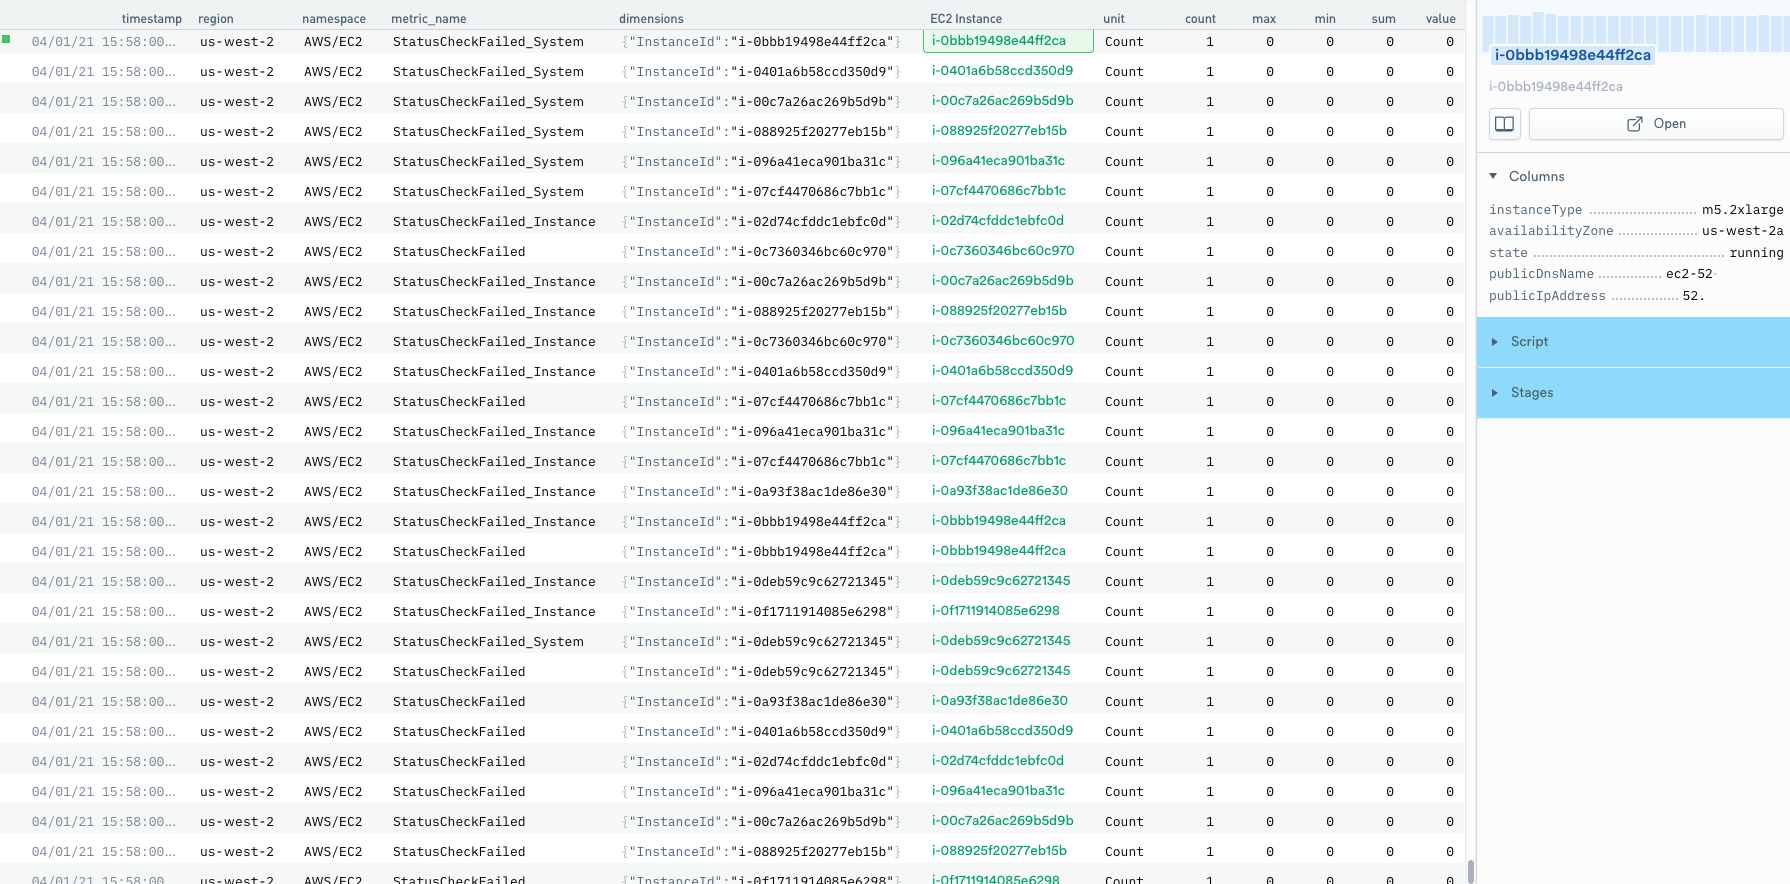
Continuing with data shaping, let’s see how you can easily filter on and pull out EC2 specific metrics from your CloudWatch Metrics Event Stream. In addition to extracting EC2 specific metrics, you can also “link” your metrics to your EC2 Instance Resource. This will allow the metrics you define to be automatically added to your EC2 Instance resource view.
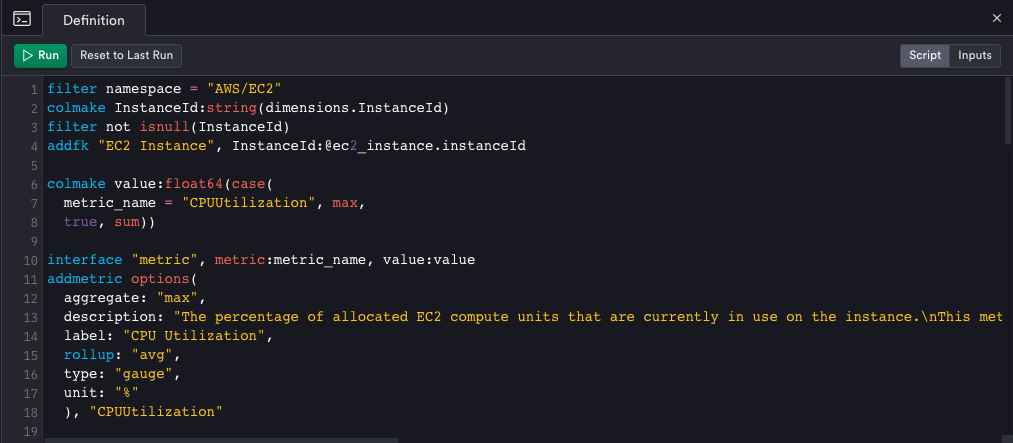
The first thing I did was to filter my CloudWatch Metrics on the EC2 Namespace. Next, I broke out and filtered out non-null InstanceId’s to ensure each of my metrics was associated with a particular EC2 Instance. I then “linked” the current EC2 Metrics Event Stream to my EC2 Instance Resource by adding a Foreign Key (addfk) relationship, with the common field being InstanceId.
I then performed some conditional shaping of the CPUUtilization metric to bring the data together in a common format. After that, I used the “metric” interface verb. This prepares a dataset for use as a metrics dataset and changes how related datasets can interact with this metrics dataset. Finally, I defined my metric with the addmetric verb so that it can be visualized on my EC2 Instance Resource Landing Page.
Here you can see how I was able to link back to the EC2 Instance Resource. This allows me to associate specific metrics coming in from CloudWatch Metric Streams to a specific instance!
While this may seem like a bit of work to create, these dataset definitions can be shared and reused. We enable users to version, deploy and share these dataset definitions via Terraform. Additionally, many of these dataset definitions are pre-built and provided right out of the box. For scenarios where we do not have a pre-built module, the Data Engineering team is eager to work with you to develop the datasets you need.
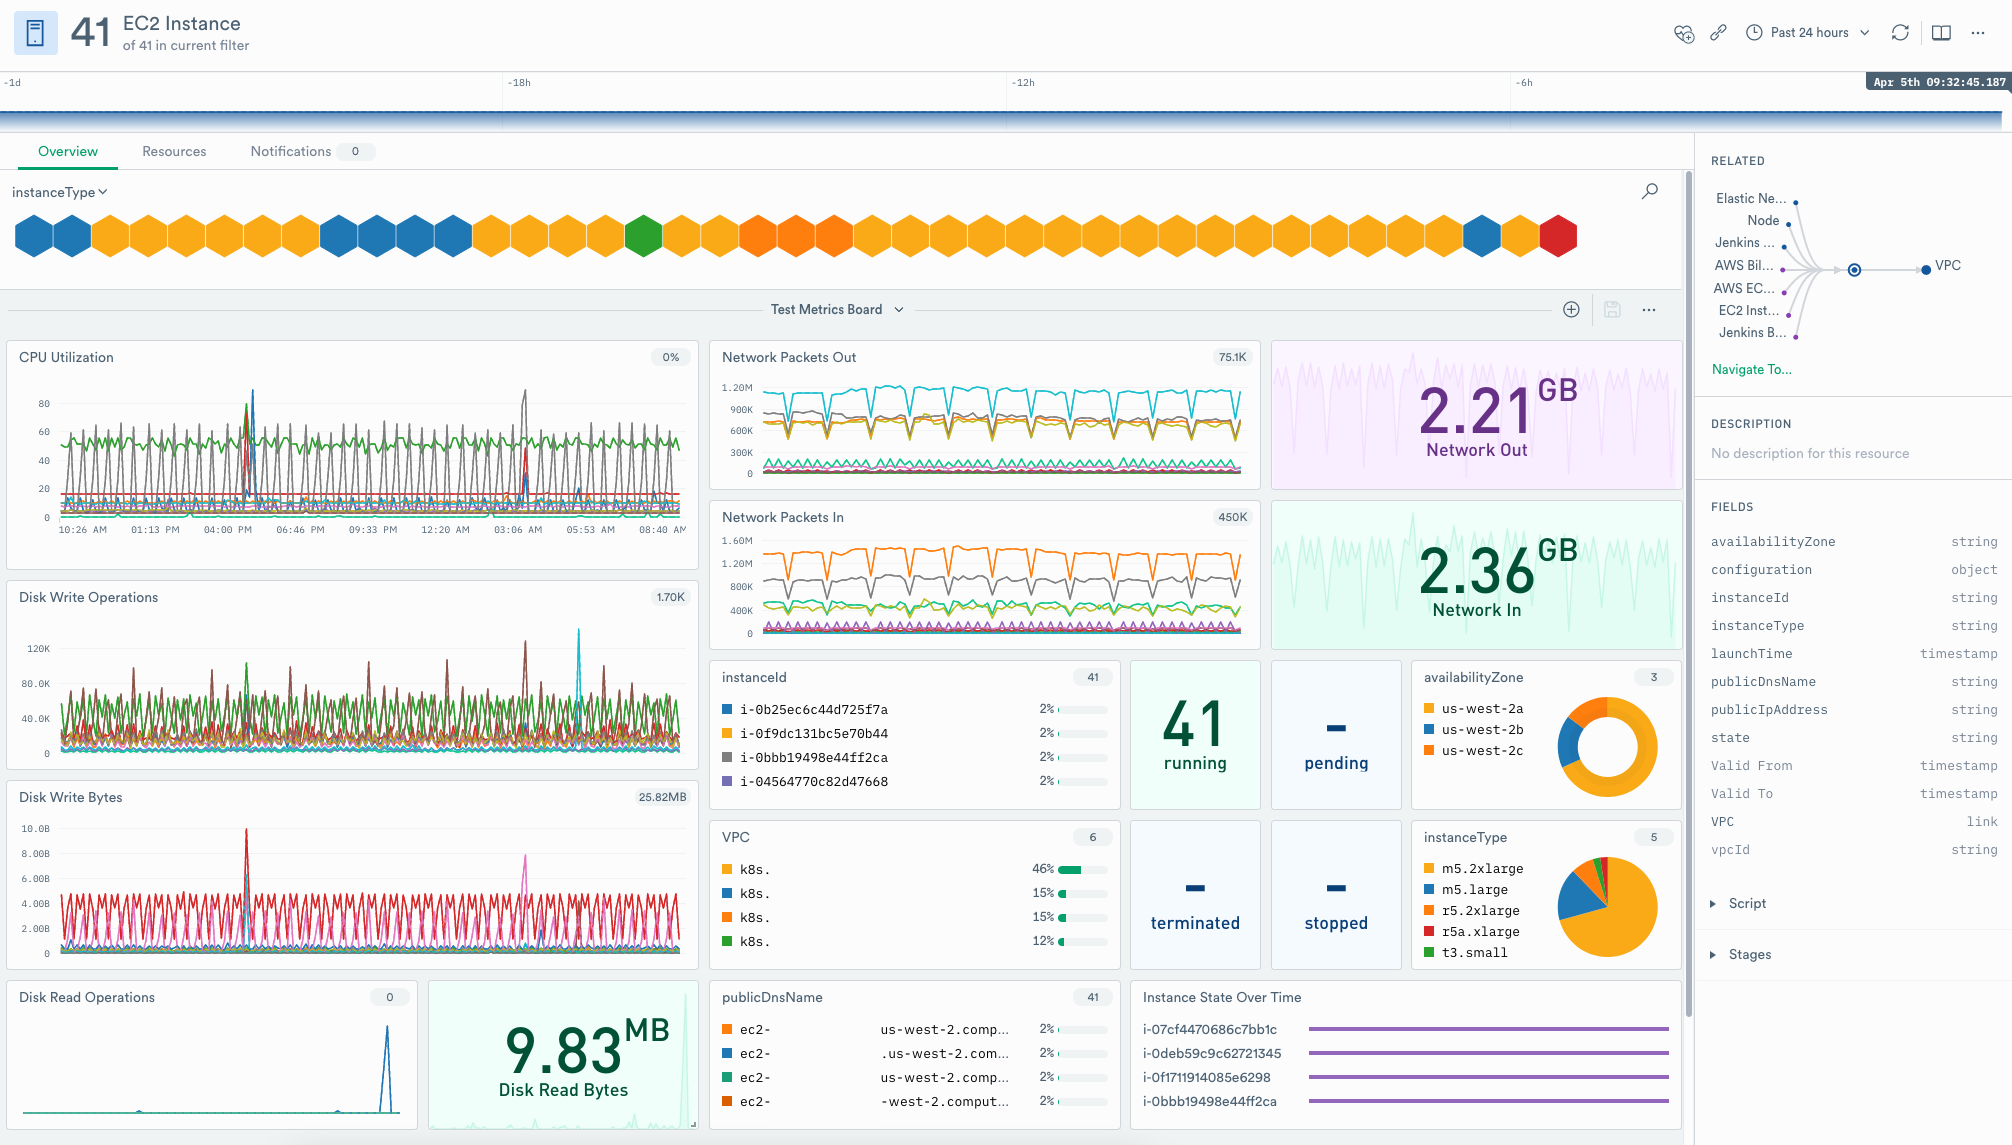
Visualizing your CloudWatch Metrics in Observe
By linking data together and creating new relationships, these metrics then surface in landing pages for the related resource. Resource landing pages are programmatically generated dashboards for exploring the entities you care about. Whether that’s EC2 instances, Kubernetes pods, or even customers. For users who want to customize their views, Observe also gives you the ability to freely create and shape whichever views you wish.
Summary
The workflows here can be applied to virtually any metric or telemetry you want to send to Observe, regardless of the format. At Observe we aim to eliminate any pain our customers have around Observability. To do that, we provide pre-built integrations for a variety of AWS services including, but not limited to, S3, Lambda, VPC, RDS, ELBs, and much more.
When you begin to centralize all of the data from your AWS environment(s) into Observe you’ll be able to draw correlations from data that was traditionally disparate and unrelated. Data such as customer support tickets, CI/CD pipeline events, and end-user telemetry are all now relatable events, ultimately leading to true Observability. This will empower you to iterate faster, smarter, and triage more intelligently, which will result in happier customers.
Get started with Observe today using our AWS integration or one of our other 250+ integrations. Request trial access here.