Not Another Single Glass of Pain
Forget legacy logs without context, annoying alerts that aren’t actionable, and dead end dashboards.
Investigate any level of detail, on any issue. Always see relevant event data — from logs, metrics or traces — in context, with just a few clicks.
-
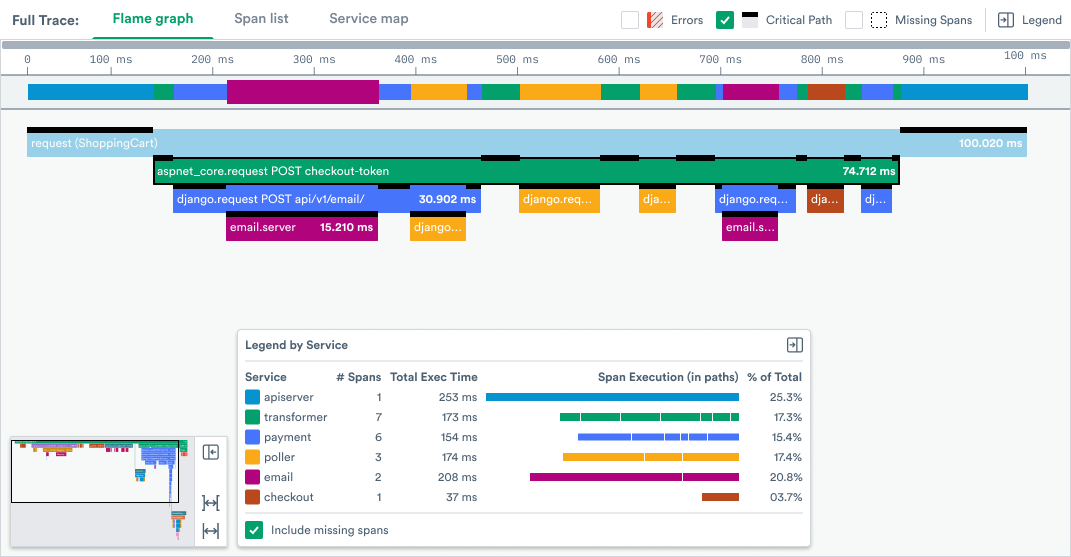
Application Performance Management
Get complete visibility into the health and performance of applications. Detect and resolve performance issues no matter where they occur in the entire stack. No sampling. No blind spots. Learn More.
-
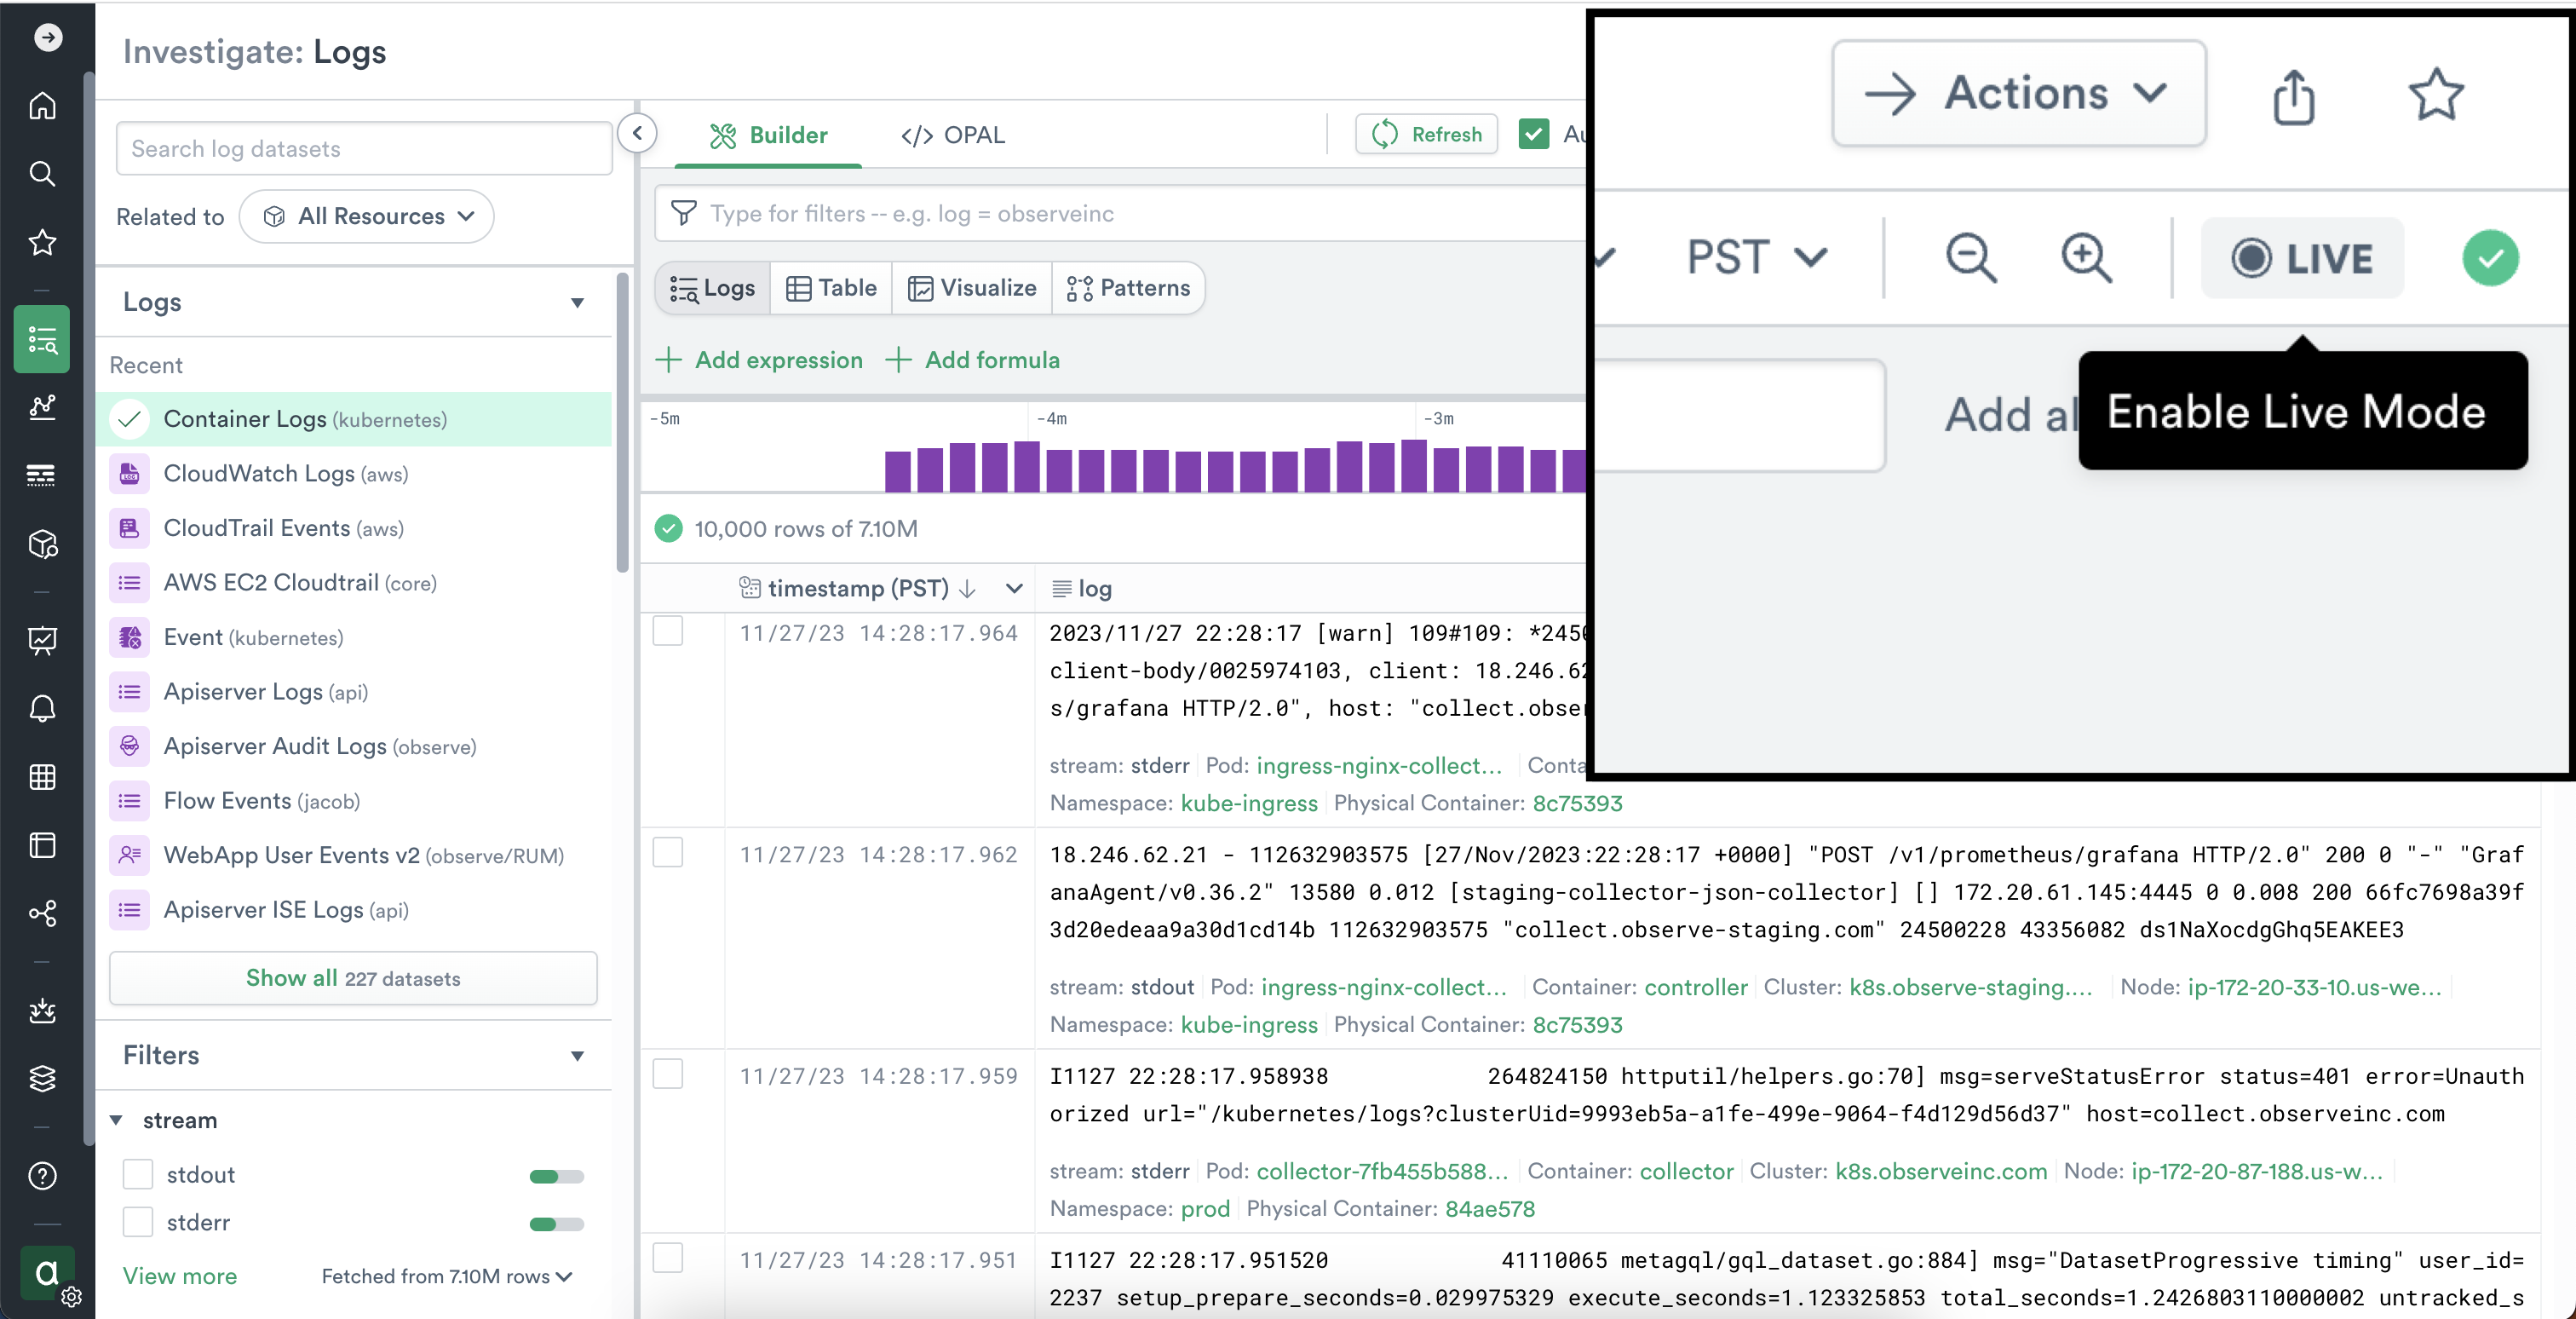
Log Analytics
Search and analyze event data across your applications, infrastructure, security, or business without worrying about indexing, data tiers, retention policies, or cost. Keep all log data always hot. Learn More.
-
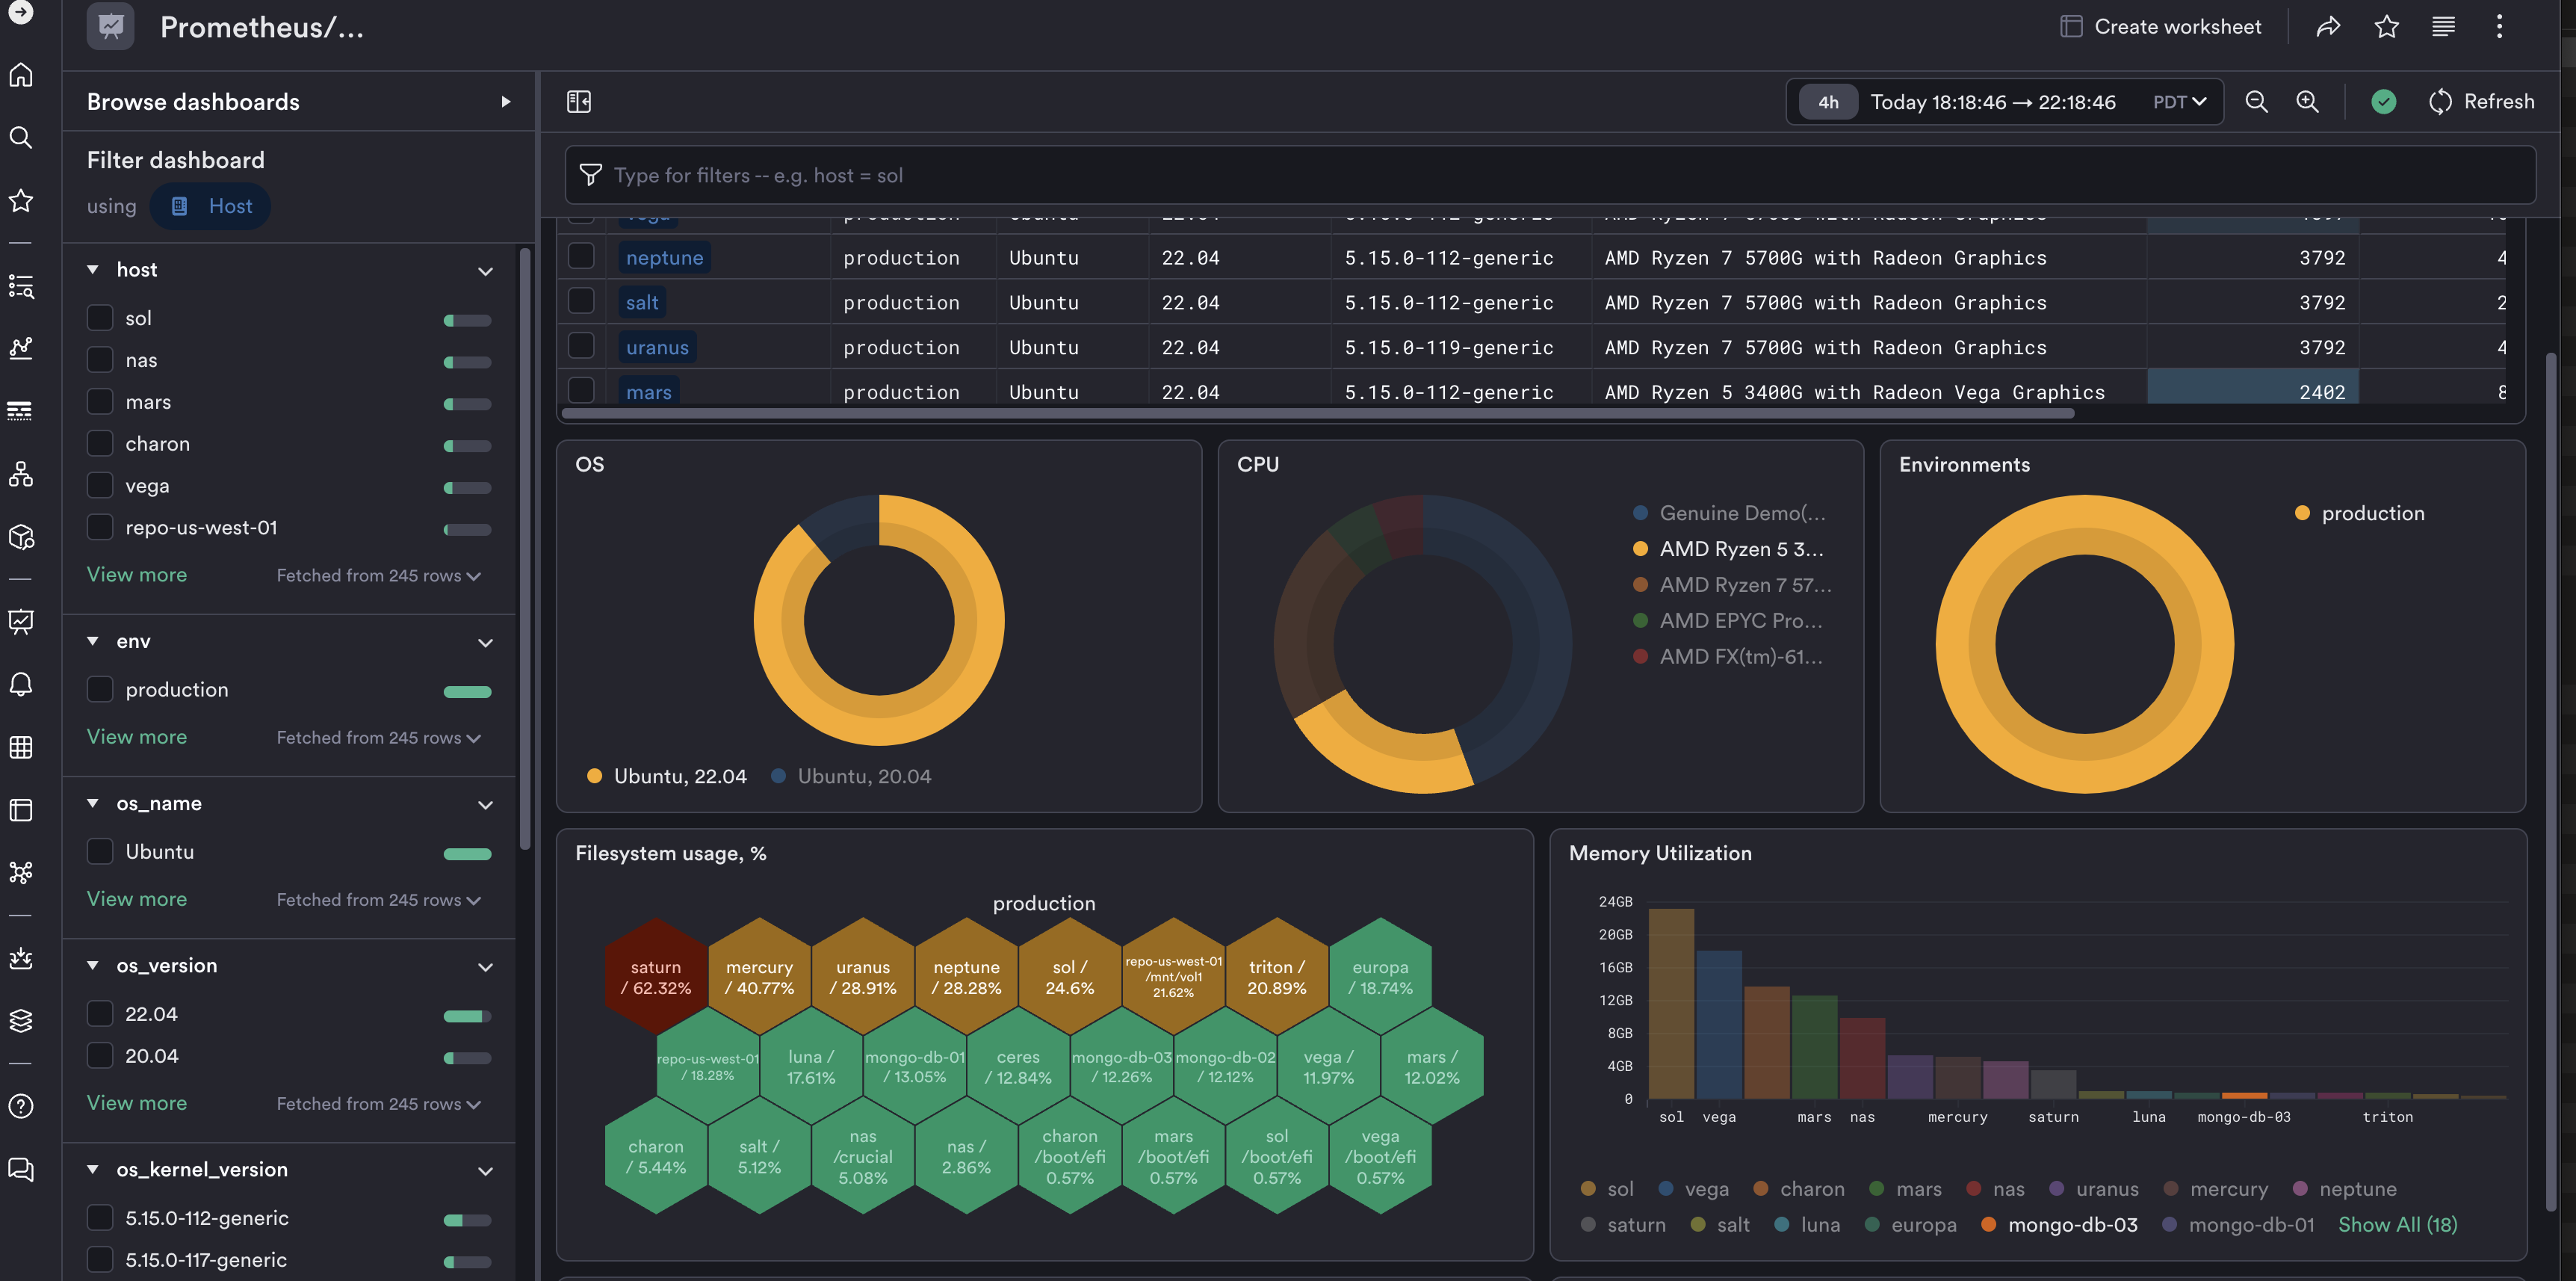
Infrastructure Monitoring
Capture metrics across your infrastructure – cloud, Kubernetes, serverless, applications or from over 400 pre-built integrations. Visualize the entire stack and troubleshoot performance issues in real-time. Learn More.
-
O11y AI
Investigate and resolve incidents faster with O11y Investigator. Use natural language to explore observability data with O11y Copilot, generate Regular Expressions effortlessly with O11y Regex, and obtain precise answers with O11y GPT. Learn More.

-
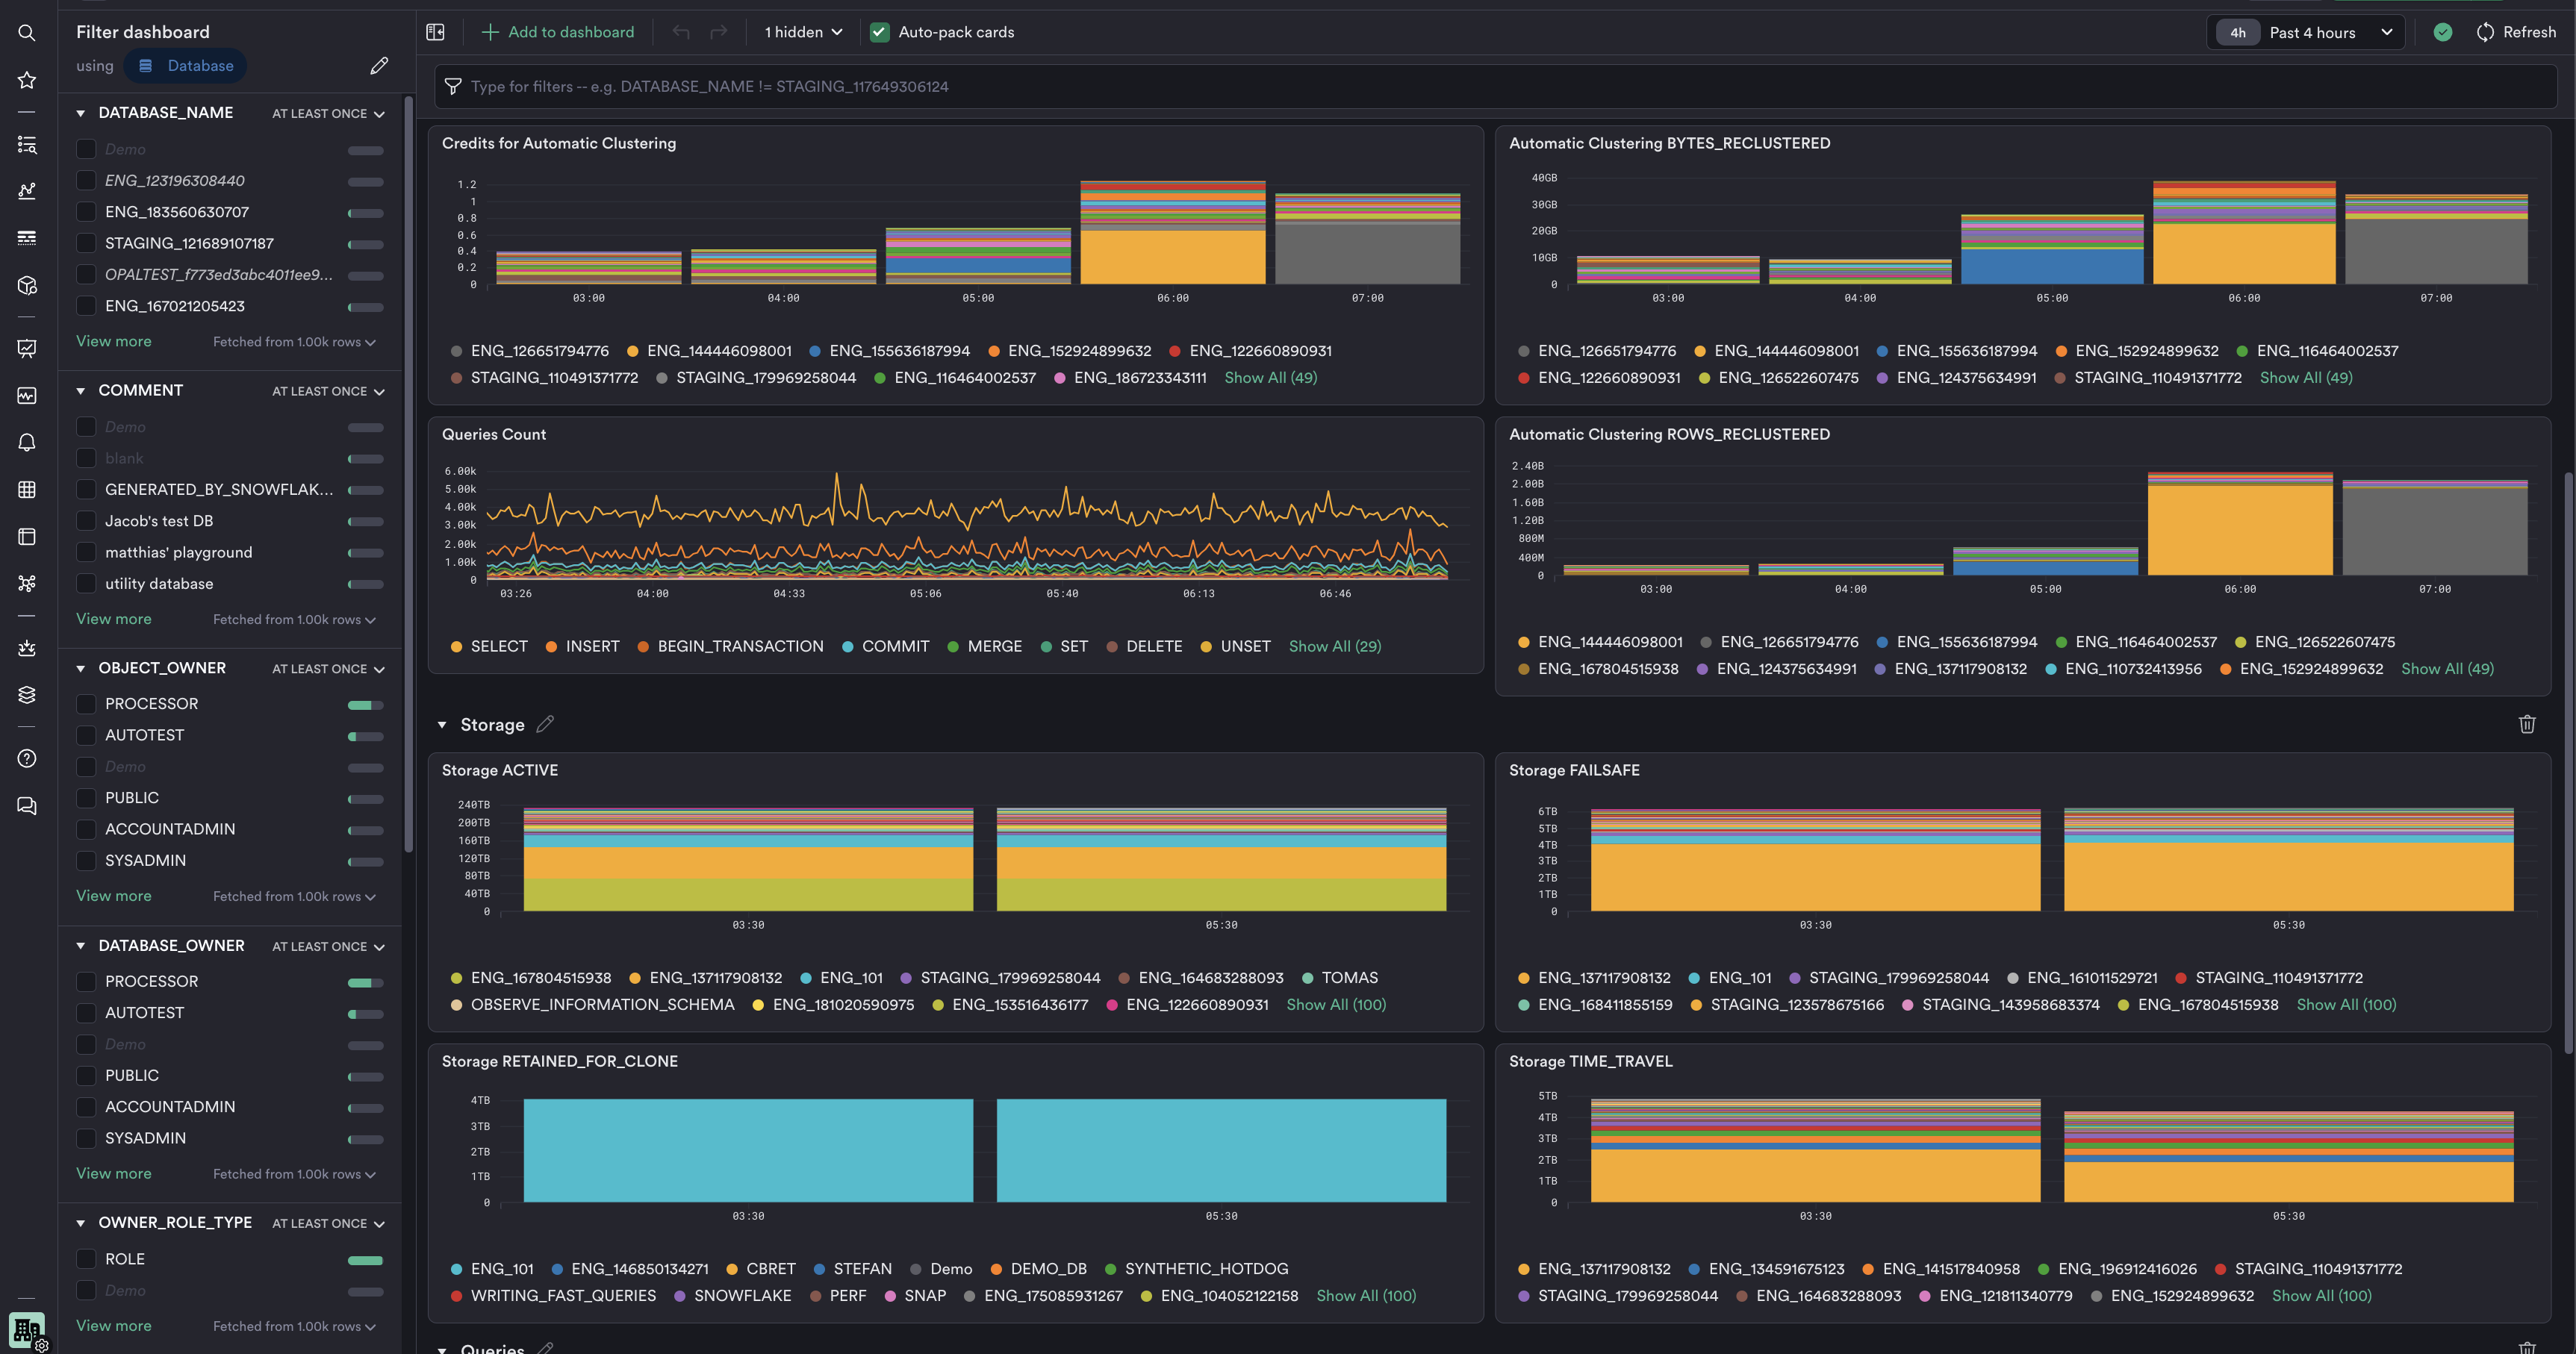
Observe for Snowflake
Comprehensive observability into Snowflake workloads. Optimize performance and resource utilization. Deliver secure and compliant operations.
Observe for Snowflake is available in the Snowflake Marketplace with a free-tier for up to 1 TiB/month. Free-tier never expires and includes all Observe features. Learn More.
Resources
O11y Investigator – Agentic AI to Drive Faster Resolution
Investigating incident alerts can be repetitive and yield varying results. Each time an SRE receives an alert, they look up the associated runbook and follow the same steps…
September 26, 2024
Introducing OpenTelemetry-Native Application Performance Management
We’re excited to announce the general availability of Observe Application Performance Management. Customers rely on Observe APM capabilities to drive lower MTTR and deliver exceptional end user experiences. Service…
September 26, 2024
Making Snowflake Observability Easy
We’ve posted a few times on this blog about why Observe chose to build on Snowflake, and how we take advantage of Snowflake’s modern architecture to deliver value…
August 13, 2024
Want to dig deeper?
Integration
Observe can ingest data from almost any source, in any format with 400+ integrations.
Learn More