
I’ve been on-call during outages that ruined weekends, sat through postmortems that felt like therapy, and reviewed diffs where a single log line would have saved six hours of debugging. These experiences are not edge cases, they’re the norm in modern production systems.
We’ve come a long way since Google’s Site Reliability Engineering book reframed uptime as an engineering discipline. Error budgets, observability, and the principle of automating toil have made the job of building and running software far more sane.
But here's the uncomfortable truth: most production systems are still fundamentally reactive. We detect after the fact. We respond too slowly. We investigate with context scattered across tools and brains.
We’re overdue for a shift.
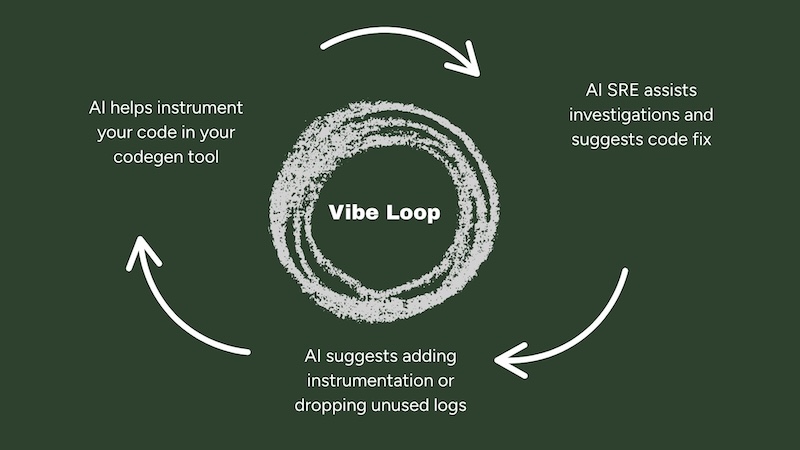
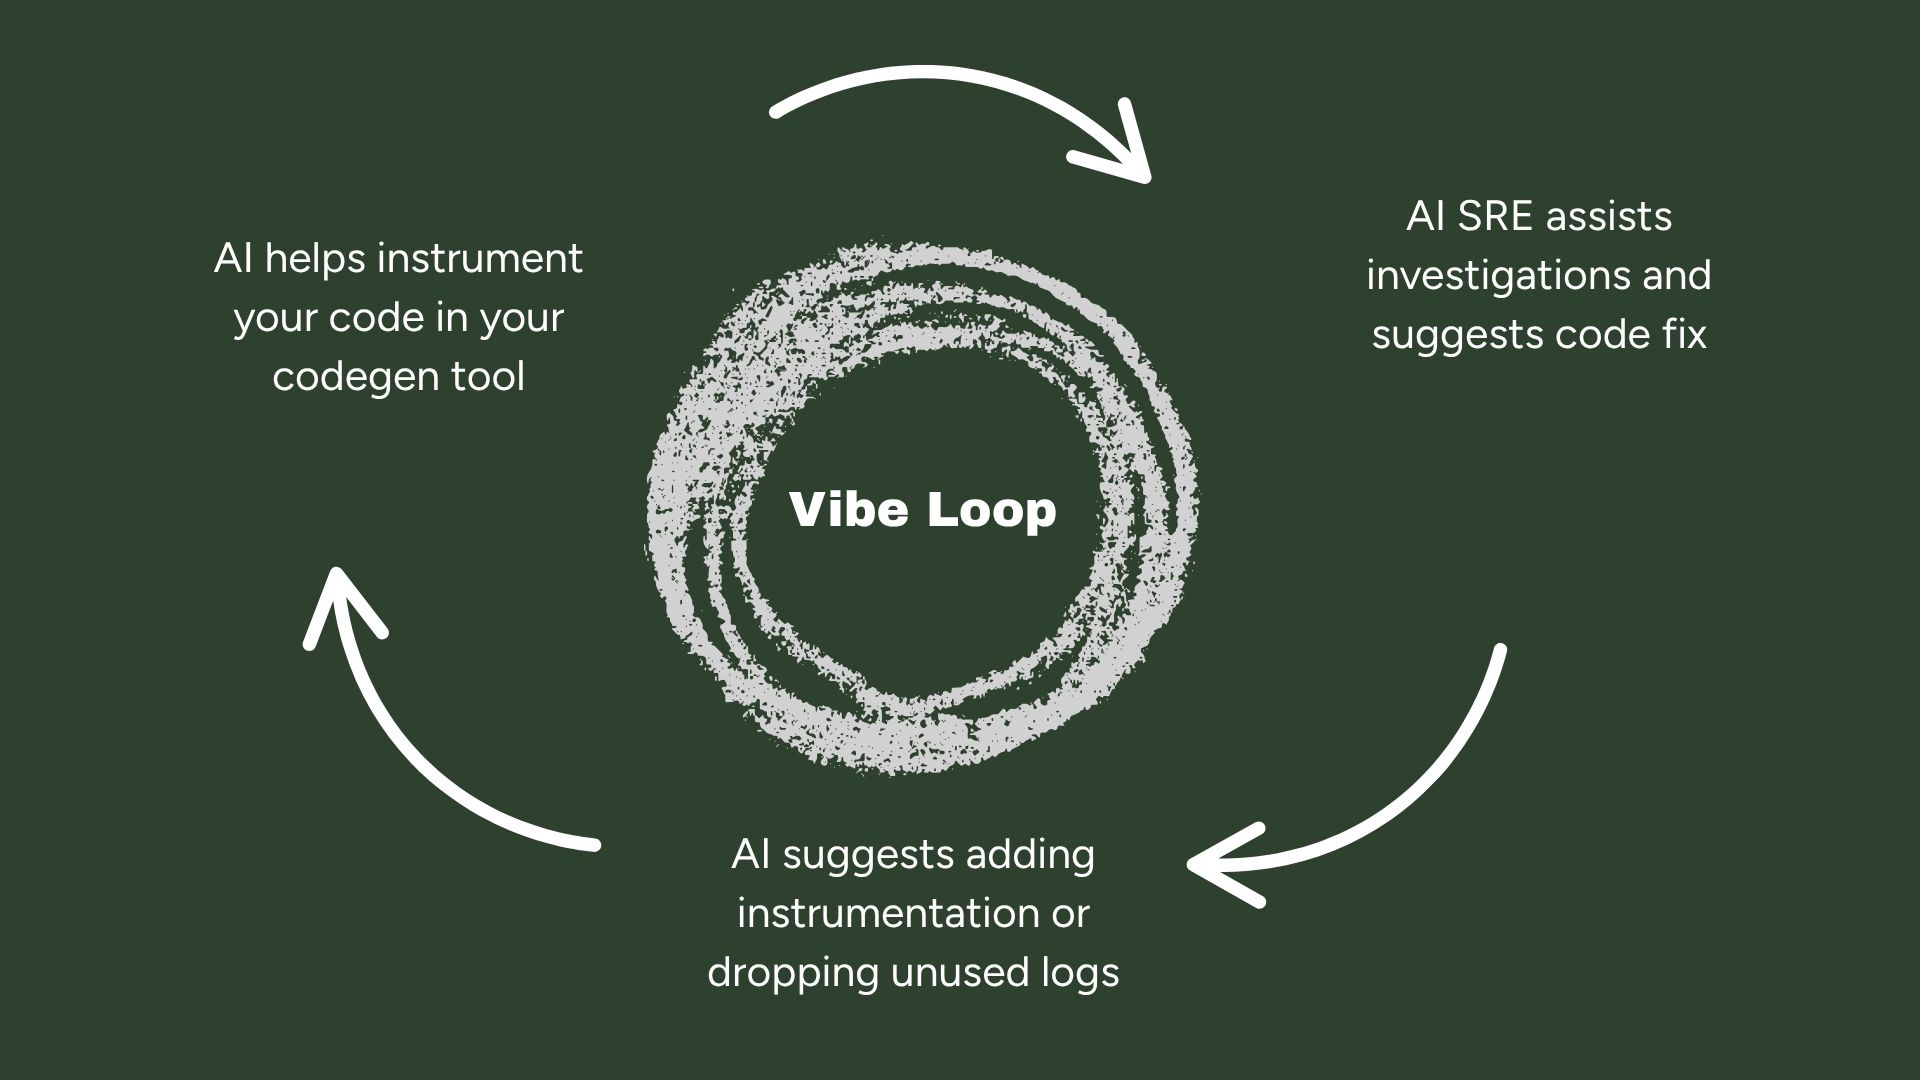
What’s emerging now, and what I believe will define the next era of reliability engineering, is what I’m calling Vibe Loop: A tight, AI-native feedback loop between writing code, observing it in production, learning from it, and improving it fast.
I’m a big believer in the potential of AI (I was previously founding team member at Rockset, acquired by OpenAI) but I am not here to say AI will solve all our problems. Let us examine the possibilities.
Why Vibe Loop?
The name is deliberately informal. Developers are already talking about “vibe coding”: working in flow with a coding agent, prompting and shaping code collaboratively. And “vibe ops” which extends the same concepts into devops. But what happens when we extend that same concept into production reliability engineering?
Vibe Loop is what happens when the system vibes back. When your infrastructure, telemetry, and AI tools close the loop from incident to insight to improvement — without you having to tab between five dashboards.
It’s not a tool. It’s a new model for working with production systems. One where:
- Instrumentation is generated with your code
- Observability improves as incidents happen
- Blind spots are surfaced and resolved automatically
- Telemetry becomes adaptive - focusing on signal, not noise
- Postmortems aren’t artifacts - they’re inputs to learning systems

Step 1: Prompt your AI codegen tool to instrument
With tools like Cursor or Copilot, your code doesn’t need to be born blind. You can — and should — prompt your coding agent to instrument as you build:
“Write this handler and include OpenTelemetry spans for each major step.”
“Track retries and log external API status codes.”
“Emit counters for cache hits and DB fallbacks.”
This is the developer experience we’ve been sprinting toward: Observability-by-default
OpenTelemetry makes this possible. It’s become the de facto standard for structured, vendor-agnostic instrumentation. If you’re not using it, start now. You’ll want to feed your future debugging loops with rich, standardized data.
Step 2: Add the Context Layer
Raw telemetry is not enough. AI tools, the good ones, need context, not just data. That’s where the Knowledge Graph comes in.
Think of the Knowledge Graph as the glue between your code, your infra, and your telemetry data:
- What services exist?
- What changed recently?
- Who owns what?
- What’s been alerting?
- What failed before — and how was it fixed?
The MCP server provides agents access to this in a structured, queryable way. Your AI SRE agent now knows what it's looking at.
When something breaks, you can ask:
“Look up 500s and show the exception stack traces that caused them”
“Several users are reporting that payment is failing. Can you analyze log, metrics, and traces in Observe in the past 1 hour to identify what's causing the issue?”
And you’ll get more than just charts. You’ll get reasoning: past incidents, correlated spans, recent deploy diffs, the kind of context your best engineers would bring, but now, instantly available.
The interesting thing about MCP servers (see Cursor, Claude and Augment Code examples here) is that it is becoming a standard expectation that most systems will soon support it - similar to exposing an API interface. This means your AI agent can gather context across multiple tools and reason about it. Even if some of that context lives in separate monitoring stacks or internal tools like Slack and Notion.
Step 3: Close the Observability Feedback Loop
Here’s where Vibe Loop gets powerful: AI doesn’t just help you understand production, it helps you evolve it.
When there’s a blind spot, the system could tell you:
“You’re catching and retrying 502s here, but not logging the response.”
“This span is missing key attributes. Want to annotate it?”
“This error path has never been traced — want me to add instrumentation?”
Just as important: AI could help you trim the fat.
“This log line has been emitted 5M times this month, never queried. Drop it?”
“These traces are sampled but unused — reduce cardinality?”
“These alerts fire frequently but are never actionable — want to suppress?”
You’re no longer chasing every trace. You’re curating telemetry with intent.
Observability becomes adaptive.
From Incident to Insight to Code Change
What makes VibeLoop different from traditional SRE workflows is speed and continuity. You’re not just firefighting and then writing a doc. You’re tightening the loop:
- Incident happens
- AI investigates, correlates, surfaces potential root causes
- It recalls past similar events and their resolutions
- It proposes instrumentation or mitigation changes
- It helps you implement those changes in code, immediately
This is what SRE wanted from “eliminate toil.” But now the system actually helps you investigates incidents and write better code after every failure.
What This Looks Like Day-to-Day
If you're a developer, this might feel like:
- You prompt your AI to write a service, and instrument itself.
- A week later, a spike in latency hits prod.
- You prompt:
“Why did 95th percentile latency jump in EU after 10am?”
- AI answers:
“Deploy at 09:45 added a retry loop. Downstream service B is rate-limiting.”
- You agree with the hypothesis and take action
- AI suggests you close the loop:
Want to log headers and reduce retries?
- You say yes. It generates the PR.
- You merge, deploy, and resolve.
No Jira ticket. No handoff. No forgetting.
That’s Vibe Loop.
Final Thought: Site Reliability Taught Us What to Aim For. Vibe Loop Gets There.
I don’t think this is a single AI agent. Instead I envision a series of smaller agents that get specific repeatable tasks done, and suggest hypotheses with greater accuracy over time. I also don’t believe these AI agents will replace engineers. But they will empower the average engineer and allow them to operate at expert level.
But I do believe that production systems should:
- Tell us when something’s wrong
- Explain it
- Learn from it
- And help us fix it.
If SRE was about shifting ops left, Vibe Loop is about closing the loop—back into the editor, into the prompt, into the way we write and think about code.
It’s not perfect. But it’s the first time I’ve felt like our tools are catching up to the complexity of the systems we run.
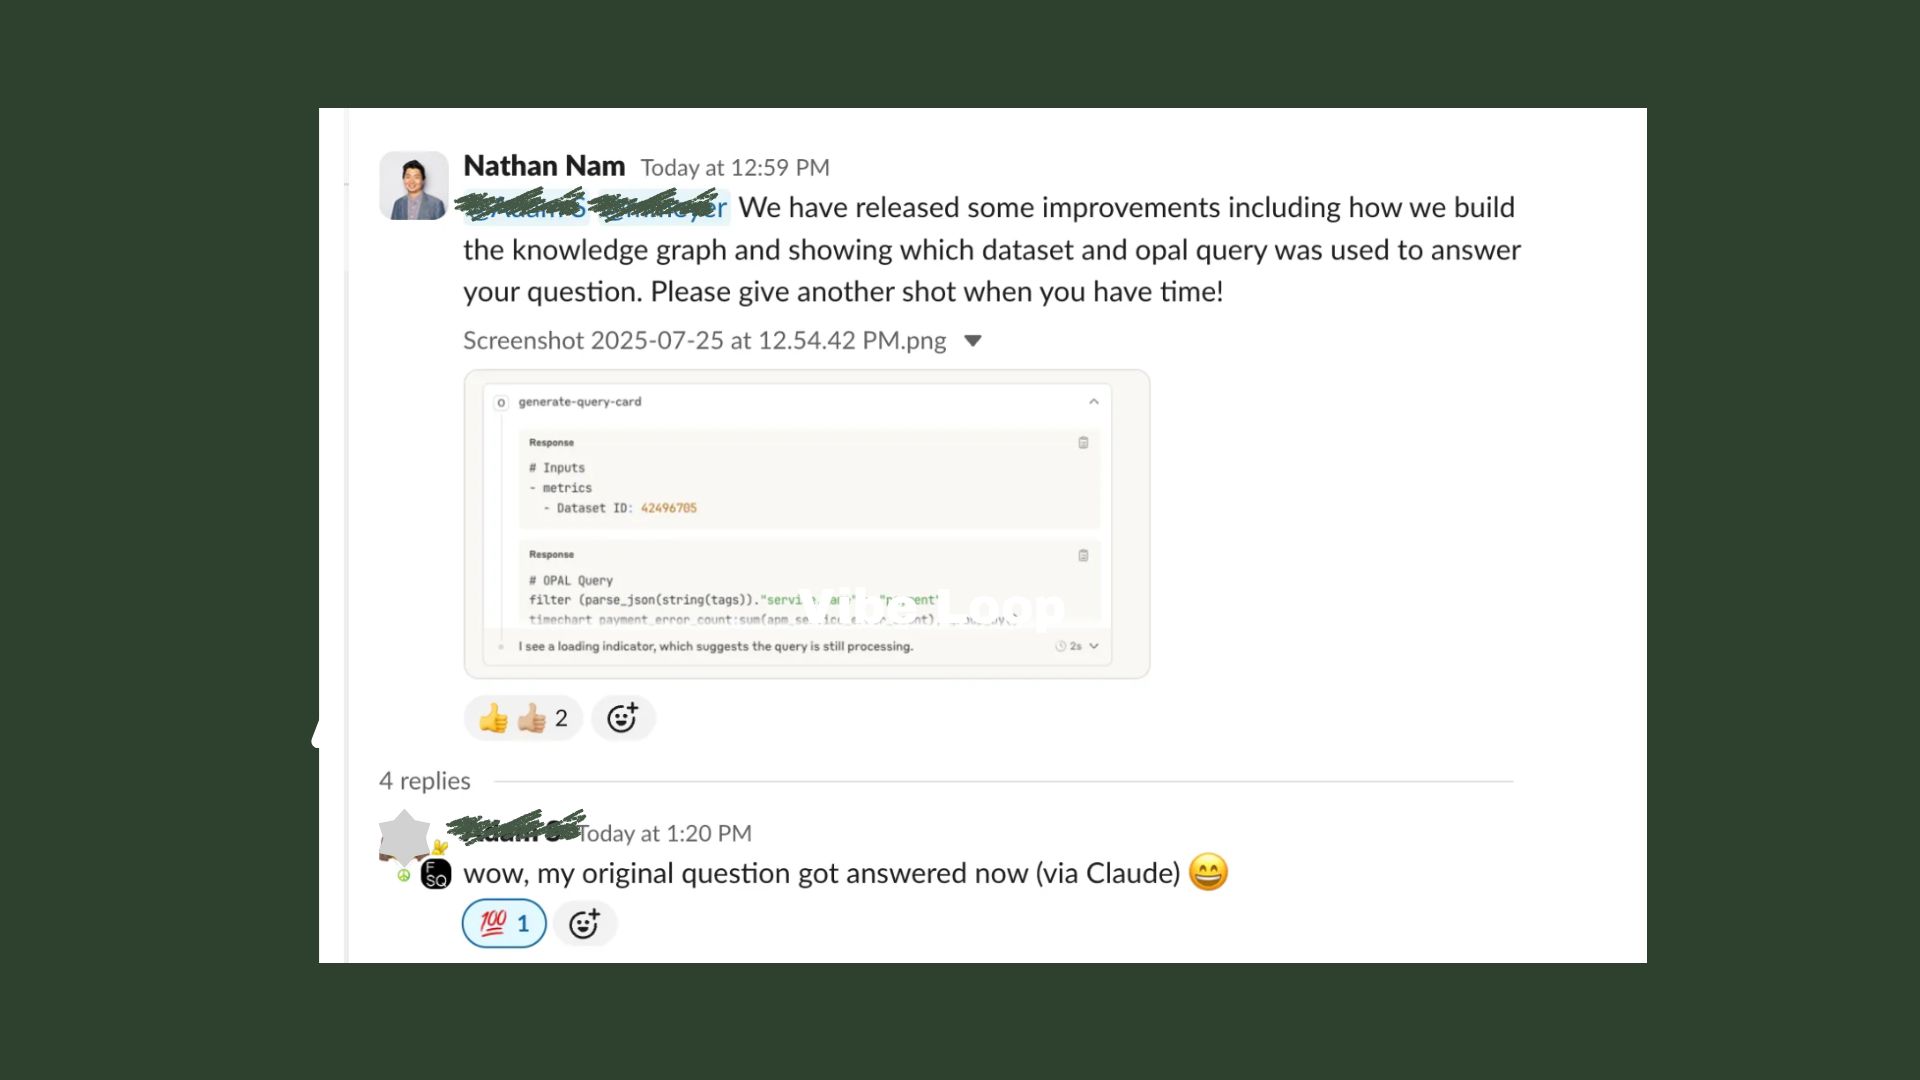
And it’s not a pipe dream. Our enterprise customers are using words like “inspiring”, “exciting” and “wow” as they go on this journey with us. Exciting times!

Observe provides open, scalable AI-powered observability by correlating logs, metrics, and traces directly in your data lake, enabling faster troubleshooting at a much lower cost.


