
AI-Driven Observability for TypeScript with o11y.ai

Observability has typically been something developers think about later in the development cycle, perhaps added on when things break in production. o11y.ai flips that model. It brings AI-driven observability directly into your development flow, so you can ship more reliable code from day one.
This post explains how to monitor a TypeScript app the AI way, from instrumentation to investigation and debugging to automated fixes, all powered by o11y.ai.
What Is o11y.ai?
o11y.ai is an observability agent that lets developers instrument, debug, and fix their apps—all in the same environment. It helps teams design and build for reliability, early in the development process.
By embedding observability from the start, teams can get proactive suggestions instead of reactive alerts and catch regressions before they reach production. This reduces incident recovery time and unplanned work, the biggest drags on developer velocity.
o11y.ai makes it easy for developers to get started with observability, using industry-standard OpenTelemetry, without having to troubleshoot across siloed tools or learn a new query language. Within o11y.ai, developers can:
- Instrument apps automatically.
- Get an observability score that quantifies coverage.
- Debug issues in natural language.
- Receive AI-suggested fixes and auto-generate pull requests.
By merging these steps into a one AI-augmented workflow, o11y.ai makes developers more productive, with fewer context switches between tools.
Using o11y.ai with Your TypeScript App
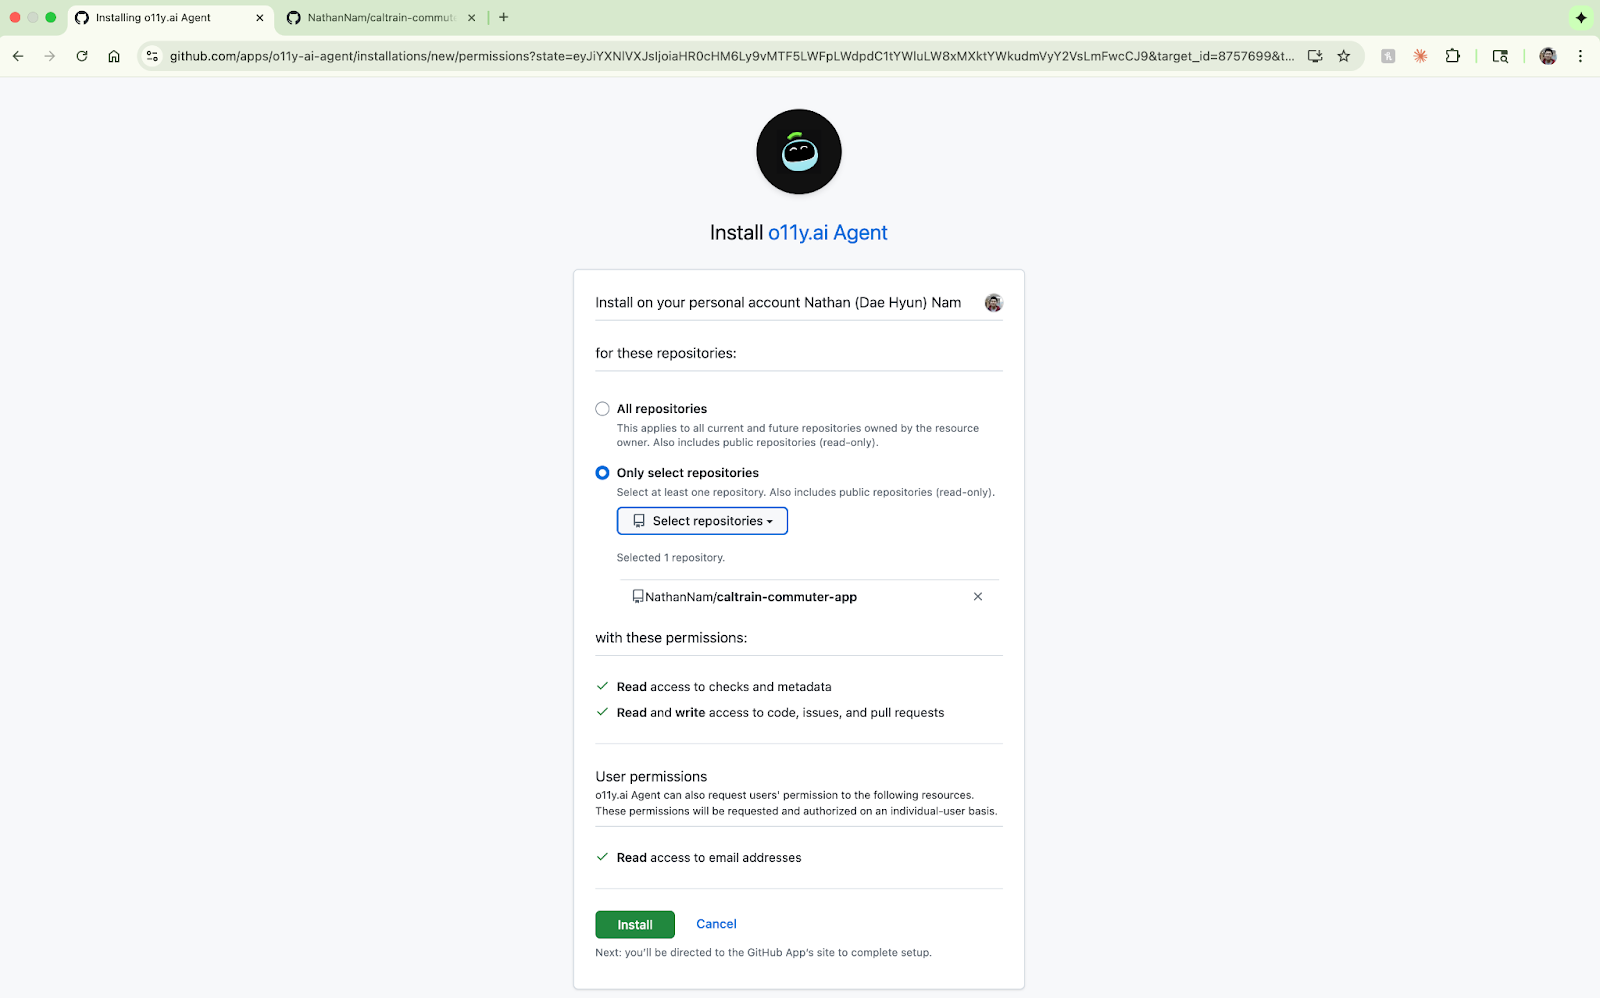
The first version of o11y.ai supports TypeScript apps, with other language support to follow. The first step with using o11y.ai is to connect it to your code. To do so, we set up the o11y.ai agent with the GitHub repositories you select.
Instrumentation
After the initial setup, o11y.ai will give you an o11y Score, indicating your current observability coverage and identifying any gaps.

To improve observability coverage, you will need to add more instrumentation to your code. This is something o11y.ai can automate for you.
o11y.ai uses a remote coding agent and some extensive hand-tuned prompts to learn what frameworks are being used and how to instrument them. The goal is to provide you an easy on-ramp to observability in fully automated fashion, complete with all the environment settings that are unique to your platforms, without requiring any effort from the user.
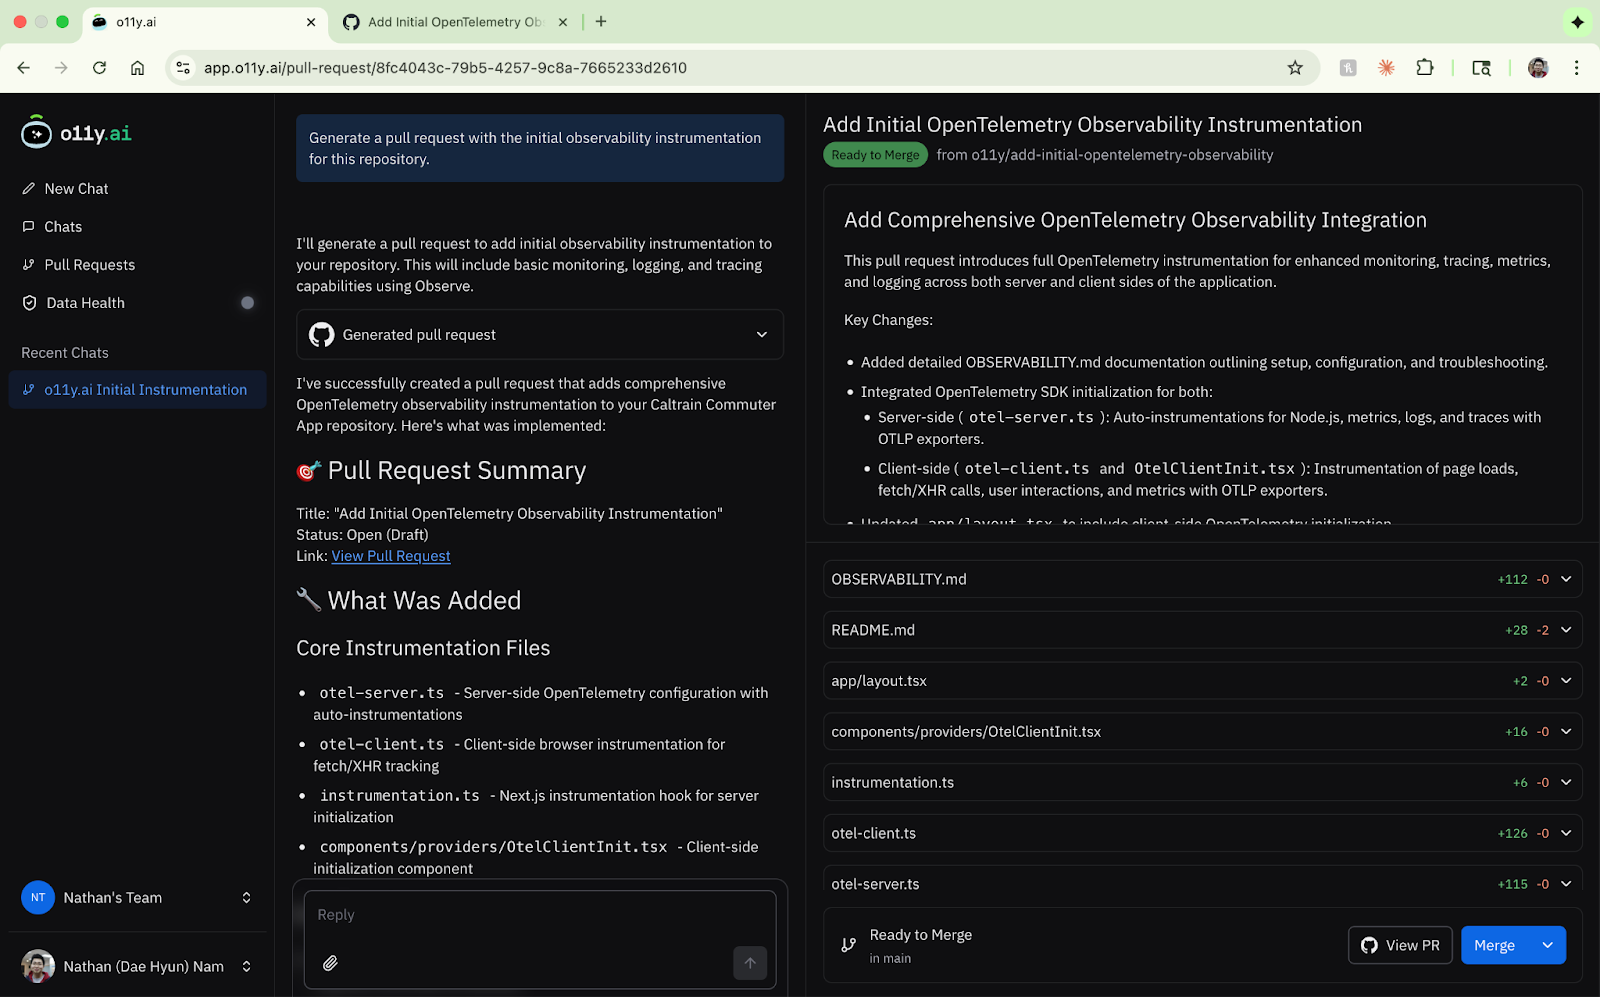
It will generate a pull request with OpenTelemetry instrumentation. All you need to do is review and merge the PR. And this should boost your o11y Score.

Debugging
Once instrumented, you can now collect telemetry for your TypeScript app. o11y.ai is backed by an instance of Observe, including its unified data lake and knowledge graph, that lets it store and run context-aware analytics on any telemetry you collect.
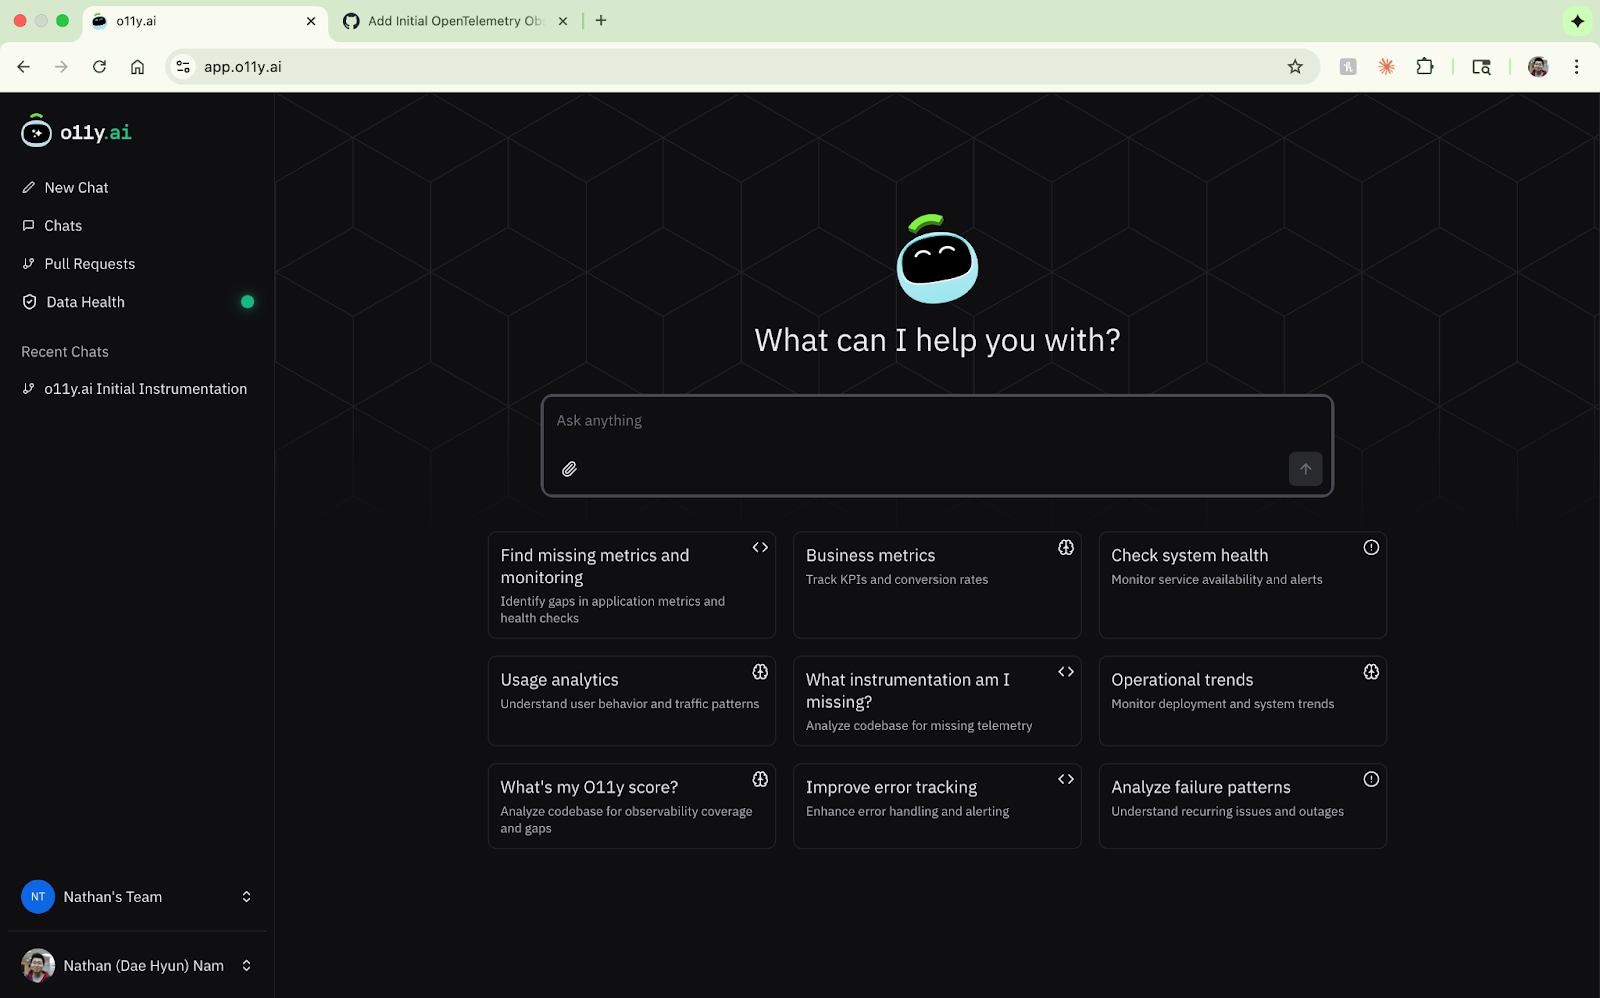
With observability data flowing, interact with it using a chat interface within o11y.ai. Common starting questions include:
- Finding performance bottlenecks
- Monitoring resource utilization
- Identifying current errors and exceptions
You may be interested in understanding performance in your app, so you could simply ask o11y.ai using natural language:
“Identify performance bottlenecks in my application including slow database queries, API endpoints, and resource-intensive operations. Provide specific optimization recommendations.”
o11y.ai will give you an in-depth analysis of what’s happening in your app and identify any areas of concern.

Fixing Your Code
o11y.ai can also recommend fixes based on its analysis. With access to your code and telemetry, it can identify where fixes are required and propose the right fix. It will even generate a pull request with specific code optimizations, so you can easily merge fixes into your code.

Getting Application Insights
Observability is more than just monitoring. It’s about understanding what’s going on with software and getting higher-level insights.
Aside from fixing issues with your app, o11y.ai can also extend to provide product and usage analytics:
“Provide insights into user behavior, traffic patterns, and feature usage. Highlight trends, peak usage times, and most/least used features.”
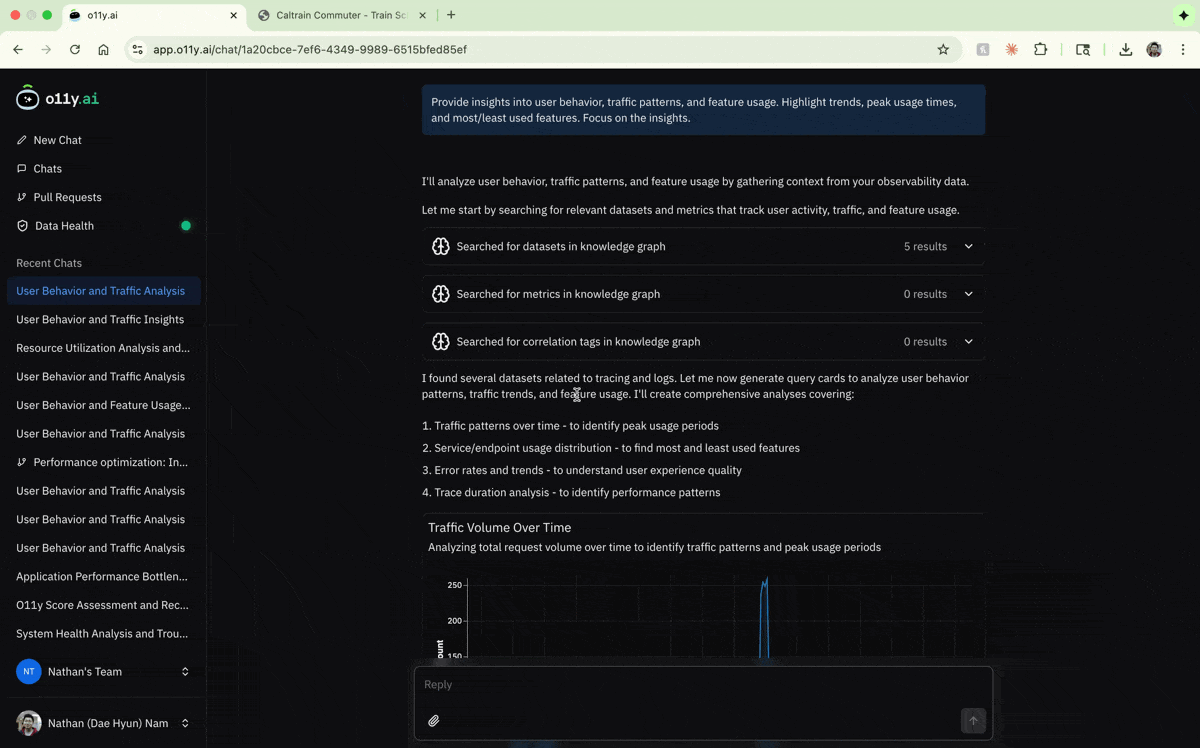
o11y.ai provides charts, tables, and key insights to help you understand patterns in your app’s traffic, usage, and performance.
Try o11y.ai with Your TypeScript App Now
With o11y.ai, observability becomes a natural part of the development workflow, not an afterthought. It gives TypeScript developers a direct feedback loop–between code, telemetry, and fixes–and broader application insights, so you can see how your app behaves and address issues before they reach production.
Head to o11y.ai to try it for yourself.
