

How AI Speeds Up Trace Analysis in Observe

When building complex applications, engineers often turn to OpenTelemetry trace data for debugging code execution paths. Interpreting trace data can be time consuming, even for experienced engineers. A simple trace may contain a dozen spans, but complex operations could be tens of thousands of spans or more. The Waterfall and Flame graph charts provide useful visual representations of trace data, however complicated traces can still be inscrutable and time consuming to interpret for problems.
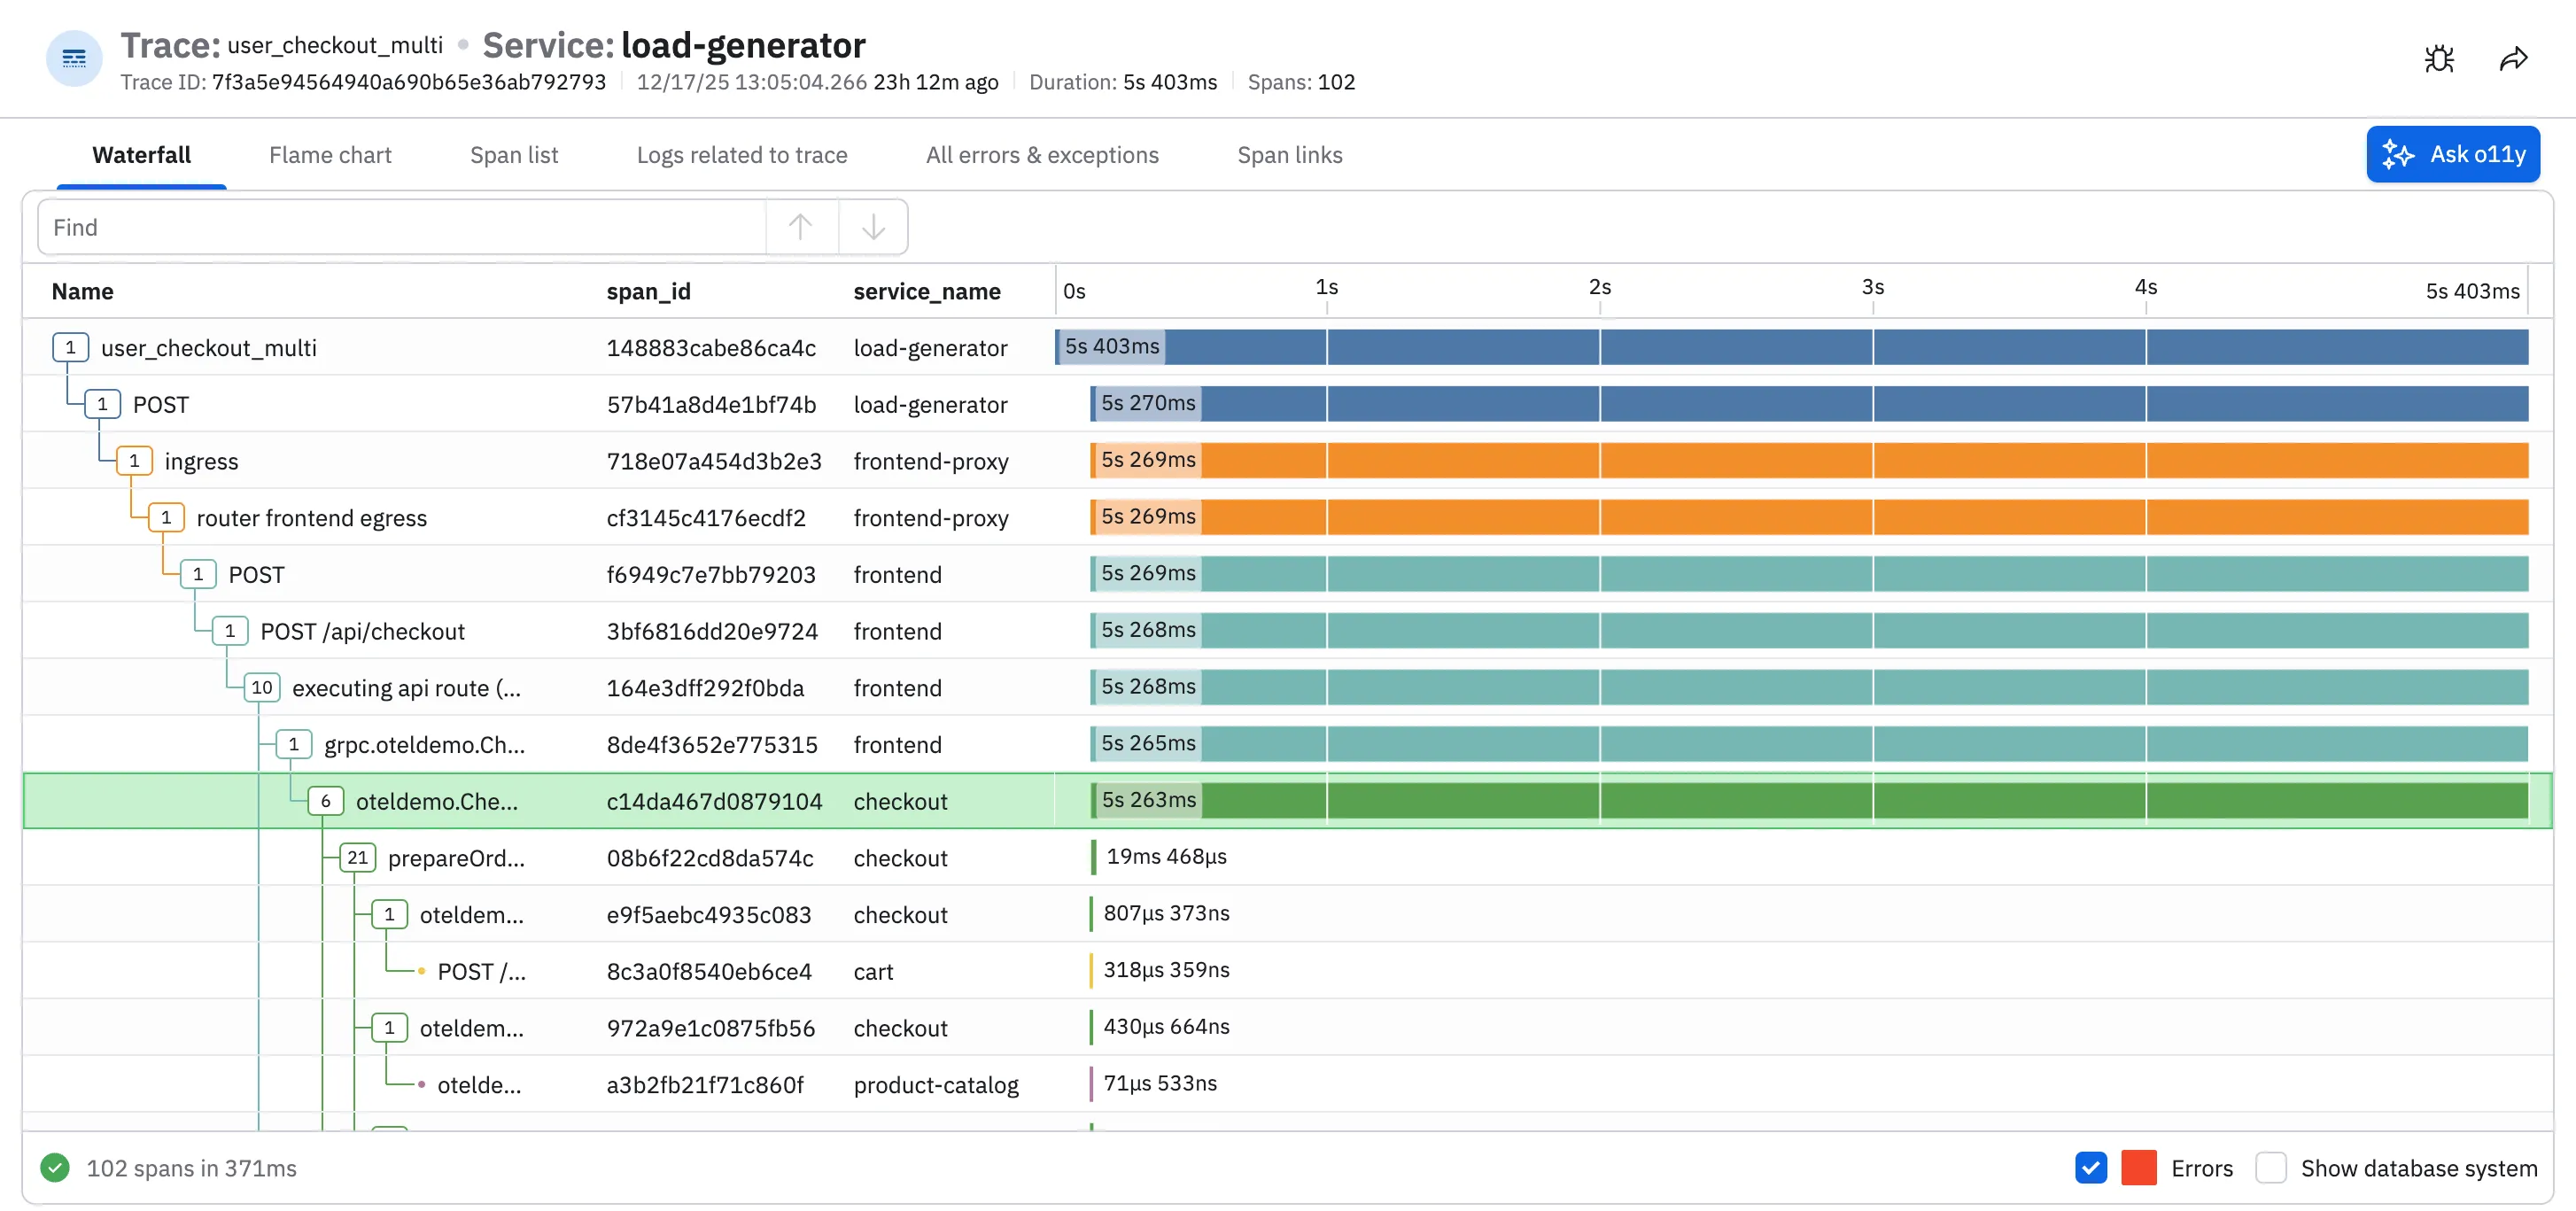
During an incident, engineers often need to debug a handful of complex traces. For each one, they must scroll through thousands of spans in the charts, manually looking for bottlenecks, N+1 query patterns, or other problems. Once identified, users will typically investigate the problematic spans more closely, looking for shared attributes or other commonalities. For a trace with thousands of spans, this could take a few minutes, and since a typical investigation usually requires analyzing multiple traces, having a way to speed this up could greatly help reduce MTTR.
With these troubles in mind, we built the o11y AI trace analysis tool – a new feature in the Trace Explorer that uses large language models (LLMs) to help debug and analyze your trace data. It was created at a recent internal hackathon at Observe, where a few APM engineers got together to see how AI could debug trace data more easily. Now built into Observe’s Trace Explorer, the “Ask o11y” button provides an easy way for AI to inspect your spans and provide insights such as critical path analysis, service relations, errors & warnings and analyze performance.
o11y trace analysis can provide remediations for common problems and recommend fixes to your instrumentation. Users can click on the span name in the AI trace analysis and quickly jump to that specific span in the Waterfall for further manual review. In the following example, we use the new trace analysis feature to look for slow downs in our cart service. o11y trace analysis identifies two separate N+1 query patterns that could be optimized. With this analysis, engineers can quickly identify the bottleneck slowing down the service, and find the queries that need adjustments.
Building this out for a hackathon was a lot of fun! Our initial implementation was slow and the interface was cumbersome – but the analysis was insightful; we knew early on we had something useful. After 24 hours we had refined the UI, adding streaming text and the ability to click spans in inspect further. The hackathon demo was well received, which motivated us to get this into actual users hands. About a month later, we were able to productionize the code and we shipped the o11y trace analysis as part our Trace Explorer.
Feedback amongst customers has been positive, particularly from teams dealing with large, complex traces during incidents. By pairing familiar trace visualizations with guided analysis, o11y trace analysis helps engineers spend less time scanning thousands of spans and more time understanding what actually went wrong. Rather than replacing existing workflows, it accelerates them – surfacing bottlenecks, highlighting common patterns, and pointing engineers to the spans that matter most. If you’re interested in debugging traces faster and reducing MTTR, try the o11y AI trace analysis in the Trace Explorer and let us know what you think.
