

What is OpenTelemetry? (And Why You Should Care)

Introduction to OpenTelemetry
The OpenTelemetry project (often known simply as OTel) has risen to prominence and become a staple in conversations related to observability. As is often the case with many hyped terms that seemingly pop up overnight, OpenTelemetry is the culmination of years of work now coming to the fore. Here we’ll dig into the factors that have led to its popularity, why it should be of interest to you, and its prospects as an enabler of observability.
Why OpenTelemetry Exists
With the advent of microservices and the rise of Kubernetes-based applications, things have gotten complex. It's important not to let complexity inhibit the benefits of cloud-native applications such as faster release velocity and application portability. This is where observability comes in as a way to maintain end-to-end visibility, and simplify troubleshooting and finding the root cause in even the most distributed systems.
Observability has evolved beyond the concept of “the three pillars,” where operations must correlate logs, metrics, traces, and the byproduct of that mindset which is usually an overabundance of tooling. What is necessary for observability is having the data to answer any relevant questions on demand and be able to get useful information from that data.
At Observe, we espouse the belief that observability is fundamentally a data problem. If all telemetry data can be brought together, curated, and – where possible – related, then it can be an order of magnitude faster to detect, investigate, and resolve issues. Will you need all of your data forever? Probably not, but you won’t always know what data you will need and when. Achieving observability so you can solve your organization’s problems requires having that data accessible in the first place. OpenTelemetry deals with that ever-present challenge of collecting telemetry data. That’s exactly why we support OpenTelemetry and have released the OTel App, to provide Observe users with an easy onroad to gather and use their tracing data.
Origins of OTel
The Ecosystem
Before we can get into what OpenTelemetry is and how it can be useful to you, it helps to understand its origins. OTel is a project within the Cloud Native Computing Foundation (CNCF). It was created in 2019 and achieved the incubating project stage of maturity in 2021. The CNCF is the steward of many high-profile open-source projects including Kubernetes.

The CNCF typically accepts new projects at the “sandbox” stage and, pending approval by the organization’s Technical Oversight Committee, they can advance to incubating and ultimately graduation. These stages are intended to signify both the maturity of the technology as well as sustainable user adoption. Prometheus (time-series metrics), Jaeger (distributed tracing), and FluentD (log forwarding and aggregation) are among the observability-centric projects that have made it to graduation. Not every CNCF project makes it to graduation and advancement is not guaranteed.
Evolution of the Project
There is sometimes overlap in the capabilities of CNCF projects. Needless to say, multiple projects meant divided effort and thus OpenTelemetry was born to build on the learnings of its predecessors and unify their respective communities. OpenTelemetry is the result of a mutually agreed-upon merger of OpenCensus and OpenTracing since both focused on distributed tracing. Both the community at large and the CNCF have attempted to create vendor-agnostic open standards for collecting and forwarding telemetry data, this includes OpenCensus, OpenMetrics, and OpenTracing.
OpenCensus offered libraries for the collection of metrics and traces, while OpenTracing offered APIs and instrumentation focused on traces. OpenMetrics was created in 2017 and bills itself as “the de-facto standard for transmitting cloud-native metrics at scale.” OpenMetrics was effectively an evolution of the Prometheus standard. OpenTracing was released in 2016, while OpenCensus was released in 2018; both projects bear some ties to Google’s distributed tracing system Dapper.
Based on the roots in OpenCensus and OpenTracing, both projects – and in turn OpenTelemetry – were geared toward tracing data with some metrics capabilities via OpenCensus. This allowed for continued usage and development of OpenMetrics as the project had more time to mature and gain adoption. At the time of writing, both OpenTelemetry and OpenMetrics continue to coexist. However, depending on who you ask, there is an expectation that OpenTelemetry will become a de facto standard for metrics and for traces – which would make OpenMetrics redundant.
Arguably, projects such as Prometheus and FluentD can be considered de facto open standards in their own right, but OpenTelemetry aims to be a catch-all option for multiple data types – effectively superseding the need for a pipeline that would involve three different collectors. For example, one might deploy FleuntBit for Logs, Jaeger or Zipkin for traces, and OpenMetrics for metrics, with each going to a relevant backend such as Prometheus, a logging platform of choice, etc. Alternatively, OpenTelemetry can collect all three telemetry types before exporting to the backend of choice (which could still be Prometheus or Jaeger) for one or more data types.
What’s Under the Hood
So what does it do and how does it do it? OpenTelemetry is not a single “thing” but rather several pieces working together. The stock definition is that OpenTelemetry is a framework for creating and managing telemetry data such as traces, metrics, and logs. It has several components, including OpenTelemetry APIs and SDKs for instrumenting your application and a vendor-agnostic collector with the OpenTelemetry protocol (OTLP). OTel still depends on the various backends (Prometheus, Jaeger, something vendor-specific, etc.), so while it aims to be a fairly complete framework for data collection, it is not a storage, analytics, or observability platform.
The project is also designed to be extensible so that it can be built upon to fit the specific needs of both open-source users and vendors that want to commercialize tools that leverage it (more on whether this is good or bad later).
Instrumentation
As you might expect, to start collecting data you’ve first got to do some code instrumentation. OpenTelemetry supports both automatic and manual instrumentation. In either situation, the user will use dependencies that will add the API and SDK. The OpenTelemetry SDKs are libraries that implement the OTel API, which is used to dictate how a chosen data source will generate telemetry. There are language-specific implementations for C++, Go, Java, Python, Ruby, Rust, and others. However, not all of these languages have automatic instrumentation. There is auto instrumentation for programming languages such as Ruby, Python, Java, and .NET but not for others such as Go.
On a per-language basis, tracing, metrics, and logging are at various stages ranging from “not yet implemented” to “stable” with various stages in between. Suffice it to say, components related to different telemetry types are at different maturity levels for any given language-specific implementation of OpenTelemetry.
The Collector
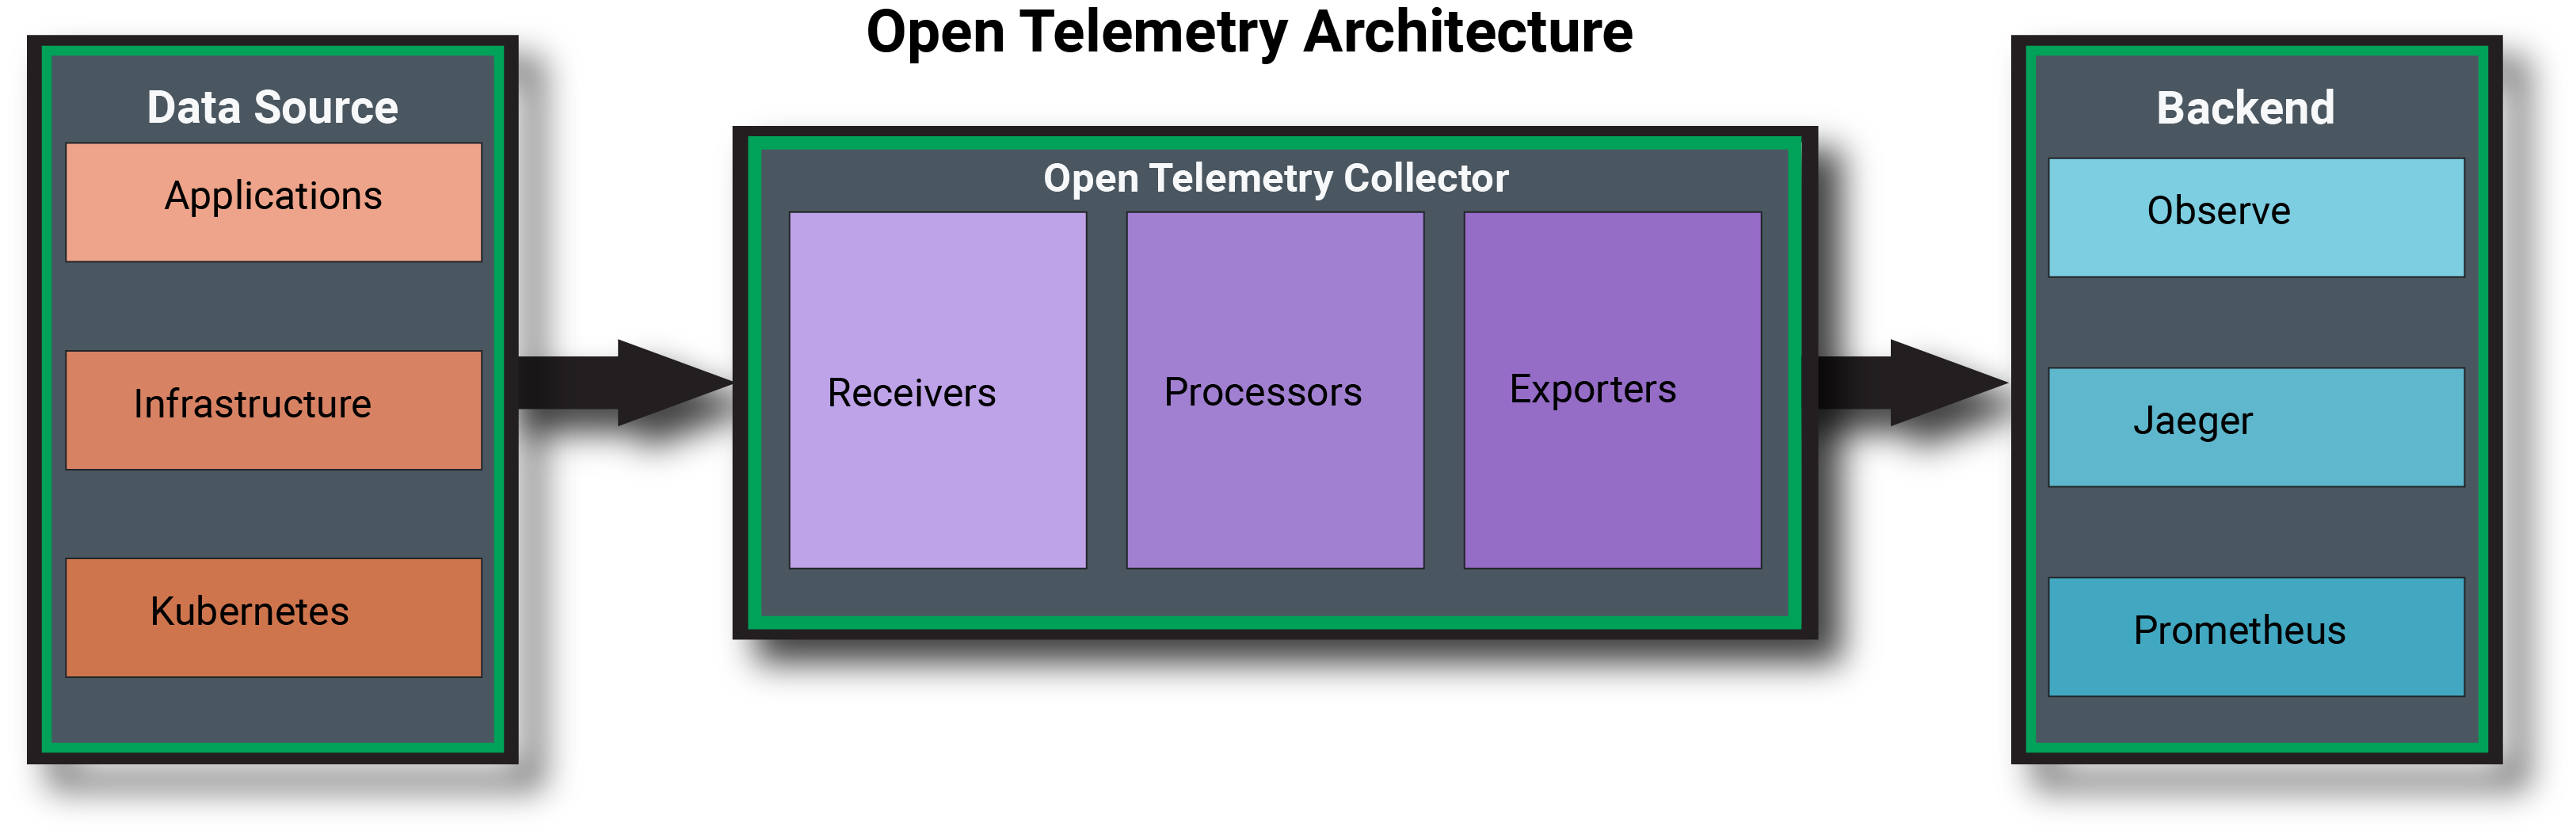
The OpenTelemetry collector is essentially a vendor-agnostic way to receive, process, and export telemetry data. The collector is a binary that can be deployed in two ways: as an agent or as a gateway (and potentially a combination of the two depending on the use case). The agent is deployed alongside an application or on a per-host basis, while the gateway is a standalone application and could be used to aggregate data from multiple agents. The collector is made up of three core pieces: receivers, processors, and exporters. It can also include optional extensions to add specific capabilities.
- Receivers: Receivers can be push- or pull-oriented and support one or more data sources.
- Processors: After data is received, processors can modify data as needed before exporting. This can include filtering, sampling, batching, etc.
- Exporters: Lastly the exporter sends data to its destination, such as the end-user’s preferred backend. If a tool does need data to be in a specific format, the collector could be used to apply the necessary transformation.
Whether deployed as an agent or a gateway, the collector receives the data and performs any necessary or desired modifications before it is passed on to its final destination. It is just one part of the observability data pipeline between the data sources and the eventual data destination.
Why OpenTelemetry Matters
OpenTelemetry accomplishes (or hopes to accomplish) a few key goals:
- Standardize data collection and telemetry protocols by providing a single set of tools for collecting telemetry.
- Make observability more ubiquitous by making telemetry data more easily available.
- Make telemetry vendor-neutral and help users avoid being locked into proprietary agents.
These goals are not to be understated. We know how essential observability and telemetry data are to organizations, but for OTel to accomplish these goals it will have to achieve that coveted de facto standard status. Adoption will require buy-in and contribution from both users and the industry at large.
Why It Matters For Users
Industry standards are accepted practices or technical specifications implemented either by consensus or, in the case of a de facto standard, adoption reaching critical mass. Standardization, when possible, can be a boon for users. We’ve already seen it happen in the CNCF and Kubernetes ecosystem with de facto standards such as the Container Network Interface (CNI) and Container Storage Interface (CSI). Another example of a de facto standard would be the AWS S3 API, which – although originating from a vendor – has also become ubiquitous. We can learn from these experiences as we chart the potential trajectory of OTel.
CSI, for example, is a standard for exposing block and file storage types to Kubernetes-based apps. When it came to Kubernetes storage and data persistence, life got a lot simpler once CSI was introduced and accepted. It set expectations for users that there was a single interface that was developed once and could be used widely. OTel’s goal is not so different, though accomplishing that goal is quite different in the world of telemetry than it is in storage.
By providing a standard that is easily instrumented and implemented, we can potentially democratize data collection. This would make it easier for more personnel in an organization to improve visibility across an organization’s applications and infrastructure and facilitate observability. Observability can be a team sport with engineering, DevOps, and SRE teams benefitting from a common means to instrument for data collection.
What Does The Future Hold?
Challenges
One might wonder, “Is OpenTelemetry the future of instrumentation and collection of machine data?” The answer is a resounding “maybe.” It's clear that organizations want to protect themselves from vendor lock-in via proprietary agents while also simplifying the instrumentation process for all kinds of telemetry. For now, and in the immediate future, OpenTelemetry is a work in progress.
The project's focus has predominantly been on tracing and there is still work to be done on the metrics and logging front. The messaging from some contributors might lead users to believe that OpenTelemetry is a fully matured technology, but support for logs, metrics, and traces are all at varying levels of development. Users may feel comfortable using it for traces, but some will inevitably hang on to OpenMetrics while they wait for metric maturity to catch up. Progress on logs is further out, with logging in language-specific implementations often in the roadmap or experimental stage (behind where OTel is with tracing or metrics in the same implementations). Nonetheless, the project has moved quickly from sandbox to incubation within the CNCF and a considerable number of vendors have gotten on board and contributed to the project.
However, vendor involvement has pros and cons. OpenTelemetry is designed to be extensible and allow for custom components such as extensions. While this extensibility is important to ensure the project meets the specific user needs, there is also a potential downside to the tolerance for custom components and distributions. It's quite possible that OTel distros may creep toward imposing some degree of vendor lock-in by prioritizing vendor-specific functionality or impacting upstream compatibility. This would be counterproductive to the goals of the project and users are encouraged to be wary of distributions that might result in lock-in.
To put it simply, more easily obtained data for observability is good, but not if it comes at the expense of vendor lock-in (especially if that ecosystem is built on a “three-pillars” approach to observability).
Cause for Optimism
Challenges aside, the rate of development and early adoption of OpenTelemetry is cause for optimism. Open-source software already plays a major role in observability via the likes of open-source tools Prometheus, Jaeger, FluentD, and others. Time will tell whether OpenTelemetry ultimately lives up to the hype and the aspirations of the community, but the importance of open data collection methods is well established. Data collected by OTel will naturally be welcome (along with other open-source and widely used collection methods) in observability tools like Observe.
Being able to solve for unknown unknowns and query your data to get meaningful answers is the core of observability. To ensure that you are getting the best answers and information, the ability to collect data is essential. However, you won’t always know out of the gates how much data you need or for how long you will need it. Unless you’re using a service that makes it cost-prohibitive to ingest as much data as possible, the more data you can take in the better. OTel has the potential to simplify the instrumentation needed for data collection and provide users a way to more easily get more data into their observability services, and that’s a good thing.
