Using Log Analytics to Drive Observability

Introduction

Logs, metrics, traces. All of these events are different kinds of machine data that can help you monitor and observe your system. Logs in particular are useful for finding out what happened and the root cause. Metrics and traces can tell you effects and alert you proactively, but you’re going to need to roll up your sleeves and dive into logs (or traces if you have them) to ascertain the root cause.

When a system grows in complexity beyond a single component it becomes difficult to correlate data. Imagine trying to SSH into 300 servers and grep logs from your laptop. Or In the world of Kubernetes, running the “kubectl” command gets unruly when you have a thousand containers spread across different clusters. When you find yourself facing this level of complexity, it’s time to put those logs into a log analytics tool. The data in logs is indispensable. But accessing that data is increasingly difficult, even with a log analytics tool. And while there is a litany of open source and commercial tools that allow users to store, search, and analyze logs, the biggest challenge that SREs face today with logs is a lack of context.

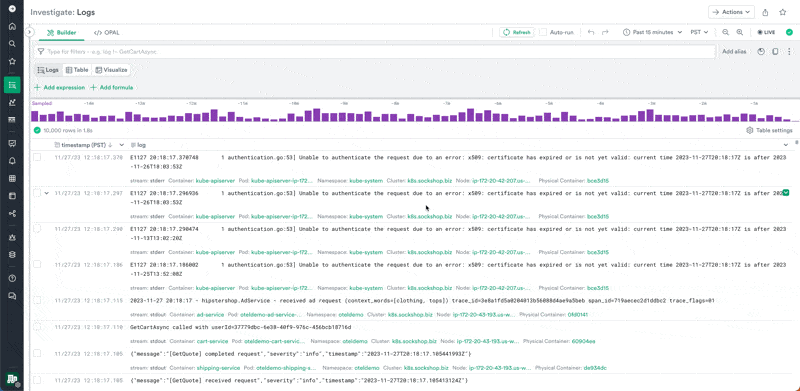
In the last decade, most log analytics tools have scantily evolved beyond a glorified CLI (Command Line Interface). They throw a user into a blank search bar and wish them good luck. This approach worked fine when servers were named after planets and lived in the basement. In today’s world of cloud computing, microservices, and containers, the CLI approach has not aged well.

To make sense of logs and tie them back to the “things” (containers, servers, users, services, etc.) they came from, a labeling system is often used. Tools differ on what they call this. Some call it labeling, while others refer to it as tagging. Irrespective of the term, it usually involves adding “search terms” to log events. For example, a log from a container might be tagged with “container-id:1abv333.”

There are many problems with this approach. In today’s world of microservices and containers, you have many short-lived resources. The issue with short-lived resources is that they will explode the number of tags that you need, turning them into “tag soup.” More tags also mean an increase in the resources required to correlate data, leading to a greater operational cost.

Tags also need to line up. If “container-id” is called “container_id” in another log event the system won’t sync. All of the questions that you want to ask of the system need to be answered when a given log was emitted. In many cases, this is simply not possible. If I wanted to know the server that a container ran on, I would need to add that to the log. The same goes for the commit-id of the code committed. What about the dependent job? What about metrics? This goes on ad nauseam every time you think of a new question that you want to ask.

Is there a better way than tagging all of your data? You could use a relational data model to structure the data. Commercial data warehouse technologies like Google BigQuery and Snowflake can support massive data volumes and semi-structured data. It may sound like an oxymoron, but using age-old primary-foreign key relationships will let you relate all of your data together, as long as your data warehouse can support massive joins. This simply wasn’t possible with the last generation of commercial data warehousing technologies. Old databases required expensive high-performance storage that had to scale with compute. This means you had to provision resources for peak usage even if you weren’t taking advantage of your resources 90% of the time. The cloud allows software to take advantage of cheap storage and elastic compute. This means well-designed applications can scale-out accordingly and pass on savings and performance proportionately.

Structuring the data is half the battle, you need to make the system usable by even the most junior engineer. When a senior SRE is troubleshooting they are leveraging a lot of institutional knowledge to piece together data. You can think of this as a human-join instead of a software-join.

There are a few things you need to make machine data accessible to anyone. You will need a friendly user interface that doesn’t require a user to learn a new query language for basic tasks, a way to easily manipulate the data without writing massive SQL statements for ad hoc investigations, and a way to process data as it streams in. Since this data is often messy, you’re going to want the ability to modify the data after it’s been ingested. Some tools call this schema-on-demand or schema-at-read. Data warehouses are optimized for long-running analytical queries, so some elbow grease is required to make them interactive. Once you have those things in place, you will need a way to structure the data temporally. This will allow you to keep track of the state and relationships of ephemeral “things.” This is the most important piece. It will allow you to investigate issues significantly more quickly by leveraging context.


Let’s take a look at an example of a real issue we had at Observe. We got an alert that a server was running at 80% memory utilization. This was an outlier because most machines performing similar workloads were pegged at 5%. Using Observe, we found a log line with the suspect error message. From that log line, we joined in the class and size of the machine. Immediately, we saw that the machine was a different size than its peers due to a misconfiguration. Without the ability to quickly join data together, we would’ve needed to log into various consoles to piece together exactly what happened. You can easily imagine how this concept can be extended to other use cases. It’s possible to keep layering these joins on top of each other. You might want to go from a log line to the commit of the container image it ran on. This would be a series of joins.


If you put all of these pieces together, you will get closer to building an observable system. Observability is all about figuring out what’s going on inside of a system from its digital exhaust. It’s not a binary thing that you can or cannot do, rather it’s a practice.

How does log analytics relate to observability? Log analytics is a way to get closer to understanding what’s going on inside of a system, but only if they have context. Even then they are just one piece of the puzzle. You’re going to want other data sources that give you this insight. An observability tool shouldn’t even care what kind of data source you are bringing in. It should ingest any kind of data that gives you this insight and link it together with context. Context can be things like logs, metrics, and traces, but also business data, support tickets, even code changes.

The tool should be able to answer any arbitrary question. There’s more change going into production than ever before. This means you need to be able to account for unknown unknowns. If you can only answer pre-canned questions you knew to ask yesterday, you’re going to have a hard time figuring out tomorrow’s issue.

Build vs. Buy

We’ve established that tag-based approaches to observability don’t work. This rules out common open source solutions like the ELK (Elasticsearch, Logstash, Kibana) stack. Your best option is to take advantage of a commercial data warehouse that can handle semi-structured data and massive joins. What does this approach look like- regardless of whether you’re going to build or buy?

When deciding to build or buy an observability tool, there are a few important things to consider:

Lego Blocks

  • Data Warehouse – You will need to pick a commercially available data warehouse like AWS Redshift, Google BigQuery, or Snowflake.
  • Stream Processing – You definitely don’t want to drop data on the floor, so you will need to put some sort of queue in front of the data warehouse. This will also be useful for routing data to other backends and low-latency tailing of data. Common technologies including AWS Kinesis, Kafka, and Cribl LogStream.
  • Schema-on-demand – Machine data is messy. Log formats change frequently and events come in out of order. You’re going to need a way to reprocess this data to deal with this so your historical data doesn’t go to waste.
  • Temporal Relational System – To make sense of this data, you’re going to need to build a system that can transform raw event data into temporal relational interval tables. This way you can efficiently introspect on the state of a resource at any time in its history.
  • User Interface – To make the data accessible to even the most junior SRE, you’re going to need an easy-to-use interface for the data. It would be impractical to use a traditional data warehouse UI like Tableau and Qlikview for machine data. Those tools have poor facilities for manipulating raw events like logs. With some work, you could use Elastic, Kibana, and Grafana together. However, note that there are no open-source UIs that can take advantage of the context that you will need to build in the data warehouse. Your best bet is to create a bespoke tool.

Skill Sets

  • Experience with running and maintaining a stream processing platform, data warehouse, and UI development.
  • Deep knowledge of SQL, specifically window and time functions.
  • Security and compliance

With Observe you get all of this out of the box. Observe is a SaaS observability product that enables SRE and DevOps teams to investigate modern distributed applications. Our design point was an order of magnitude faster than incumbent offerings. It’s built on top of the industry-leading Snowflake Cloud Data Platform. At the core of Observe is a streaming data transformation engine. Observe ingests anything with a timestamp – logs, metrics, traces – and then structures that data to provide unique insights such as inventories of containers, pods, EC2 instances, S3 buckets, etc. as well as the relationships between them. This enables engineers to troubleshoot issues top-down instead of immediately diving into logs and searching. Observe also keeps track of the state of the application and infrastructure over time, which is critical for investigating today’s modern ephemeral systems. Finally, because of Observe’s unique architecture, it is priced based on usage, making it 10x lower cost than incumbent offerings.

The single most important thing Observe does is shape data into “things” that you can ask questions about. Using a stream of machine data Observe creates “things,” or Resources, out of your data and is then able to track the state of those Resources over time, as well as their relationships. From these Resources, we automatically generate dashboards that link together called Resource Landing Pages (RLPs). The very same data that underlies that RLP’s can be directly manipulated. This helps answer the unknown unknowns. When an engineer needs to go to this level, we provide an interface called a worksheet which is like an infinite spreadsheet for your data.

There are a few other key features that make this possible:

  • Ingest all of the data – Observe ingests pretty much anything with a timestamp. You don’t have to worry if an event is a trace, log, metric, event, or even business object. To Observe, it’s all the same.
  • Schema on-demand – Did you forget to structure your logs the right way? That’s ok because Observe can shape data as it comes in as well as after.
  • Usage-Based Pricing – We make it incredibly cost-efficient to store data in Observe. You will effectively pay the S3 storage cost of that data. We will only charge when you use the data.
  • Infinite Retention – Because of our usage-based pricing and separation of storage and compute, you can retain data for as long as you want. This is very important for compliance, audit, and security use cases.

To download a pdf version of this post, please click here.