
Why Observe - Part 2: The Concepts

In Part 1, I wrote about some of the beliefs and ideas we held when we founded Observe. In this part, we are going to dive into one of the abstractions that emerged when we tested our beliefs against reality, namely Resources.
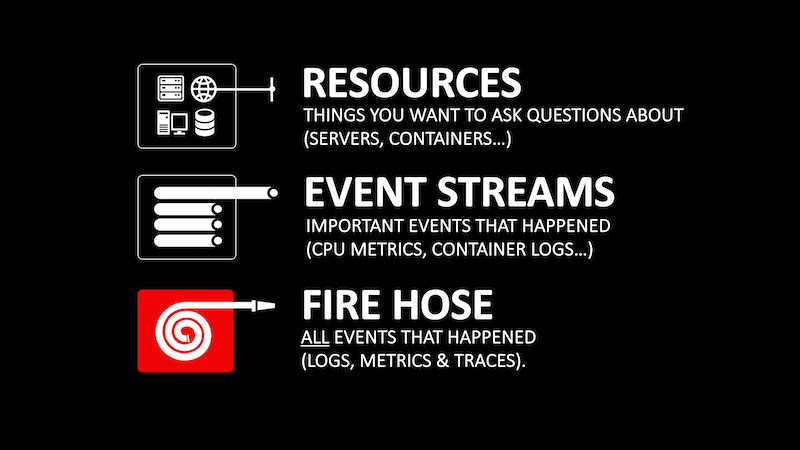
In essence, Resources are the “things” that Observe knows about. These are the Servers, Users, Requests, and so on that form the basis for the opinionated troubleshooting and analytics workflow you interact with in the Observe user interface. Resources can also be the target of a “link” from another Resource or another stream of machine data, and in doing so they form the basis of how Observe organizes a giant warehouse of machine data into an interconnected graph of data that can be easily navigated and contextualized.
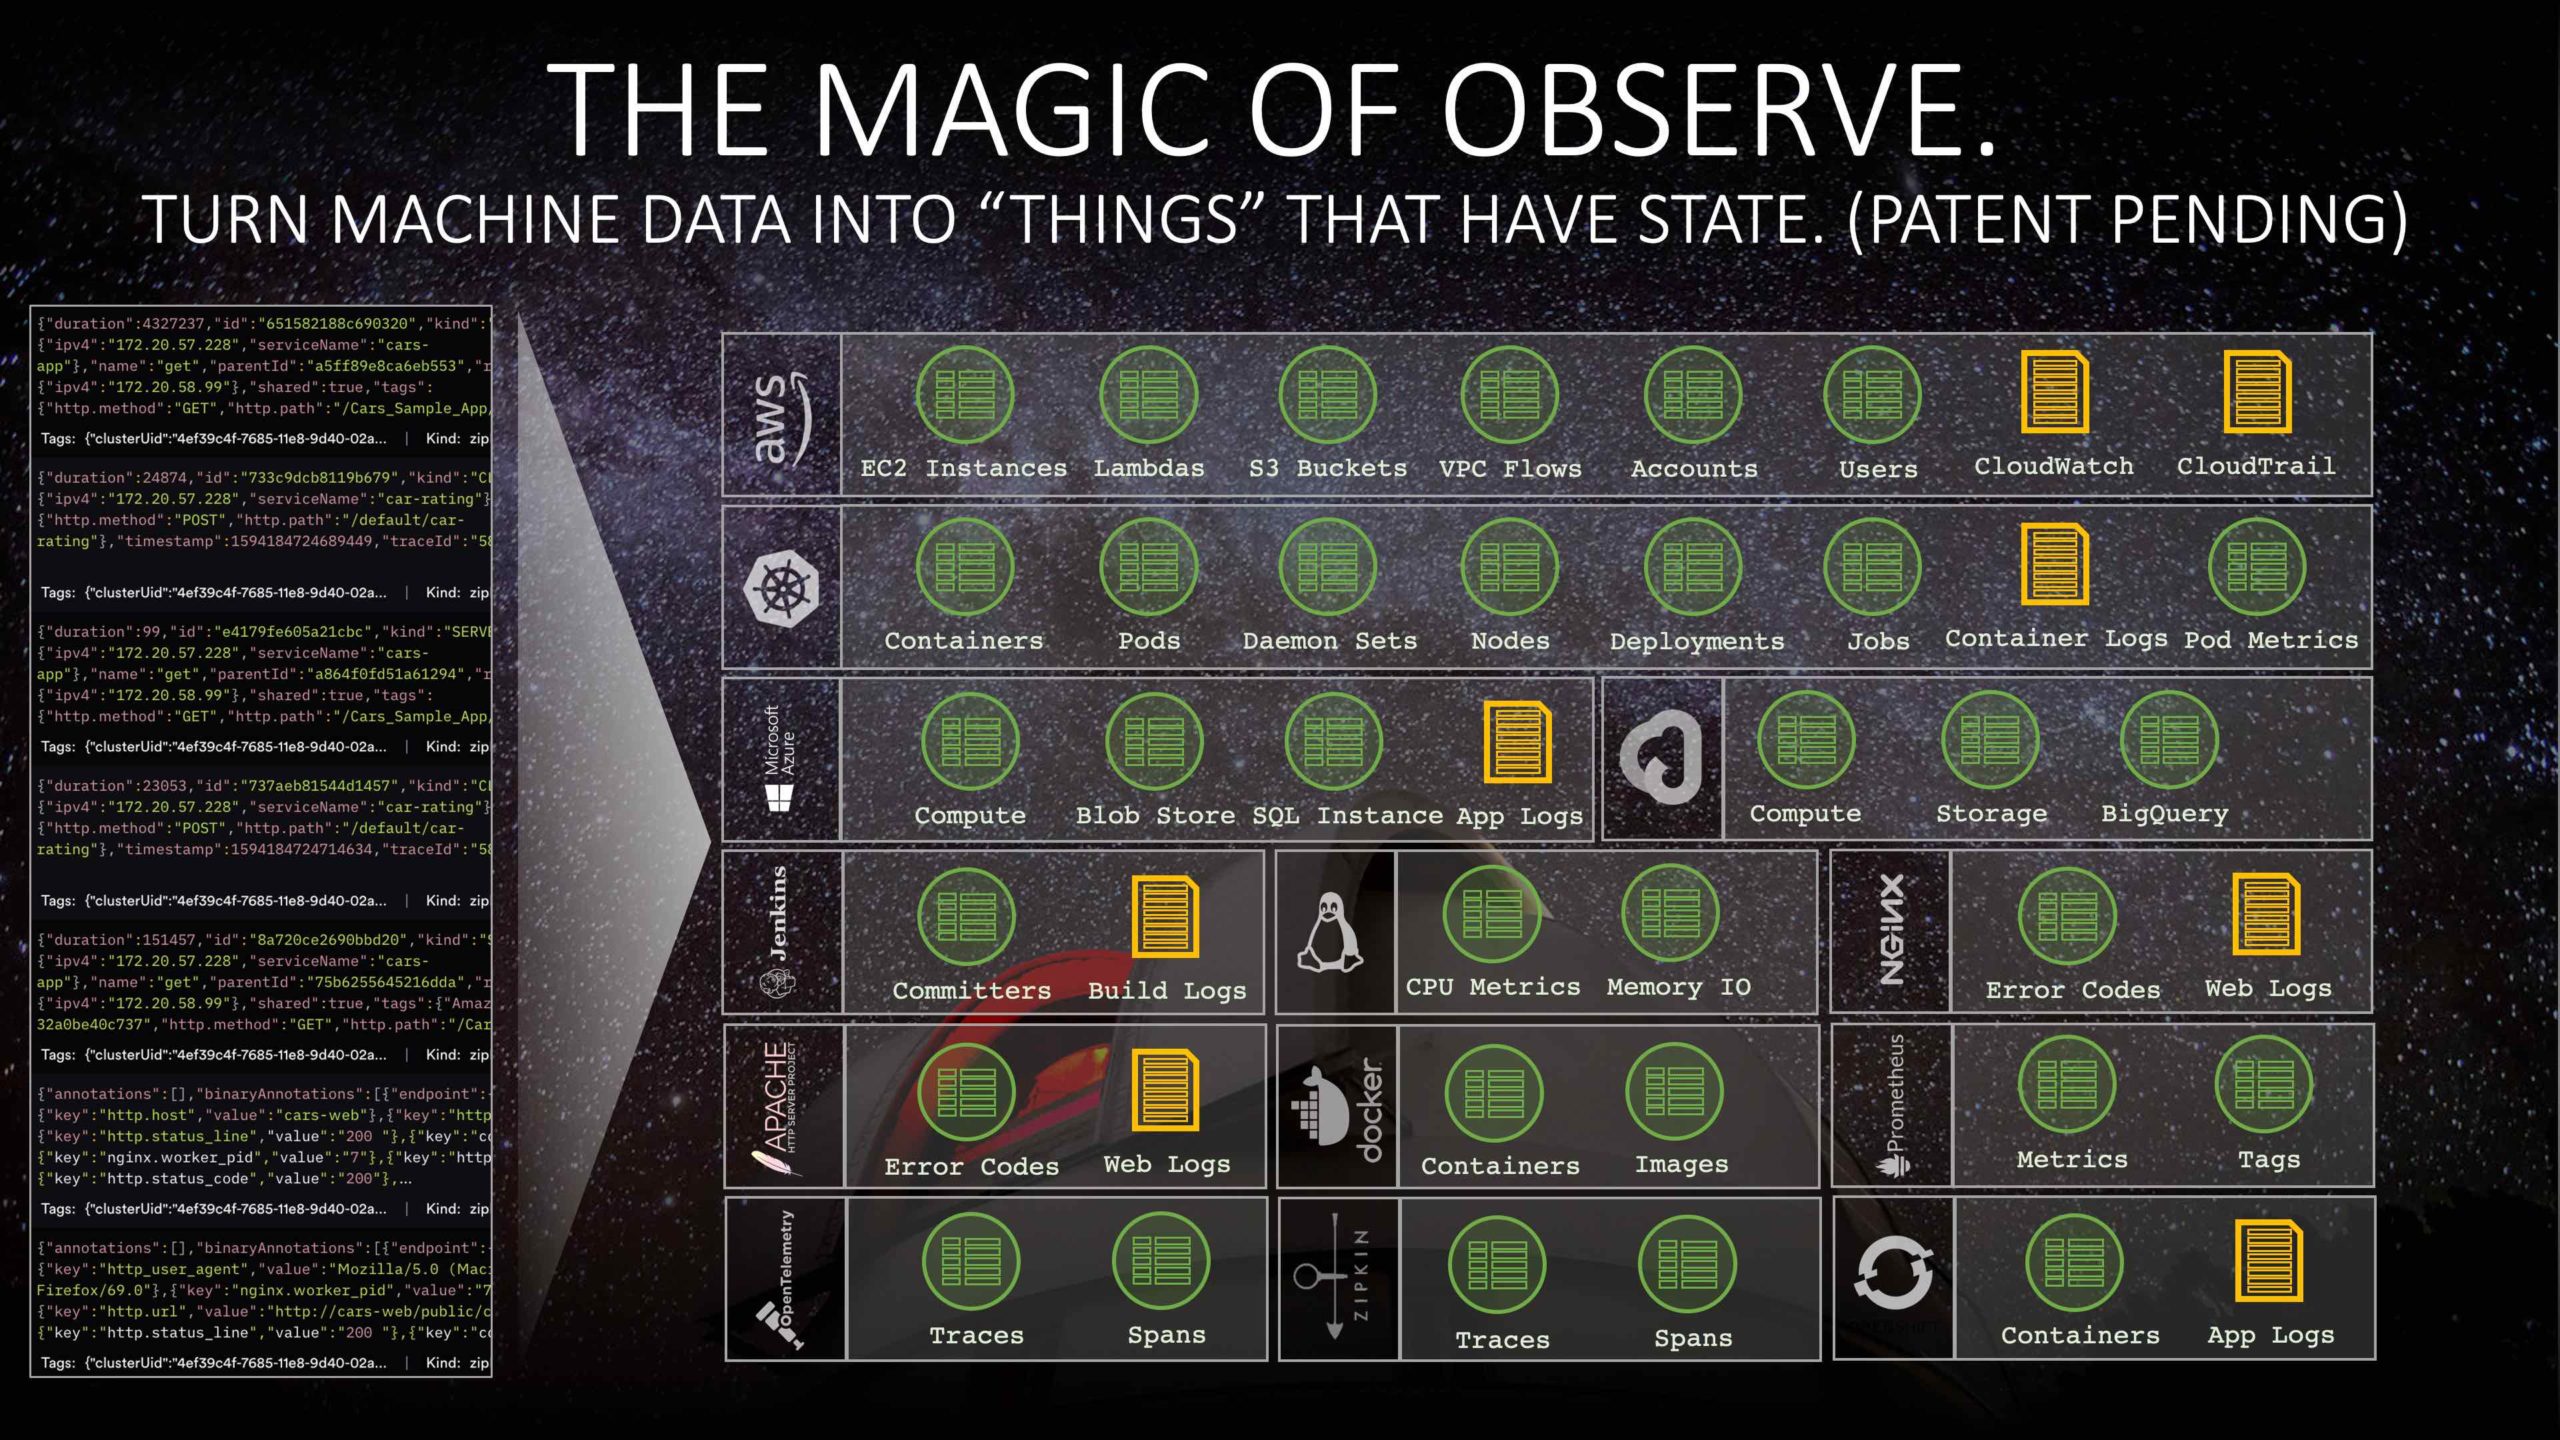
Crucially, Resources are first-class objects that can be defined, customized, and extended by end users. For example, the same Resource abstraction that we use to organize our turn-key Kubernetes troubleshooting solution around Clusters, Deployments, Pods, Container Logs, etc., can also be used to represent Users, Orders, and Campaigns in an e-commerce application. By defining new Resources, a user of Observe can register an opinion about the “things” in an environment that are important to monitor and troubleshoot.
We, in turn, infuse the user experience to take advantage of these Resources wherever possible, like providing workflows to compare Resources against one another (like the health of Service A compared to Service B), or retrieve Events that mention some Resources (like the Log messages pertaining to a particular User). In short, our Resource abstraction allows us to provide the sort of opinionated experience you expect from a purpose-built troubleshooting and monitoring tool, while leaving the experience open-ended and customizable to match precisely what a user might care most about.
Beyond just registering “things” of interest as Resources, we also track their state over time. So not only do we have a complete inventory of objects in a user’s environment (like Deployments, Users, Orders, etc.), we also keep track of important attributes about them that change over time (such as which software image a Deployment is configured to rollout). When troubleshooting, this allows you to do powerful things, like introspect on the state of the environment at the precise time of an incident, or the precise time someone reported an error.
One of the keys to providing these capabilities is that we do it by deriving Resources from the raw machine data we collect: that is, we take the raw logs, metrics, traces and other timestamped events that tell us what is going on in the environment, and we “lift” them into a higher-level representation for Resources. More concretely, we transform the raw “point-in-time” machine data we collect from an environment into interval tables, where each record has two timestamps that form a validity interval over which a Resource had a specific state. This process is based on sound principles and building blocks that originate from relational data warehousing and stream processing of event data.
While this may seem idiosyncratic, there end up being two major implications to representing Resources as interval tables. First, this representation admits a variety of efficient strategies for correlating (i.e. joining) all the Event data we manage with the time-varying state of a Resource.
For instance, if I have a message that indicates that a Server is under memory pressure, and I have a Server Resource where one of the state attributes we track is “current memory consumption”, I can join these two datasets and end up with a result where I can inspect the memory consumption at the exact moment that log message was emitted. This generic capacity to join against the time-varying state of Resources allows us to easily and efficiently perform a number of useful analytics, like dereferencing a DHCP-assigned IP address into a concrete MAC address, or get the set of Pods currently serving traffic for a Kubernetes Service by way of their associated Endpoint objects, or lookup the current “Trial” status of a User.
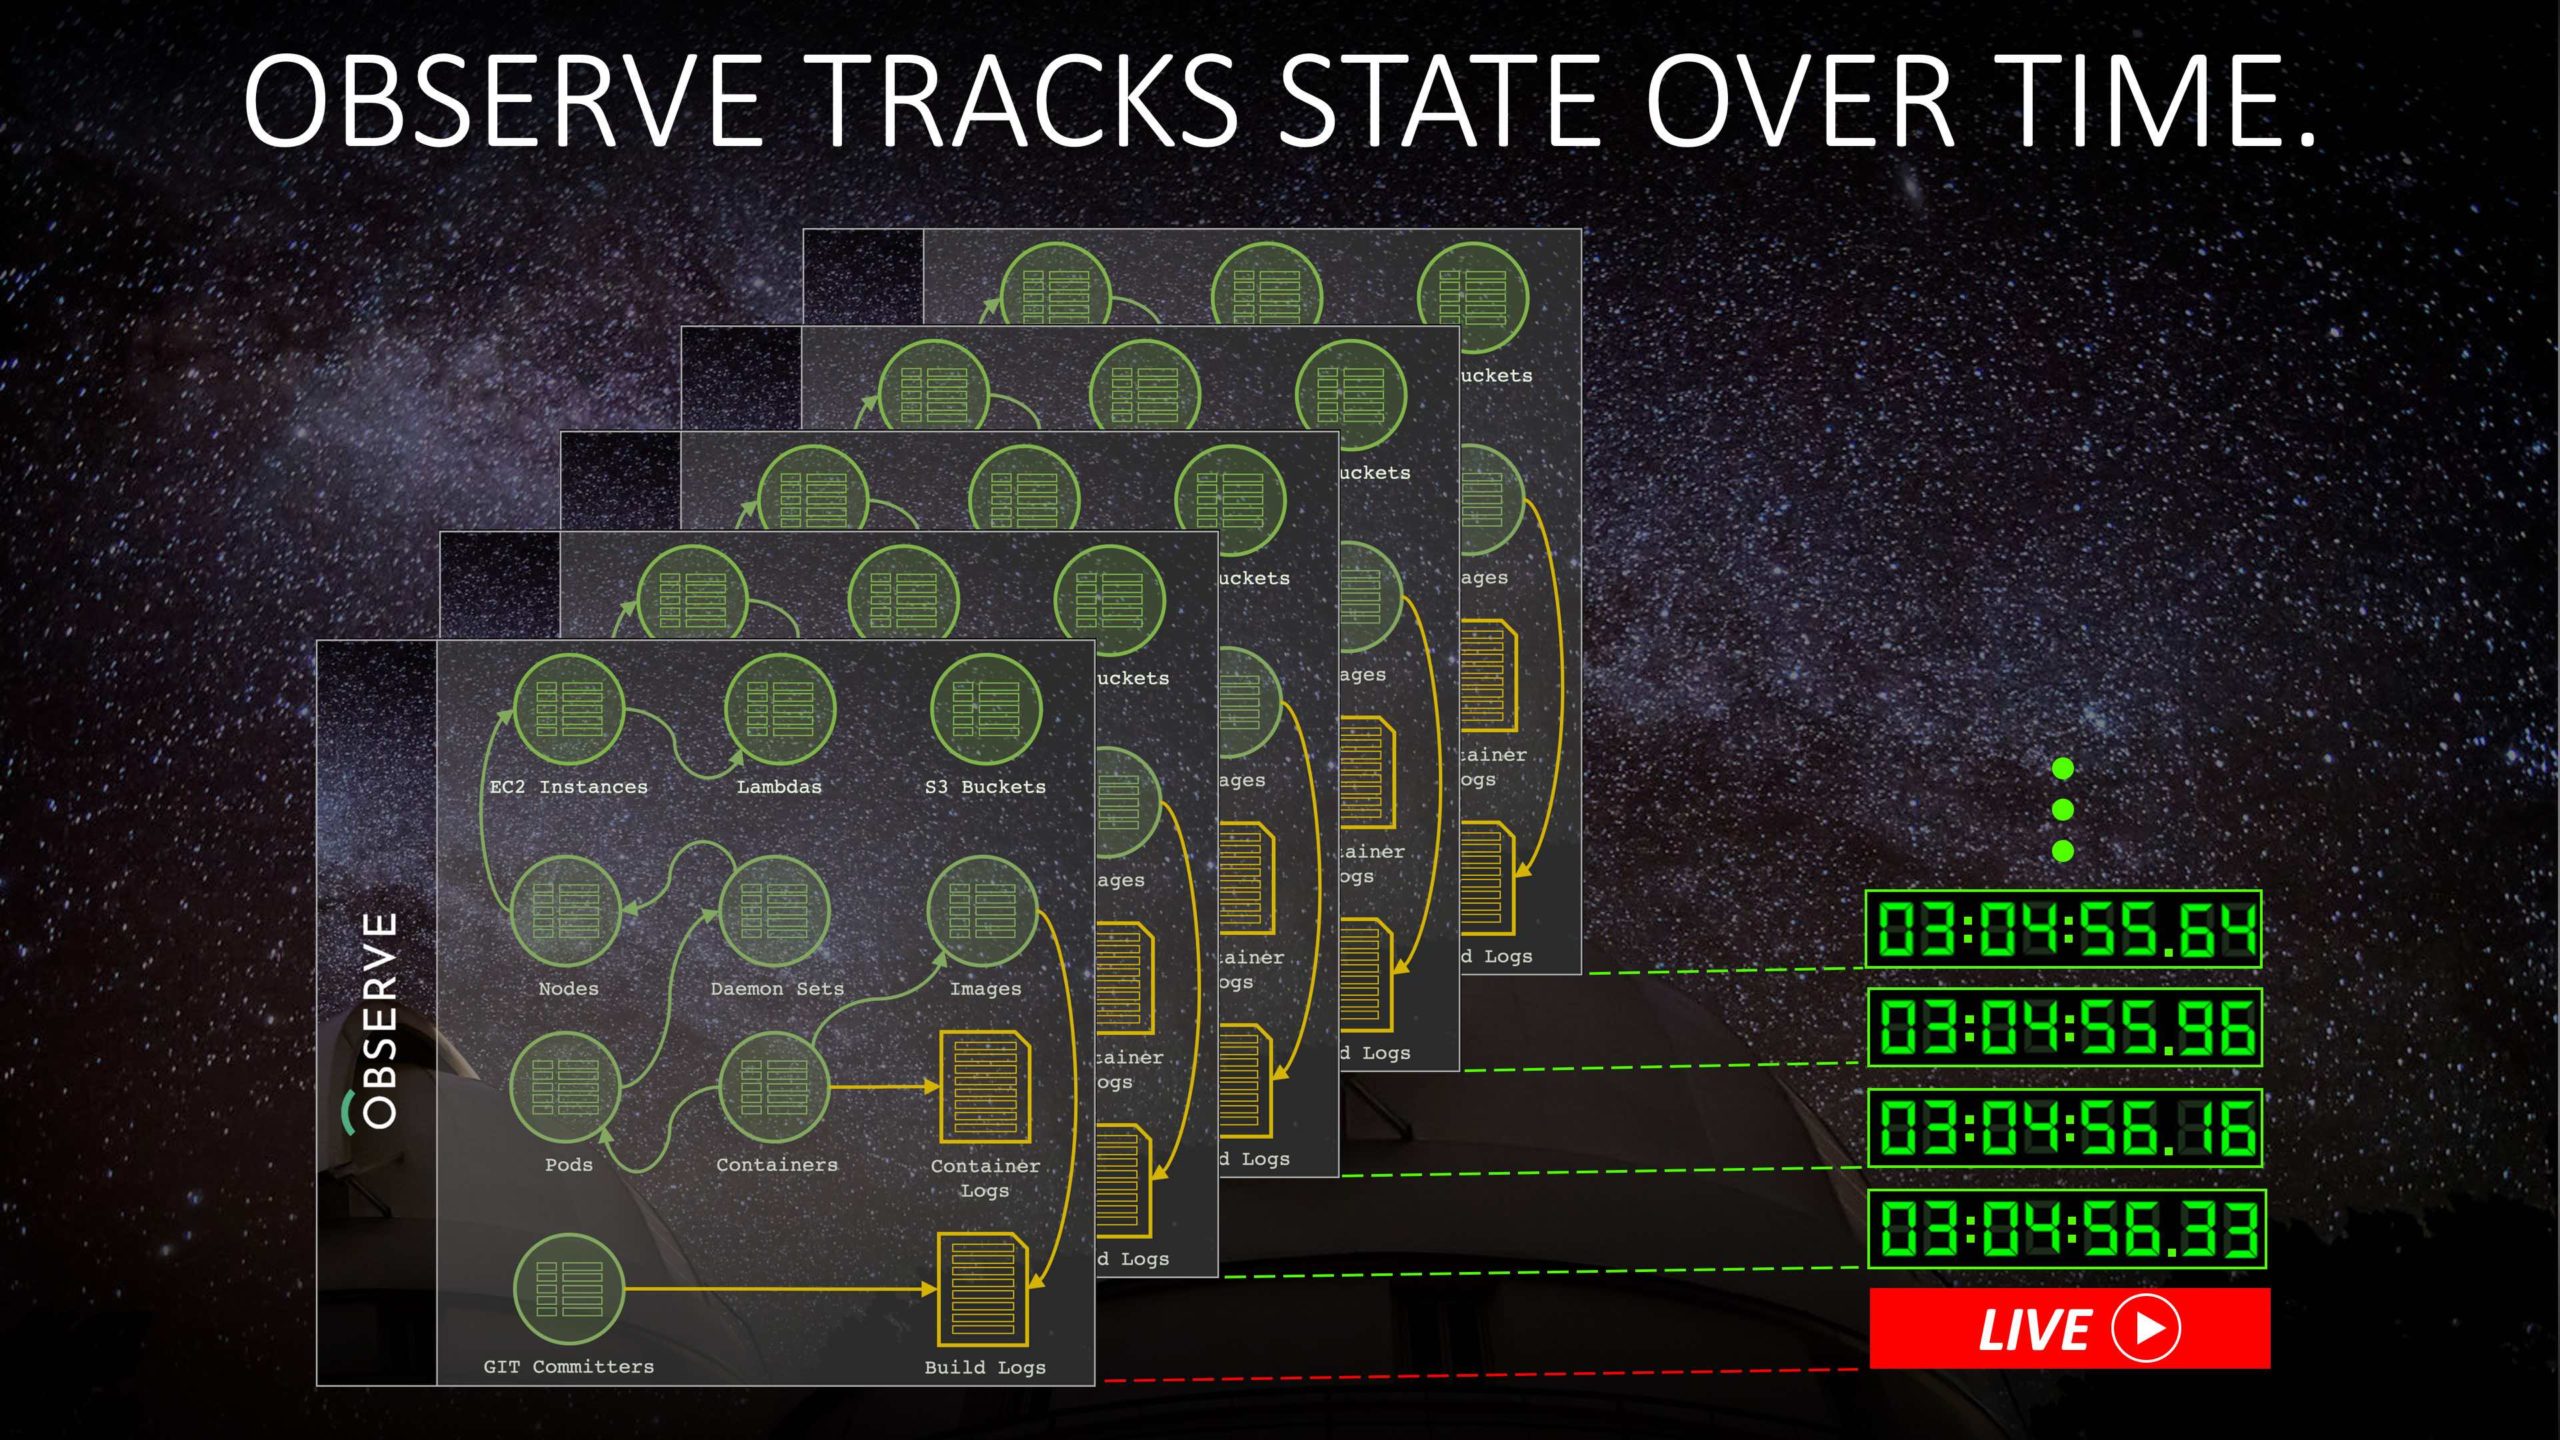
The second major implication of our representation for Resources is that since they are just relational tables, we can store and query them much the same way we do for the tables that store other high-volume machine data (like logs and metrics). Because we’ve organized the platform to cope with tables that hold billions of records, we are then comfortable tracking the state of billions of distinct Resource instances. Looking up the state of a resource at a particular time simply boils down to retrieving the record with an interval that overlaps that point in time. We even go so far as to represent “spans” from distributed traces as distinct Resource instances, and could see doing the same with the entire IPv4 address space. That means that no matter how many servers or microservices we’re tracking in an environment, or even how many users or clients are accessing a service, we can track them with full fidelity.
Stepping back a little, it’s safe to say that our definition of “Observability” has always been closer to the traditional Control Theory definition of “Observability”, which is “a measure of how well internal states of a system can be inferred from knowledge of its external outputs”. Incorporating a first-class representation for this time-varying state of Resources into the foundation of the Observe platform is a manifestation of that belief, and we hold ourselves accountable to this slightly broader vision than simply bringing together the “three pillars” of logs, metrics, and traces. Moreover, we bring that vision to bear in the UI we present to users, where we organize the experience and workflow around directly asking questions about meaningful Resources like Users and Services, as opposed to asking questions about low-level Logs and Metrics.
Recall that I mentioned earlier that Resources could be “linked” to from other Resources or other streams of machine data, and that these links formed an interconnected graph of data that can be navigated and correlated. A key property of this capability is that these “links” can be registered at any time, including well after the original raw data has been collected. All that is needed is some fleeting morsel of machine data (e.g. a log message from a DHCP server that mentions an IP address and MAC address in the same breath), and we can use that as the basis for a time-varying association between Resources.
The upshot is that you don’t need to know what these relationships are ahead of time, or go out of your way to bake them into your raw telemetry. So long as you have a small trail of breadcrumbs to follow, you can establish these associations organically after the fact. It doesn’t require that you “tag” your data up-front when you collect it in order to ask questions about “Users” or “Applications” or “Teams”, it doesn’t require you to collect all of your data with the same agent, and it doesn’t require you to embark on a big-bang “re-instrumentation” project in order to get any value.
All told, this enables a rather practical approach to improving the “Observability” of any complex organization: you start by onboarding the raw machine data already available to you to get visibility into the infrastructure, and then incrementally pluck out breadcrumbs to establish links within the data in order to navigate the data more naturally. Before long, you can start from a “User” or “Service Desk Ticket” and immediately zoom into the raw logs that are associated with them, and from there to the rollout and code change that may have introduced an issue.
In Part 3, we’ll wrap up with our requirements for an Observability platform, and an overview of our own.
