
Welcome To Observe
 By Jeremy Burton,October 7, 2020
Today is a big day in the life of Observe… we have officially emerged from stealth!
As a part of this move, we announced $35M in Series A and debt financing led by Mike Speiser, Managing Partner at Sutter Hill Ventures (SHV). Early investors also include my ex-boss Michael Dell, my ex-EMC colleague Frank Slootman, and my ex-arch-nemesis (while at Pure Storage!) Scott Dietzen. These are all incredible people that I have tremendous respect for… and have learned a lot from over the years.
Observe is focused on a new segment of the market called Observability which promises to supplant the $20B+ market for Log Analytics, Infrastructure Monitoring, and Application Performance Management.
Why is this happening now? Even before the COVID era, the world was becoming increasingly digital and at the core of this movement was the development of modern distributed applications.
These applications are different – they are updated continuously, have a microservices architecture, and are deployed on a new cloud-native infrastructure, which changes by the minute. When something goes wrong, the complexity can be overwhelming… and it’s ultimately the customer who suffers.
Today’s tools aren’t keeping up. They were designed for, and deal with, siloed data – logs are different from metrics, which are different from traces. They lose context as you move between different data silos. They don’t deal well with time. They don’t allow ad-hoc exploration of unknown problems – which you see every day when you release new code every day. And they cost a fortune – pricing is based on the volume of data and expert users must be hired.
We believed that Observability was fundamentally a data problem — so we created a data company.
Observe was founded in 2017 by SHV and recruited a world-class founding team with deep experience dealing with vast quantities of data. Jacob Leverich joined the team from Splunk, Jonathan Trevor from Wavefront, Jon Watte from Roblox, and Philip Unterbrunner from Snowflake, via Facebook. More recently, after I joined in late 2018, we began building out with the addition of Keith Butler, who joined as CRO from Perfecto in 2020.
We believed that Observability was fundamentally a data problem. If all telemetry data could be brought together, curated, and – where possible – related, then it could be an order of magnitude faster to detect, investigate, and resolve issues. In addition, if the architecture of Observe could leverage concepts such as elastic compute and cloud storage then it could be an order of magnitude cheaper as well.
To date, almost all incumbent vendors have chosen to build their own proprietary database to store and query their data. Some have two or three. Observe, uniquely, chose Snowflake – a commercial Cloud Data Warehouse which was built to handle not just tabular relational data but also semi-structured and time-series data. Choosing Snowflake meant that Observe could not only process all types of event data in a single data store, but it could also store the data at a little more than the cost of Amazon S3.
The State of the art for investigating issues has been to present the user with a search box and allow them to type in breadcrumbs iteratively. Unfortunately, the machine-generated data the user is searching through has no semantics and no meaning – it provides no logical starting point and is often overwhelming, especially for new users. Observe changes all of this by curating data into “resources”.
A resource is a user, a session, a shopping cart, a pod, a container, a helpdesk ticket, or a build. It is a ‘thing’ that the user would like to ask questions about and it provides a logical, recognizable, place to begin an investigation. Moreover, resources can be related – so a helpdesk ticket can relate to a user, which relates to a session, which relates to container logs, and so on. This means Observe can easily provide all available context for issues being investigated – without resorting to tagging.
And then Observe goes a step further – once a resource is curated e.g. “Server”, then it will track how the state of that resource’s attributes change over time e.g. “IP address”. In fact, Observe tracks the state of every resource over time, which allows the user to reconstitute the state of the entire system at any point in time.
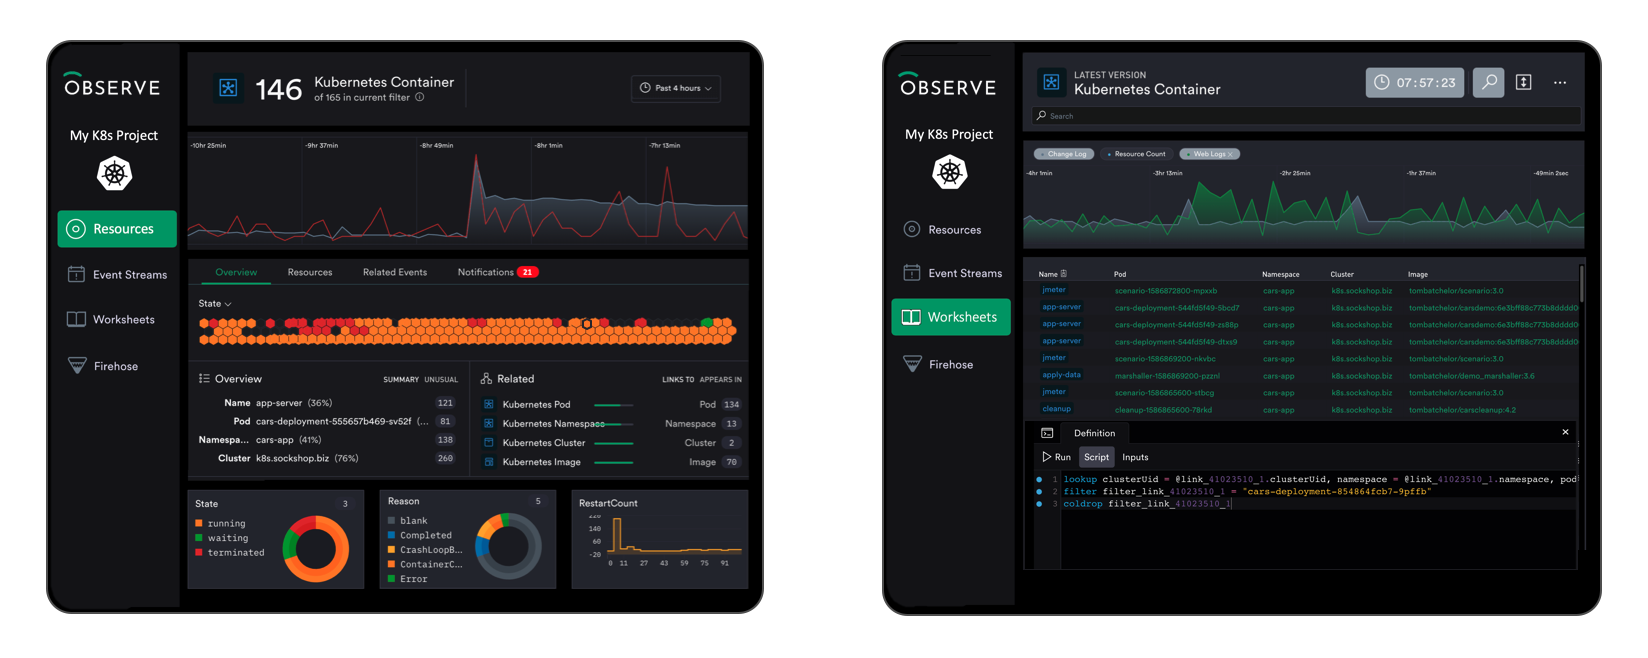
When there’s an incident, there’s no guarantee the most senior engineer is going to be available to triage or troubleshoot – it’s often the more junior members of the team that are on-call. For this reason, Observe provides a couple of levels of abstraction on top of common, shared, data:
i) Resource Landing Pages – highly visual, automatically generated, dashboards that allow novice or intermediate users to quickly get oriented
ii) Worksheets – a spreadsheet-like interface for seasoned engineers which includes OPAL for direct programmatic manipulation of data.
Finally, a word about pricing. We haven’t talked to any prospective customer in this space who is happy with the money they’re paying relative to the value they’re receiving. As I mentioned earlier, most pricing models are complex and revolve around the volume of data ingested. Observe’s pricing model is simple, and only has two components — storing data and querying data. Storage costs reflect current Amazon S3 pricing plus minor charges for processing data on ingest. Querying data consumes “Observe Credits”. When the user is using Observe and getting value from the product they pay for it, when they are not using Observe they don’t pay for it.
Observe is currently working with about 15 customers right now to smooth the rough edges of the product and make sure we have a feature set that enables our users to get their job done. If you’re interested in working with us then you’ll be pleased to know that we’re offering “Early Access”, you can sign up here.