Blog


What's New: Jenkins + GitHub + GitLab Apps!

Link this new data to other data you already have in Observe such as Customer Tickets, Shopping Carts, or Pods to gain full observability from commit to crash.
Introduction
Earlier this summer we introduced Observe Apps to make onboarding data from your favorite services a frictionless experience. Today, we’re excited to introduce the three latest Apps in Observe: Jenkins, GitLab, and GitHub!
Whether it’s for source code management, automating builds, or a part of a well-oiled CI/CD pipeline, chances are you or your organization use at least one of these services somewhere in your software development process. Observe now makes it easier to help you monitor the health and activity of your entire development pipeline with out-of-the-box content like Dashboards, Datasets, and sample Monitors for these services.
In addition to making your CI/CD pipelines more transparent, the real power comes from Observe’s ability to combine this data with other data that already exists in Observe to find relationships you never thought possible. And with tools like Dataset Graph and GraphLink, you’re free to visually explore this interconnected world of data and ask big questions from your observability data.
Let’s take a closer look at each of these Apps to see what content they provide and some of the many scenarios in which they can be used.
Jenkins
Most Developers, SREs, and DevOps engineers are familiar with Jenkins, the world’s most popular open-source automation server. But observing Jenkins isn’t exactly straightforward. Between the limited functionality provided by monitoring plugins, and often overlooked crucial logs, Jenkins doesn’t make it easy to see the big picture.
The Observe Jenkins App makes it easy to monitor the health of your Jenkins pipelines with Dashboards, Datasets, and Monitors that include specific data about your Jenkins jobs, builds, build logs, nodes, agents, and much more.
What’s Included?
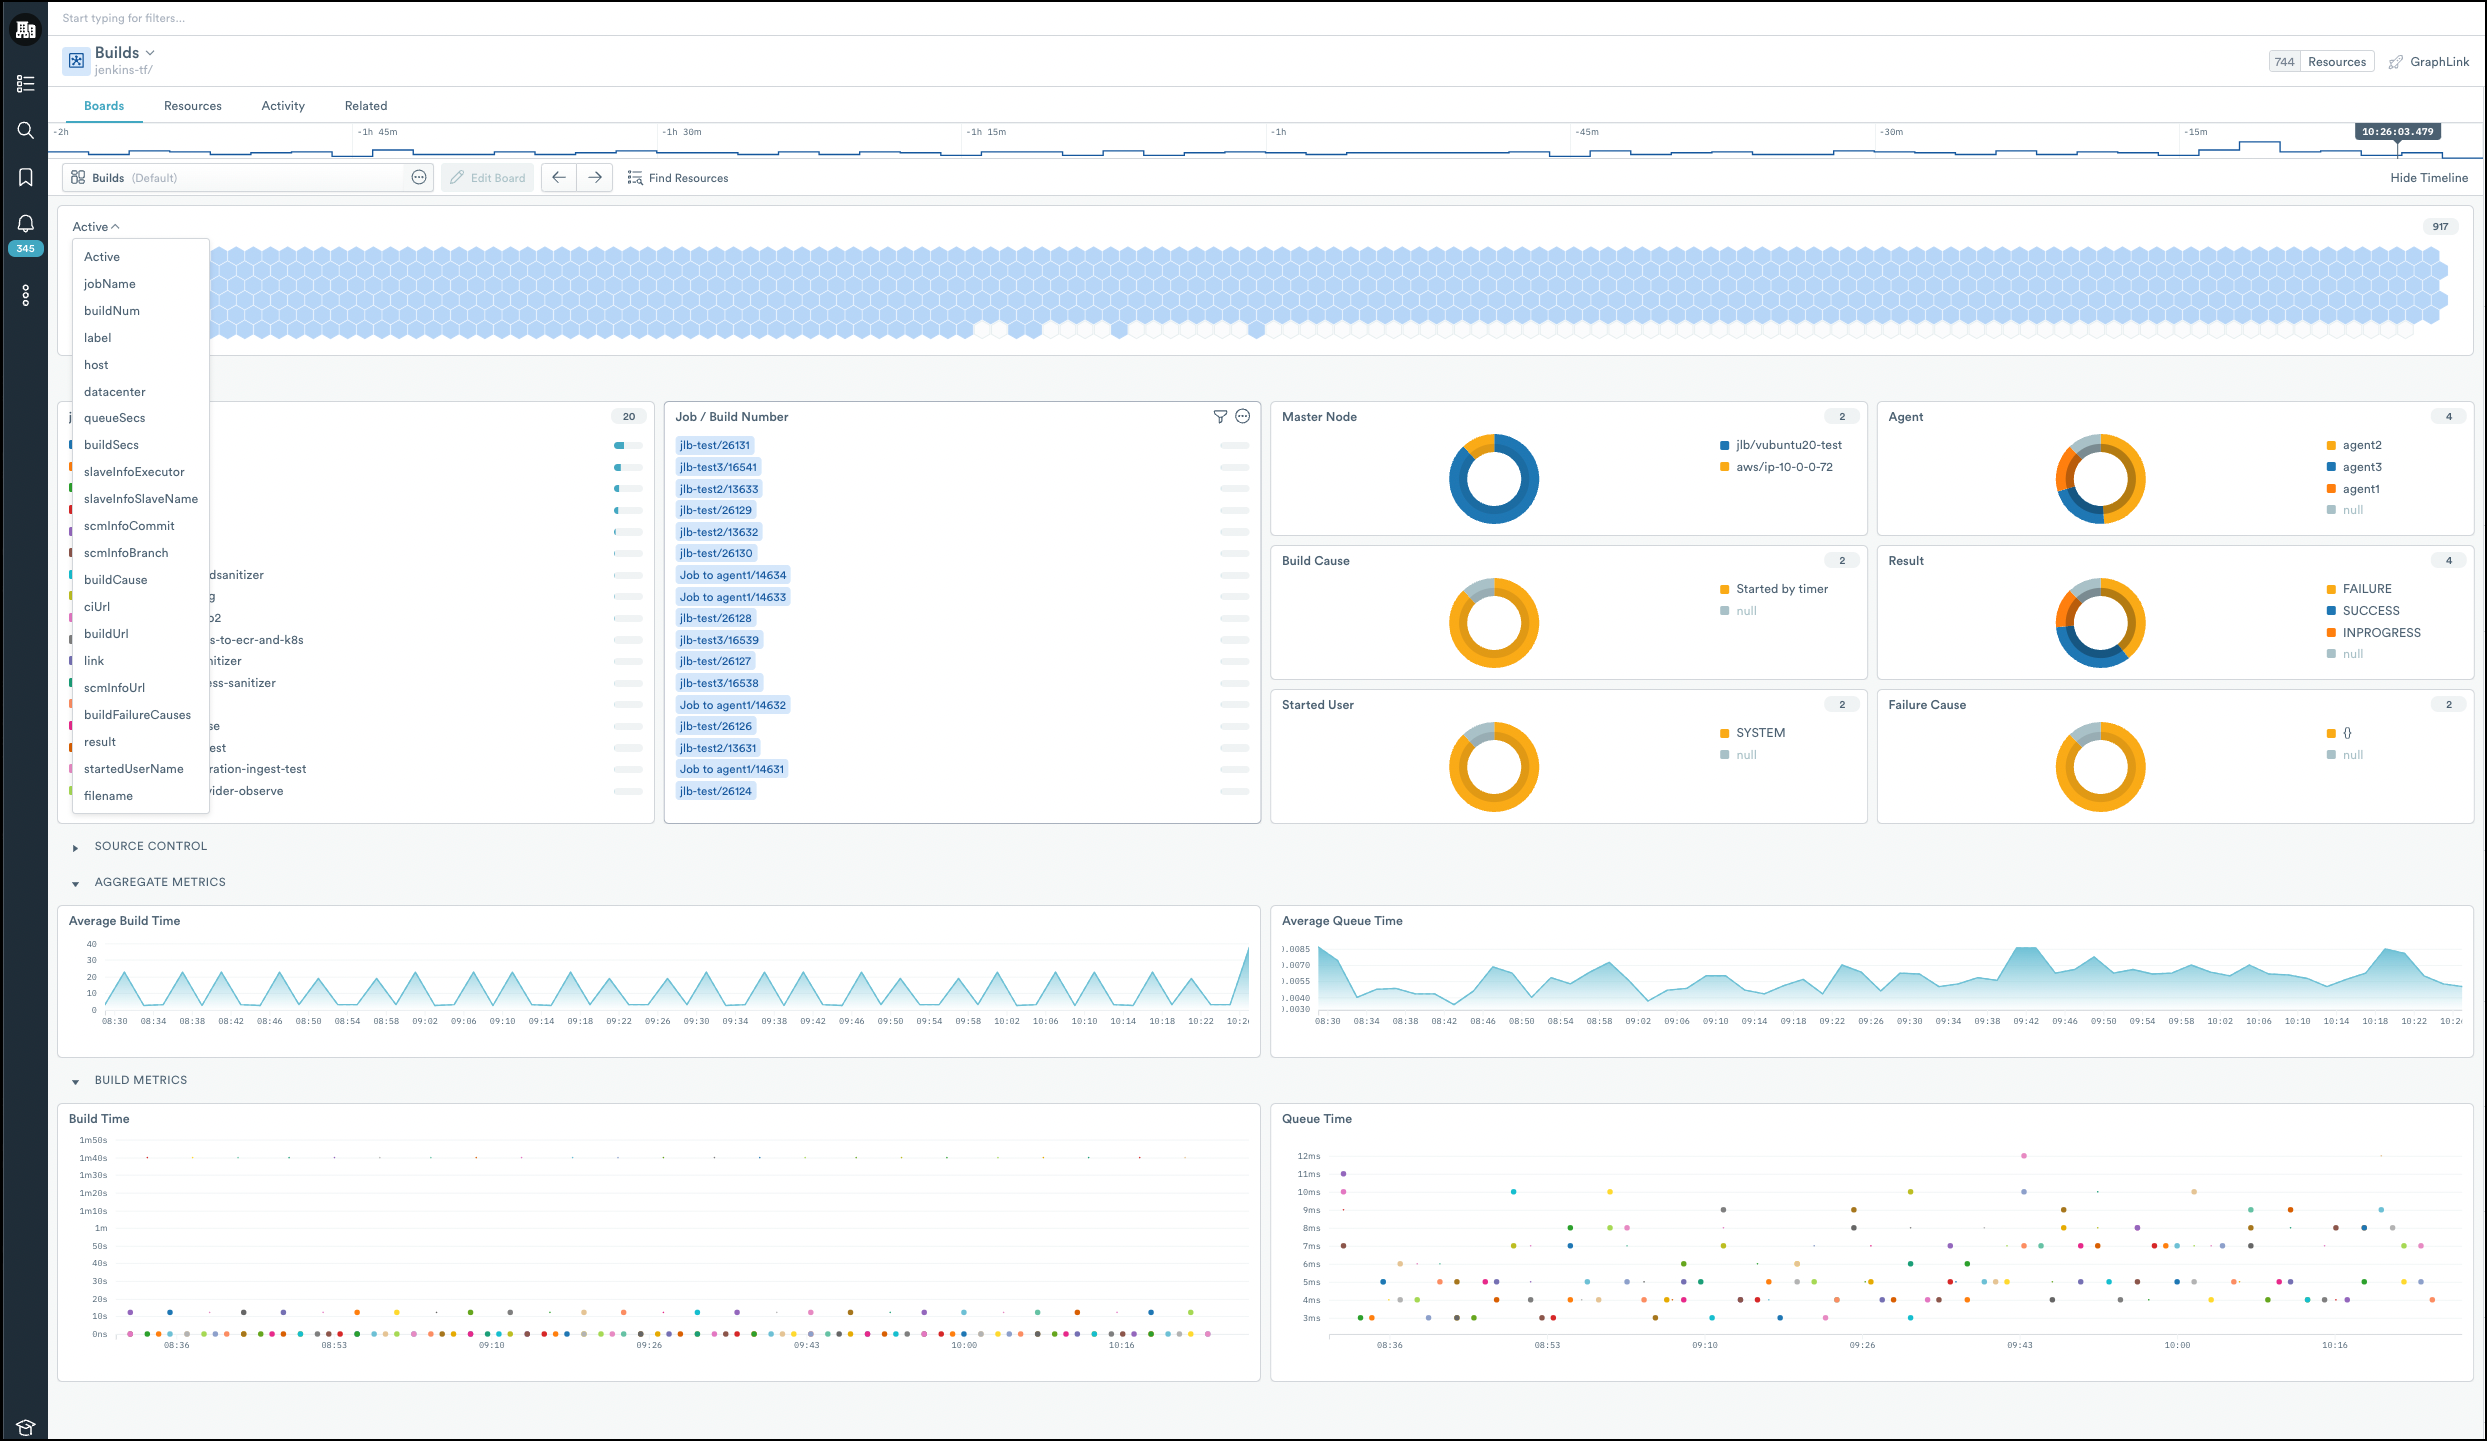
You can expect to find nearly a dozen Datasets out of the box, like the Jenkins Build Dataset (pictured below). This dataset shows aggregate metrics for your Jenkins builds such as build time, queue time, results, and failure causes.
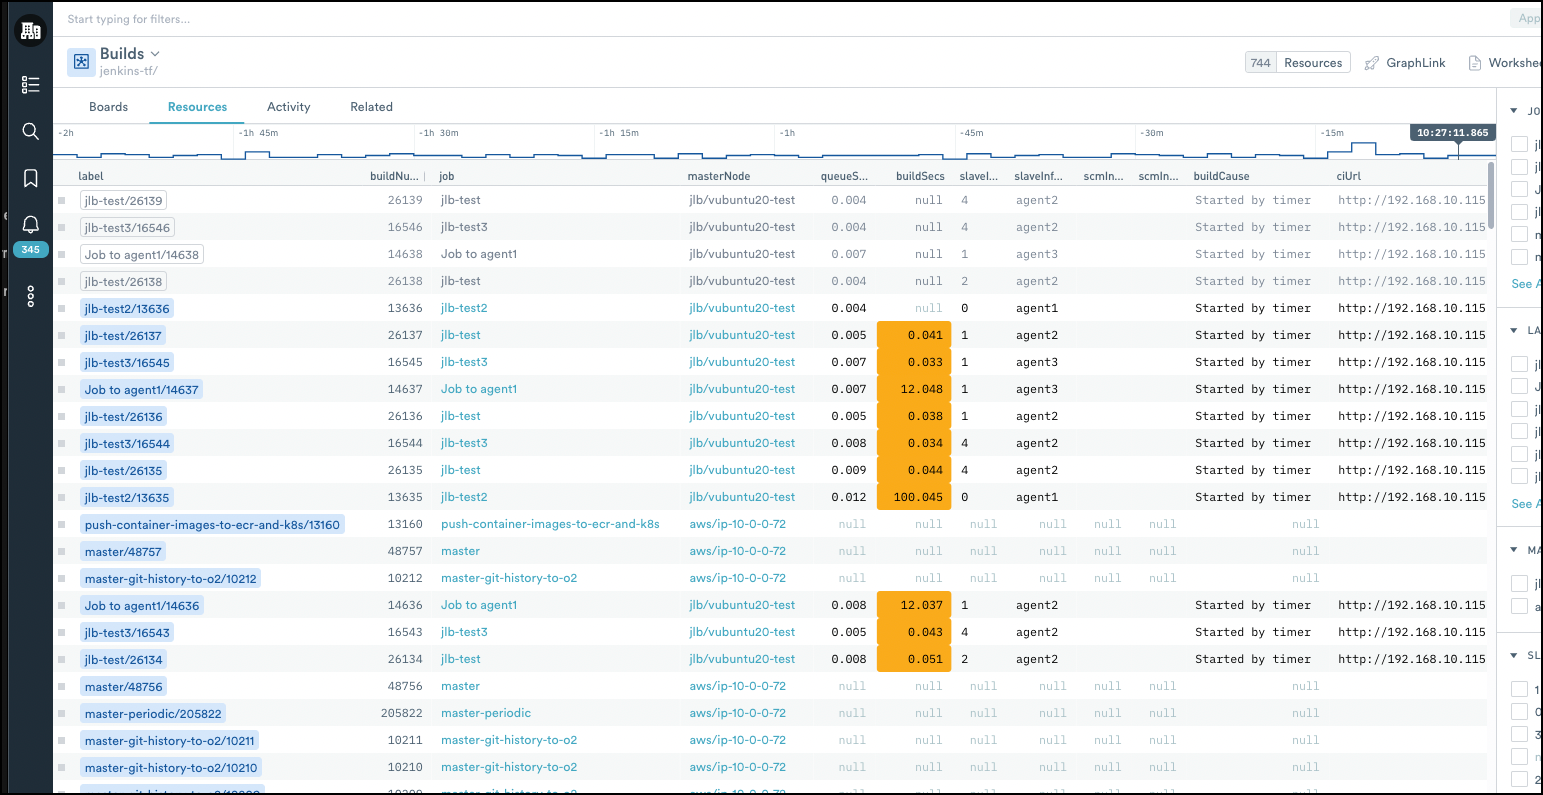
Dig even further by clicking on the Resources tab and view the status over time for individual Jenkins builds, with links to the related Job node and the Jenkins configuration page for each build. Get immediate visibility into each build with metrics like current status, result, queue time, and build time.
In addition, you can expect to find other Datasets like Jobs, Build Logs, Metrics, and Dashboards that show you at-a-glance your overall job and build health, and sample Monitors to help you save time when creating meaningful alerts.
What Can You Do With This Data?
- Quickly find and diagnose failed builds with the Jenkins Build Dashboard.
- Debug and drastically reduce long build times using the Jenkins Jobs Dashboard to find anomalies in run duration or other related metrics.
- With the addition of the Host Monitoring App, you can link your Jenkins CI data to metrics like CPU, Memory, and Disk utilization from your Jenkins hosts (Linux or Windows) to quickly diagnose build issues that may be related to the underlying host.
Installation
Check out the Jenkins Installation Guide to install and configure the Jenkins App. After configuration, data from your Jenkins server populates the included Datasets and Dashboards and displays information from your Jenkins builds.
GitHub
A cloud-based service that needs no introduction, GitHub.com is the world’s most popular online software development platform. GitHub helps developers store, manage, and share their code using the Git version control system. With over 73 million software developers worldwide relying on GitHub for their development workflows, Observe wanted to make it painless to ingest data from all things GitHub.
What’s Included?
The GitHub App from Observe contains nearly two dozen Dashboards and Datasets combined to help you monitor your entire organization’s GitHub activity as well as provide you with a high-level administrative overview of your organization to help keep your code secure.
Among the nine Dashboards included in the App, you’ll find the GitHub Activity Dashboard (pictured above), The Dashboard allows you to easily monitor your entire organization’s activity in GitHub with detailed information from commits, pull requests, releases, and GitHub actions in an intuitive and easy-to-view layout.
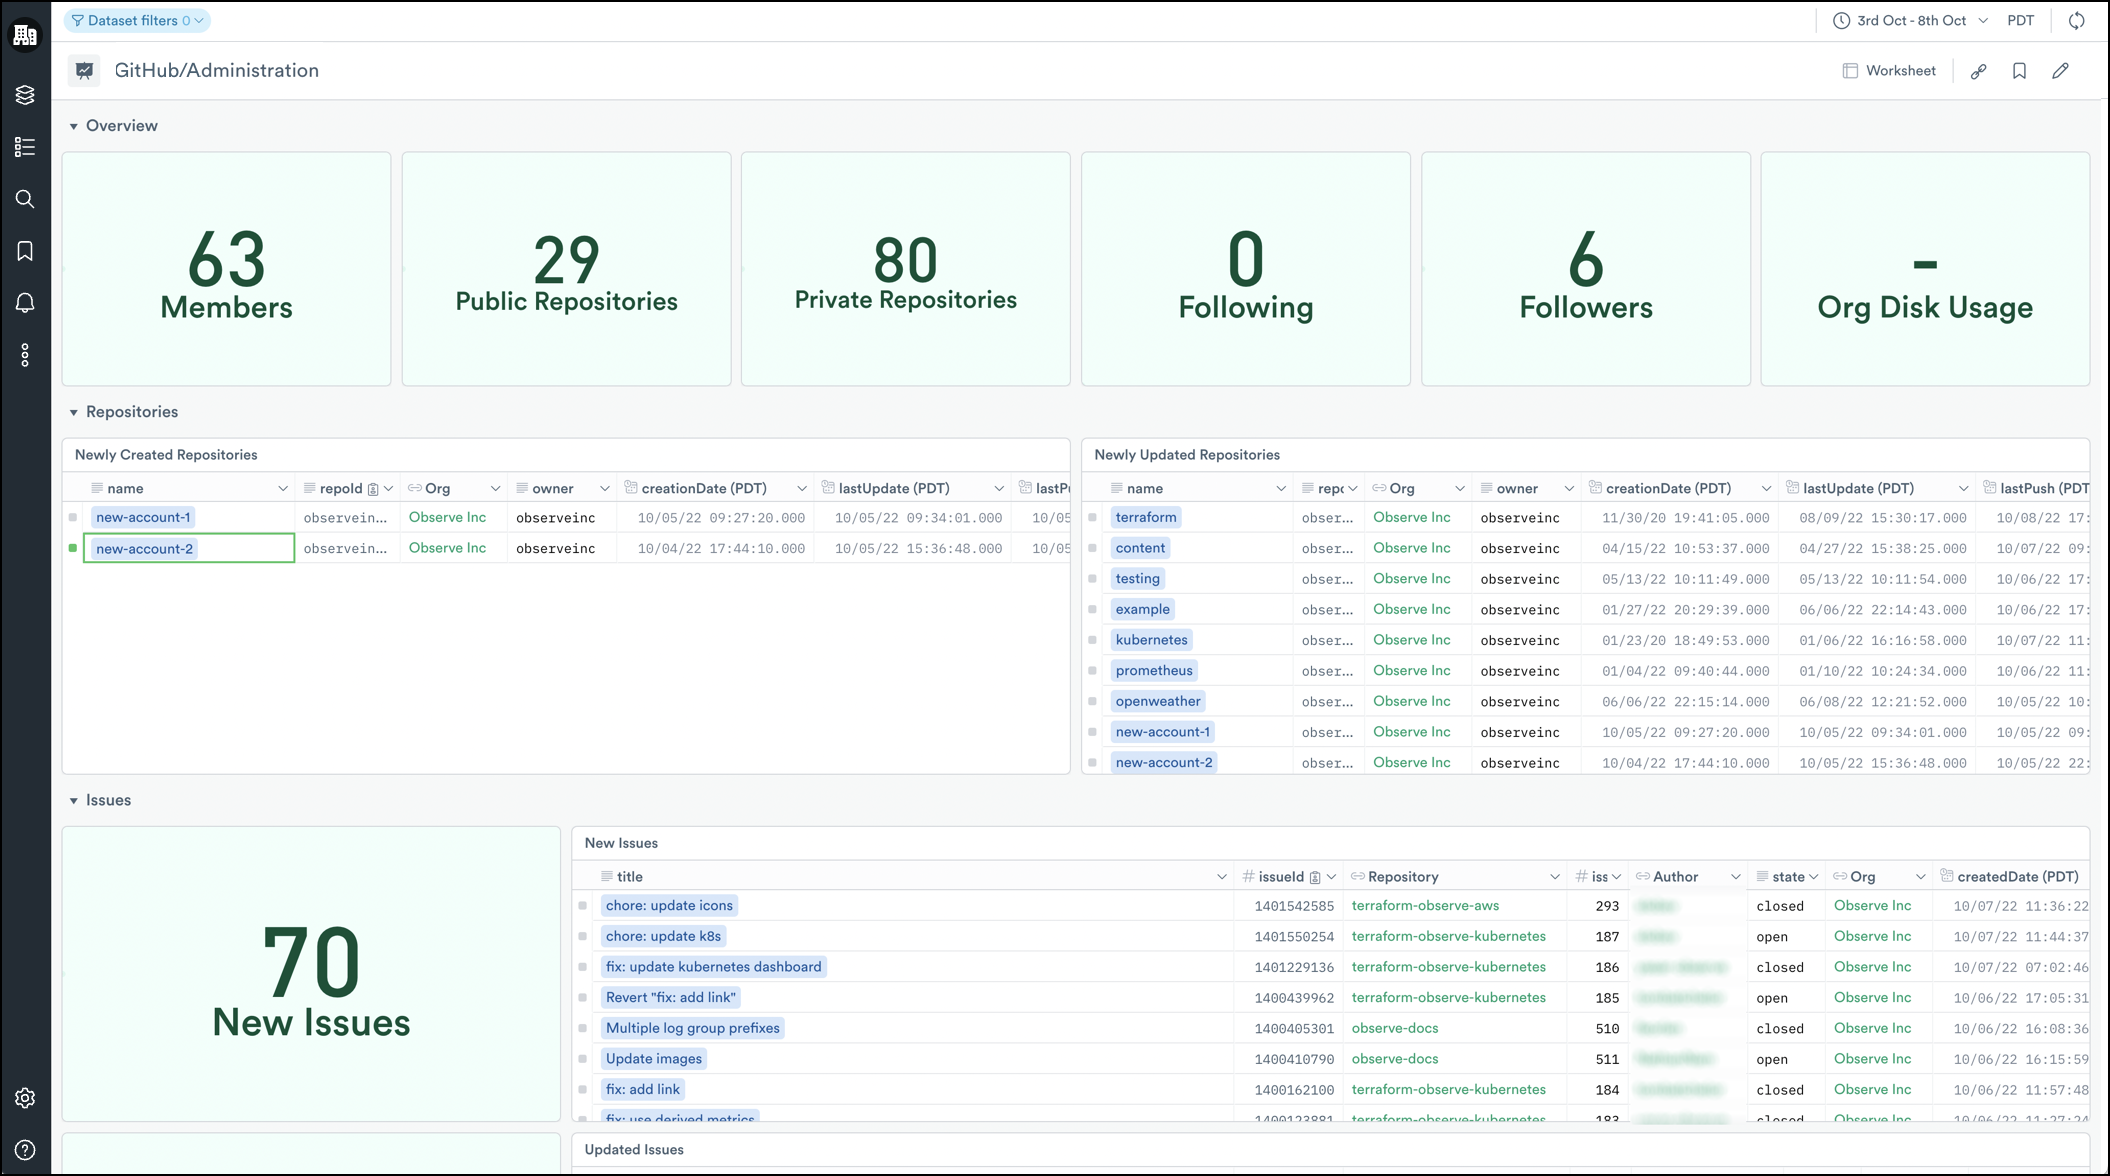
You’ll also find the GitHub Administration Dashboard (pictured above) that gives you an administrative overview of your organization(s) with insights into events related to your GitHub repositories, issues, members, disk usage, and much more.
Behind each of these Dashboards are powerful Datasets for the same things you see in the Dashboards — Commits, Users, Repositories, and more — that come in handy when you need more context around an issue. Lastly, link these Datasets to other data you already have in Observe such as Customer Tickets, Shopping Carts, or Pods to gain full observability from commit to crash.
What Can You Do With This Data?
- Quickly find out which Action runs are failing or hanging with the GitHub Activity Dashboard.
- Investigate whether an increase in forced commits or an unusually high number of releases is related to an increase of issues in GitHub with the Issues Dataset.
- Link the Commits Dataset to your Kubernetes Image Dataset, and ultimately to your Application Logs, using GraphLink, to discover the commit, committer, and the time your app or service went down.
Installation
The GitHub App ingests data using Webhooks and the Observe API poller. To install and configure data collection, see the GitHub Installation Guide. After configuration, data from GitHub populates the Datasets and Dashboards and displays information from your organization(s).
GitLab
GitLab CI/CD is an open-source software development platform designed to automate repetitive technical tasks involved in the continuous integration and continuous delivery of software. GitLab can be self-hosted — on-premises using your servers, in Docker, or a public cloud provider like AWS or GCP — or you may use the commercial SaaS paid version offered by GitLab.
No matter how you use GitLab, or where you host it, the Observe GitLab App is designed to help you manage and monitor your organization’s activities in GitLab and help you administer your GitLab environment(s) in Observe.
What’s Included?
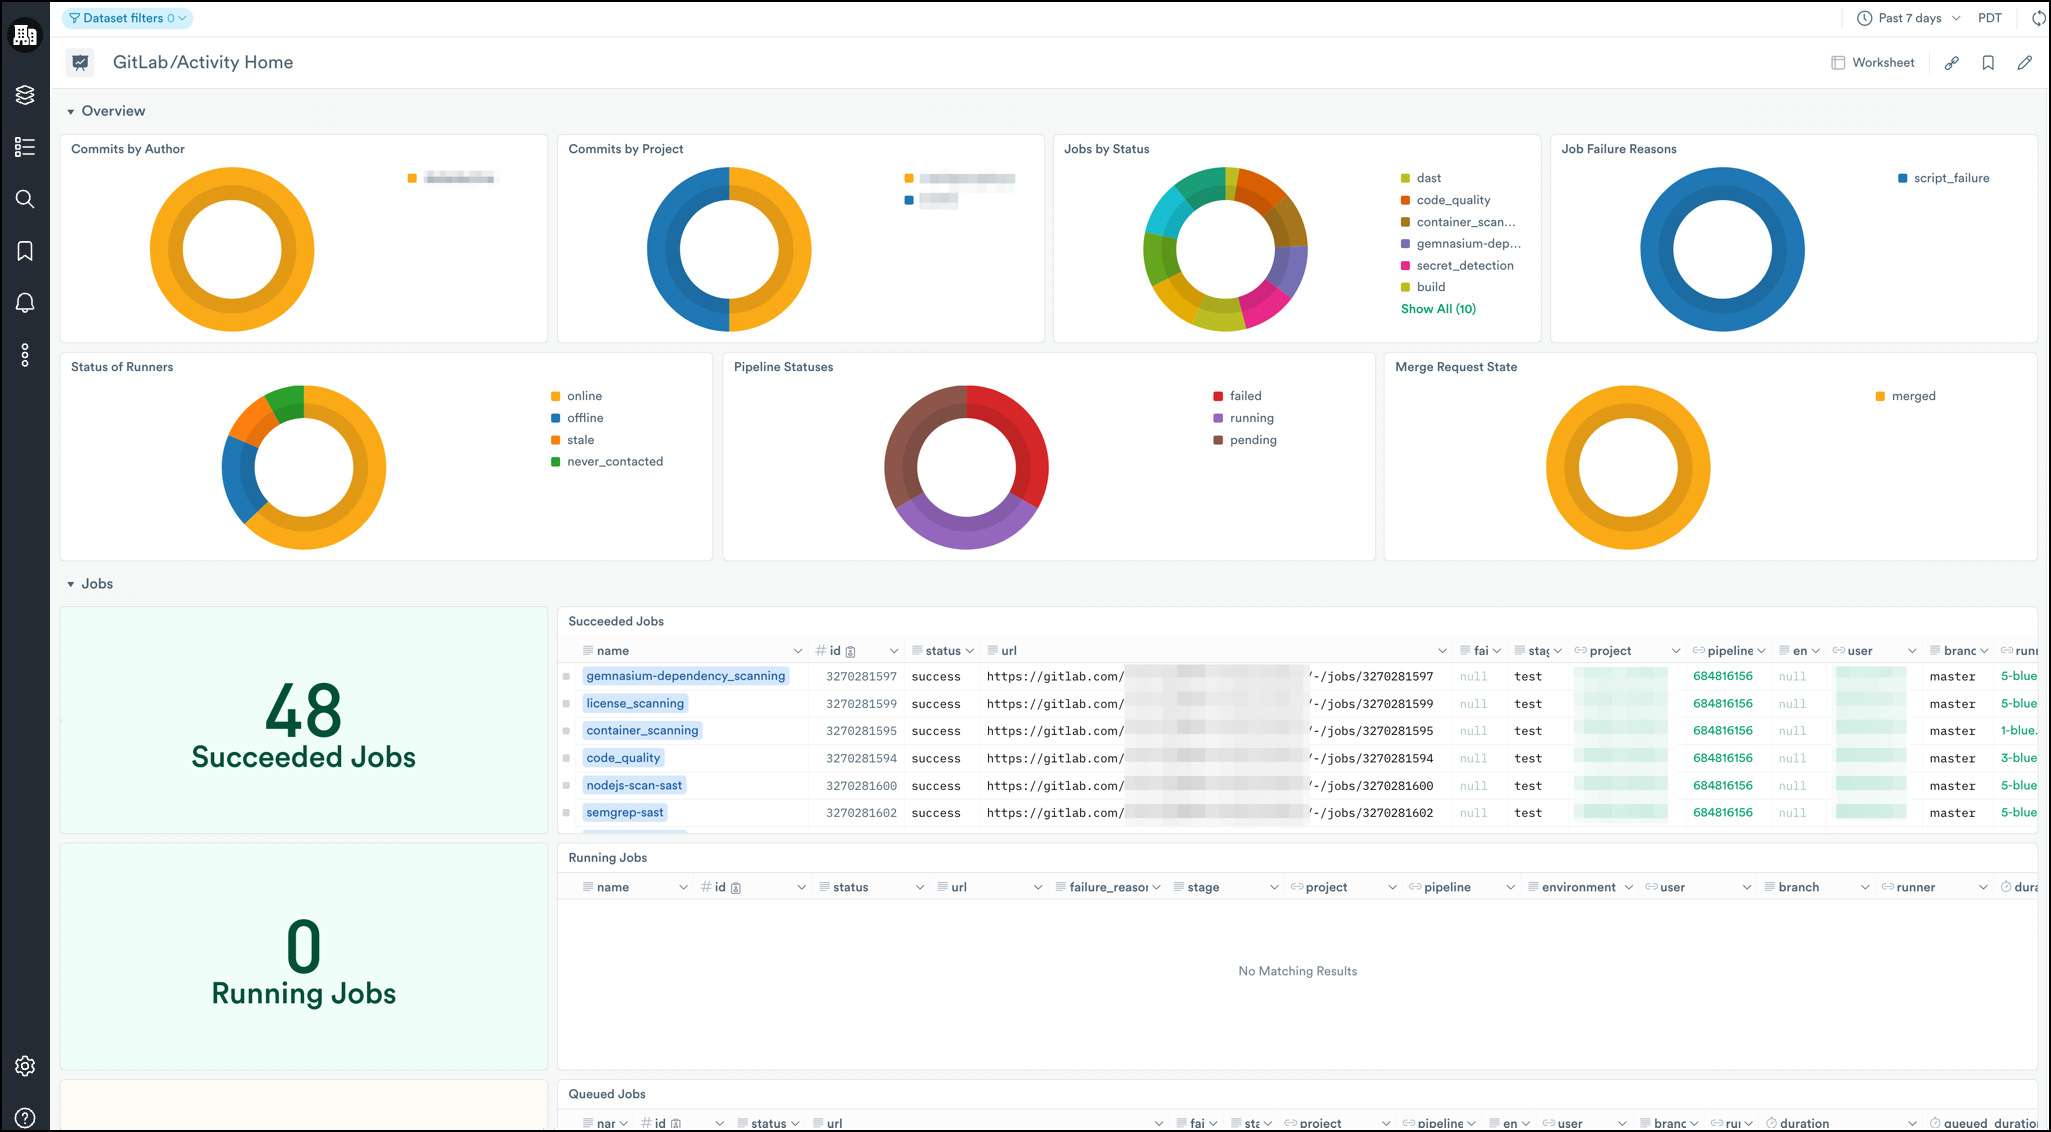
The Observe GitLab App contains Dashboards, like the GitLab Activity Dashboard (pictured below), that gives you a high-level overview of your organizations output, with information on commits (by project and author), merge request state, job status (queued, running, and completed), and runner status. Quickly discover failing or unresponsive jobs, or investigate merge requests around the time of an emergent issue.
Similar to the GitHub App, the GitLab App also provides an Administration Dashboard to give you an overview of your organization(s) for administrative and security purposes, with insights into Groups, Projects, Issues, Members, and more.
And because Observe’s Dashboards are built on underlying Datasets, you can quickly and easily drill down further into anything you see in the Dashboard. Things like GitLab Repos, Runners, Pipelines, and more are ripe for investigation and correlation with other Datasets in Observe — eliminating the need for multiple tools or browser tabs. Ingest, analyze, and correlate all your data from GitLab in one place.
What Can You Do With This Data?
- Quickly, and visually, discover bottlenecks in your Pipelines with the GitLab Activity Dashboard.
- Link the Merge Request Dataset to failed builds or failed deployments to better understand and refine your organization’s source code management (SCM) process.
- Use the GitLab Administration Dashboard to keep an eye on newly created and recently updated repositories and potential security implications.
Installation
To install and configure data collection, see the GitLab Installation Guide. After configuration, data from GitLab populates the Datasets and Dashboards and displays information from your organization(s).
Conclusion
Whether it’s monitoring all your favorite services from Observe, or digging deeper to better understand how your CI\CD tools impact your entire product development lifecycle — and ultimately your customers — the new Jenkins, GitHub, and GitLab Apps have you covered. But we’ve only scratched the surface of what these apps can do. Check out each App’s documentation to see a full list of included Datasets and Dashboards, more use cases, and detailed information on installation and configuration.
And, be sure to check out the full list of integrations we currently provide to make even more discoveries from data that you already have in Observe!
If you’re not an Observe customer, but want to get full observability from your CI/CD pipelines with these latest Apps, then click here to request trial access!


