Blog

What’s New: Azure App!

Observe Apps aren’t just about observing a particular service, but rather making it easier to correlate that data with other observability data you already have — something no other SaaS observability product can do.
Introducing the Azure App from Observe
Since the launch of Observe Apps earlier last summer, we’ve released nearly a dozen Apps to make observability easy regarding the apps and services you use every day. Today, we’re excited to introduce the Azure App from Observe!
Built to go beyond cloud-native monitoring solutions, the Observe Azure App makes it painless to ingest all of your telemetry from various Azure services and make sense of it. It comes loaded with out-of-the-box content like Dashboards, Datasets, and Monitors to bring you observability in just a few clicks. But observing your services in Observe is only part of the power of Observe Apps…
Using the Data Graph, you can link to other data already present in Observe to find new relationships that you never knew existed. Discover things like how high response times in your Azure Functions impact the volume of Customer Tickets you receive or negatively impact overall application performance — and ultimately user experience.
Furthermore, the release of the Observe Azure App means that we now support all three major cloud platforms (AWS, GCP, and Azure) — meaning multi-cloud observability is now a reality with Observe.
What is in the App?
The Observe Azure App comes loaded with Datasets, Dashboards, and Monitor templates for five of the most popular Azure services: Azure Kubernetes Service (AKS), Functions, SQL Databases, SQL Managed Instances, and Virtual Machines— with many more coming soon.
Let’s jump into each of these services to see what’s included, and how you can use them to make observing your Microsoft Azure Cloud environments easier.
Azure Kubernetes Services (AKS)
Azure Kubernetes Service (AKS) is a fully managed container orchestration service from Microsoft that allows users to quickly deploy production-ready Kubernetes clusters without worrying about the underlying infrastructure and management.
Whether you use AKS to deploy and manage a complex array of microservices, or as a simple container orchestration tool, the Observe Azure App makes it painless to observe your AKS-based workloads. Let’s take a look at some of the content you can expect to find in this app for AKS.
Dashboards
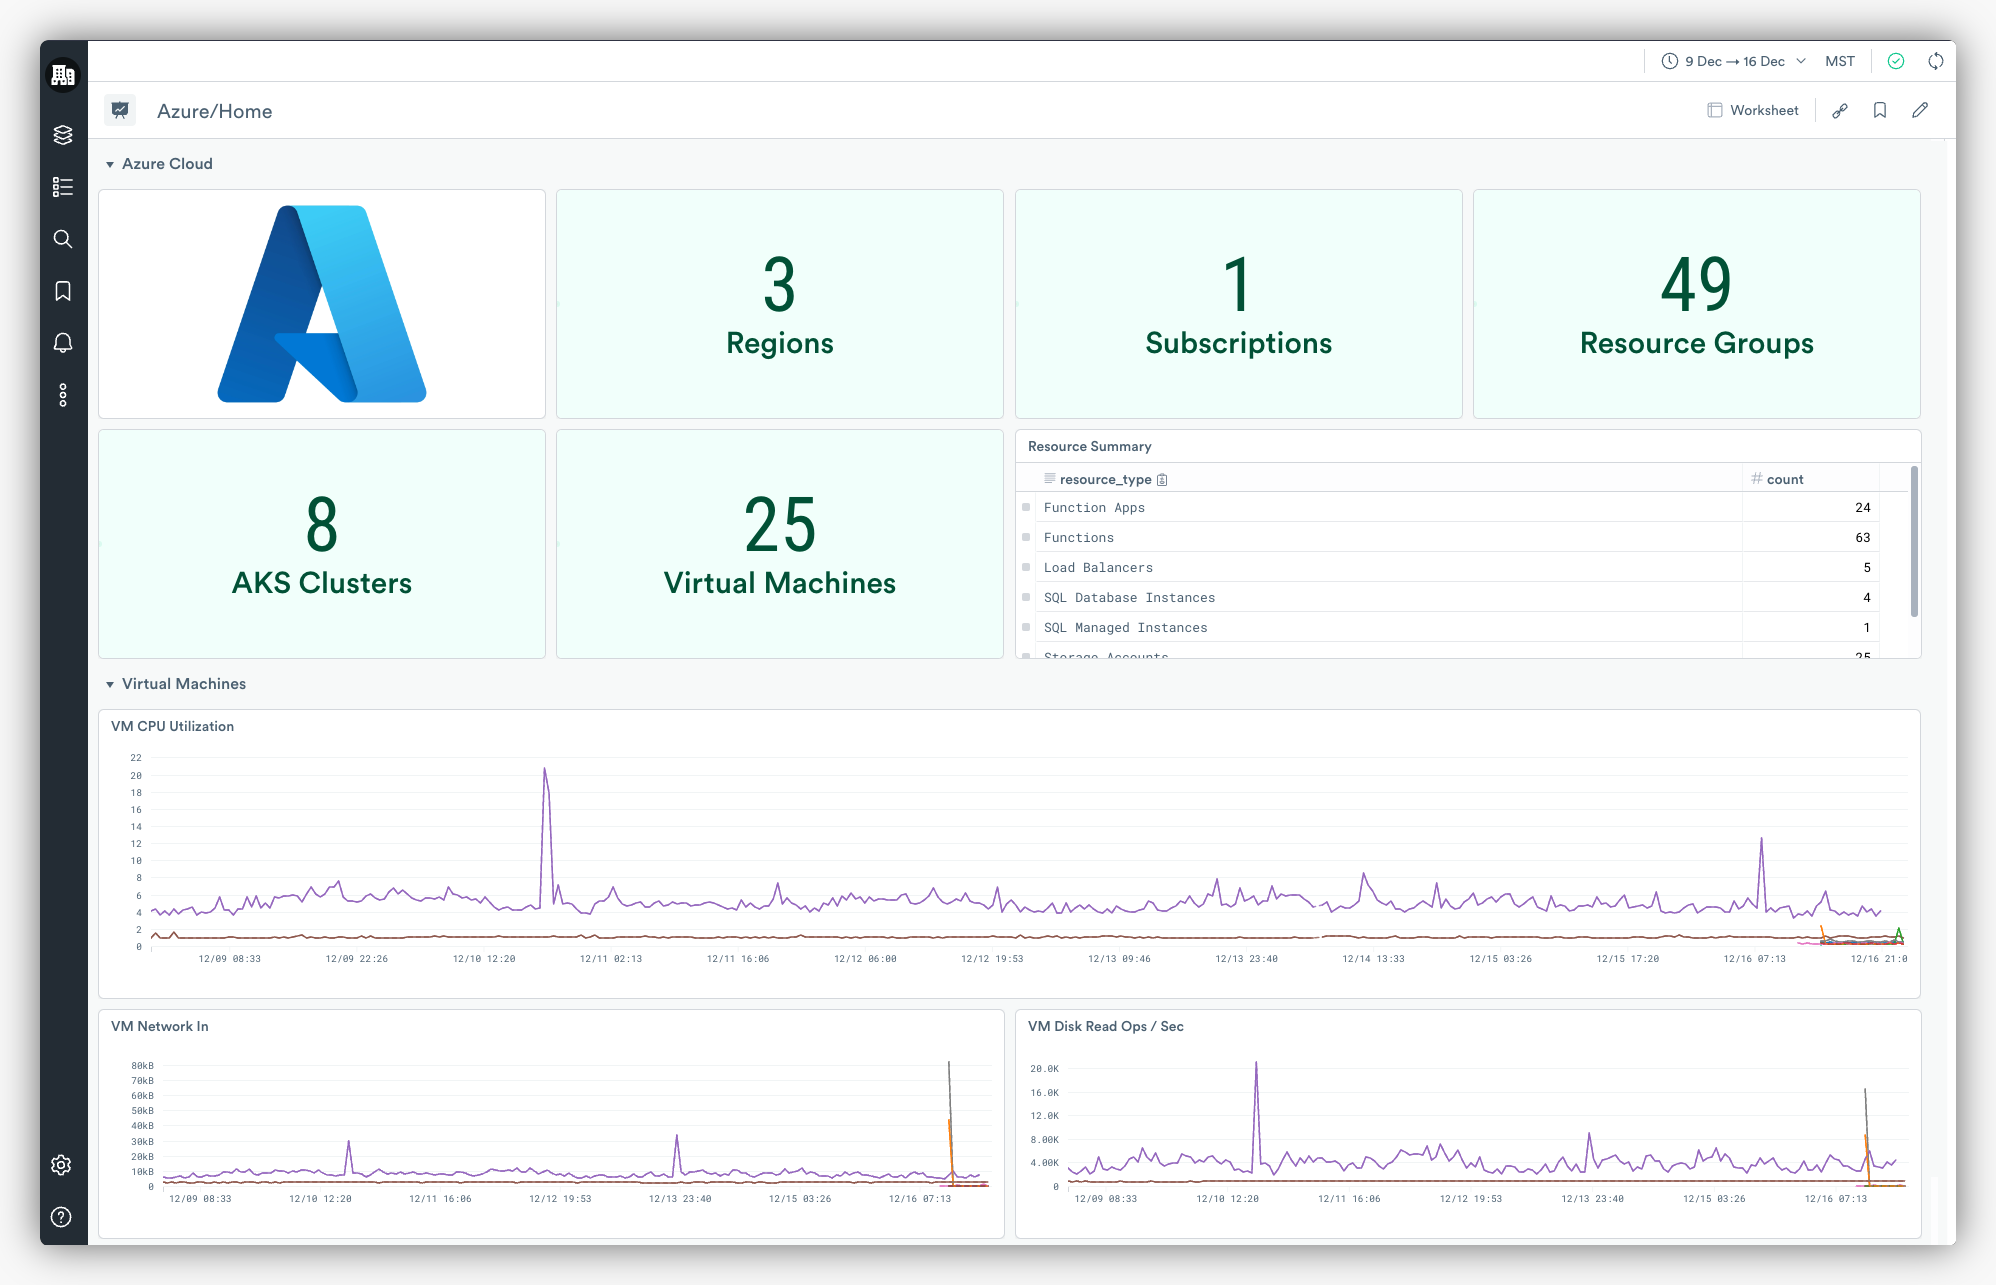
The Azure App provides an AKS Cluster Monitoring Dashboard (pictured below) to give you a high-level overview of the activity within your AKS environment. Quickly see stats related to the health of your environment, like your cluster state, active regions, allocatable resources, and much more.
This Dashboard also lets you dive deep into cluster metrics like CPU Usage, Memory Usage, and Disk Usage to help you discover the root cause of an issue should it arise in your cluster.
Datasets
The Azure App also brings with it three Datasets — AKS Cluster, AKS Logs, and AKS Metrics — that allow you to dig deeper into your AKS-related telemetry to ease troubleshooting, create alerts on critical events, and even gain new insights.
Note: Install the Observe Kubernetes App for even more comprehensive Kubernetes monitoring.
Functions
Azure Functions is a cloud service offered by Microsoft as a way to write, deploy, and manage applications in a serverless environment — which allows developers to save time managing resources, and spend more time writing code. The Observe Azure App comes pre-loaded with ren resources, like Dashboards, Datasets, and Monitor templates for Azure Functions. Let’s first take a look at the included Dashboards.
Dashboards
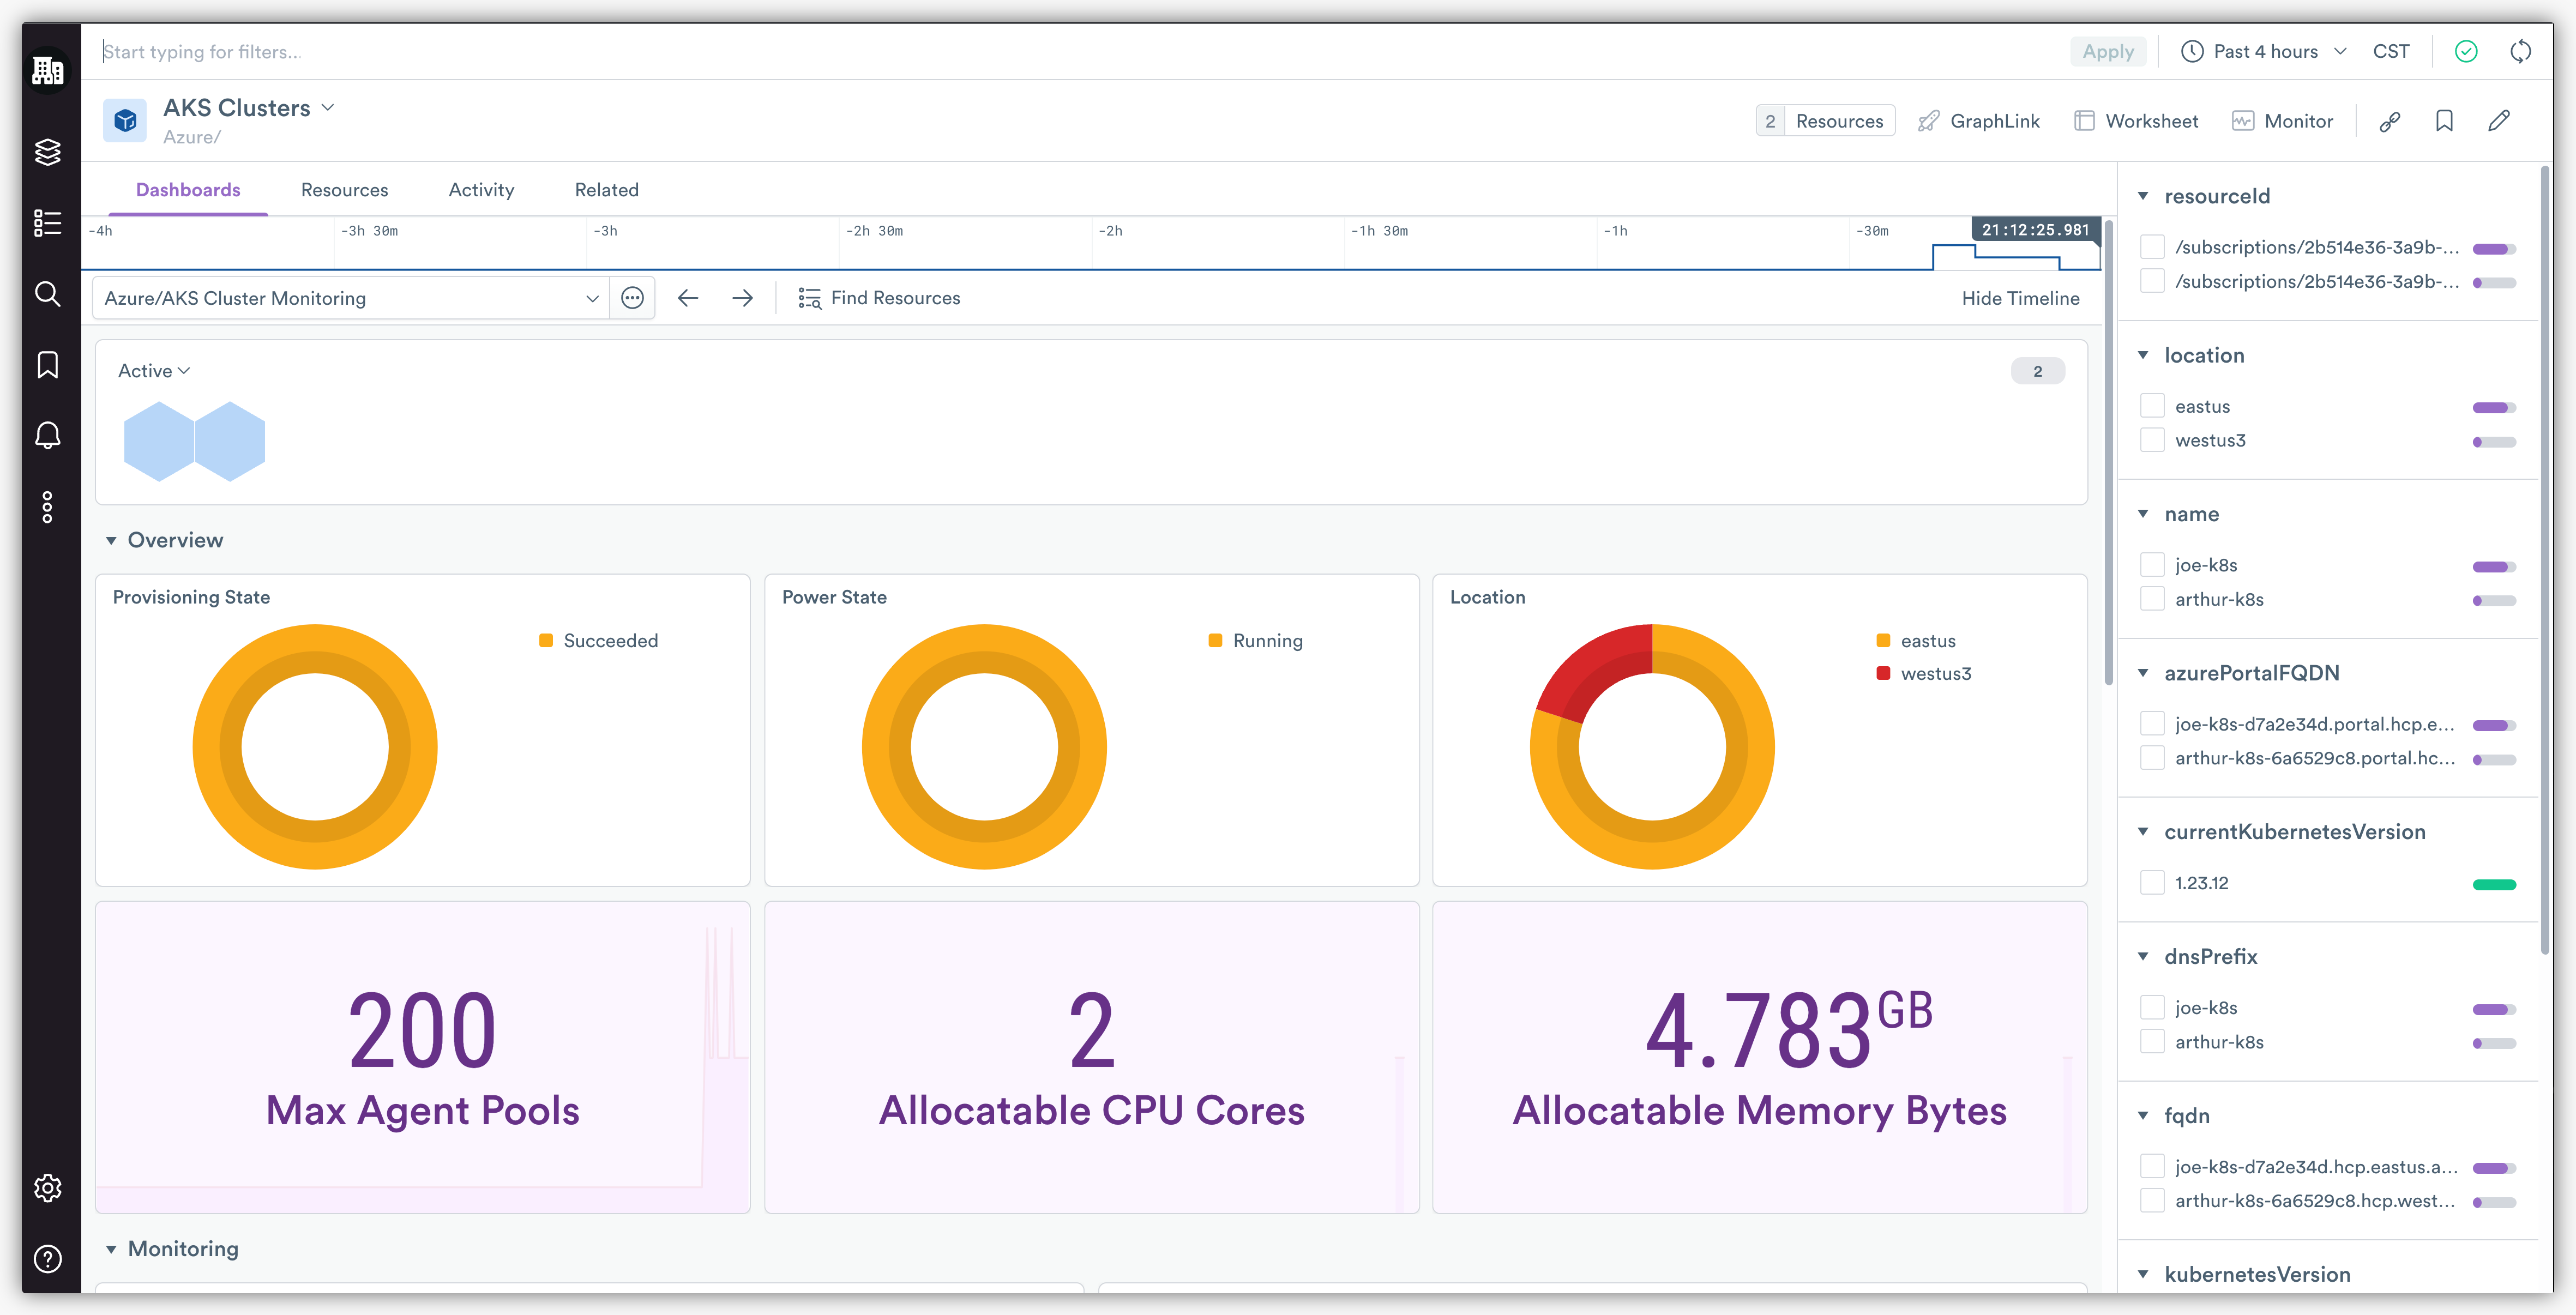
Of the four Dashboards included in the Azure App for Functions, you’ll most likely spend most of your time looking at the Functions Monitoring Dashboard (pictured below). This Dashboard is your one-stop-shop for the overall health and status of your Azure Functions. It’s packed with visualizations for the most crucial metrics like Execution Duration, number of Successful, Invocations, Failed Invocations, and Response Codes (2xx/3xx/4xx/5xx).
With this Dashboard, you can answer questions like, “What is the ratio of failed to successful invocations?”, or “How frequently are my functions executing?”
Other included Dashboards, like the Function Apps Monitoring Dashboard (not pictured), provide insights into requests for individual functions. Easily spot Failed Health Checks, the overall State of your Function app, or drill down through metrics like Average Response Time, Memory Usage, and number of Requests to ease troubleshooting your Function-based workloads.
Datasets
The Observe Azure App also comes with four Datasets: Function Logs, Function Metrics, Function App, and Function, which come in handy when more context is needed around an issue. Datasets are also handy when you need to troubleshoot a Resource, see how Resources have changed over time, or even create your own Datasets.
Monitor Templates
In addition to Dashboards, and Datasets, the Azure App also brings with it a handful of pre-built monitors to get you up and running quickly with crucial alerts for Azure Functions. They are:
- Function Health Check Status Under 100 – Alerts if the health check for any function is less than 100%.
- Function Failure Rate Greater Than 5% – Alerts if the function fail rate exceeds a configured percentage (default 5%).
Note that while you can use Monitor templates out of the box, they’re largely provided to make it easier to create your own custom Monitors that are unique to your application or environment (s).
SQL Database
Azure SQL Database is an always-up-to-date, fully managed relational database service built for the cloud. With our Azure App, you can gain valuable insights into how your Azure SQL Databases are performing.
Dashboards
The Azure App installs two Dashboards (SQL Databases Monitoring, and the SQL Database Monitoring Dashboard) for the Azure SQL Database service in particular that allows you to observe and monitor the performance of your database at a high level, down to an individual database — with dozens of metrics to explore.
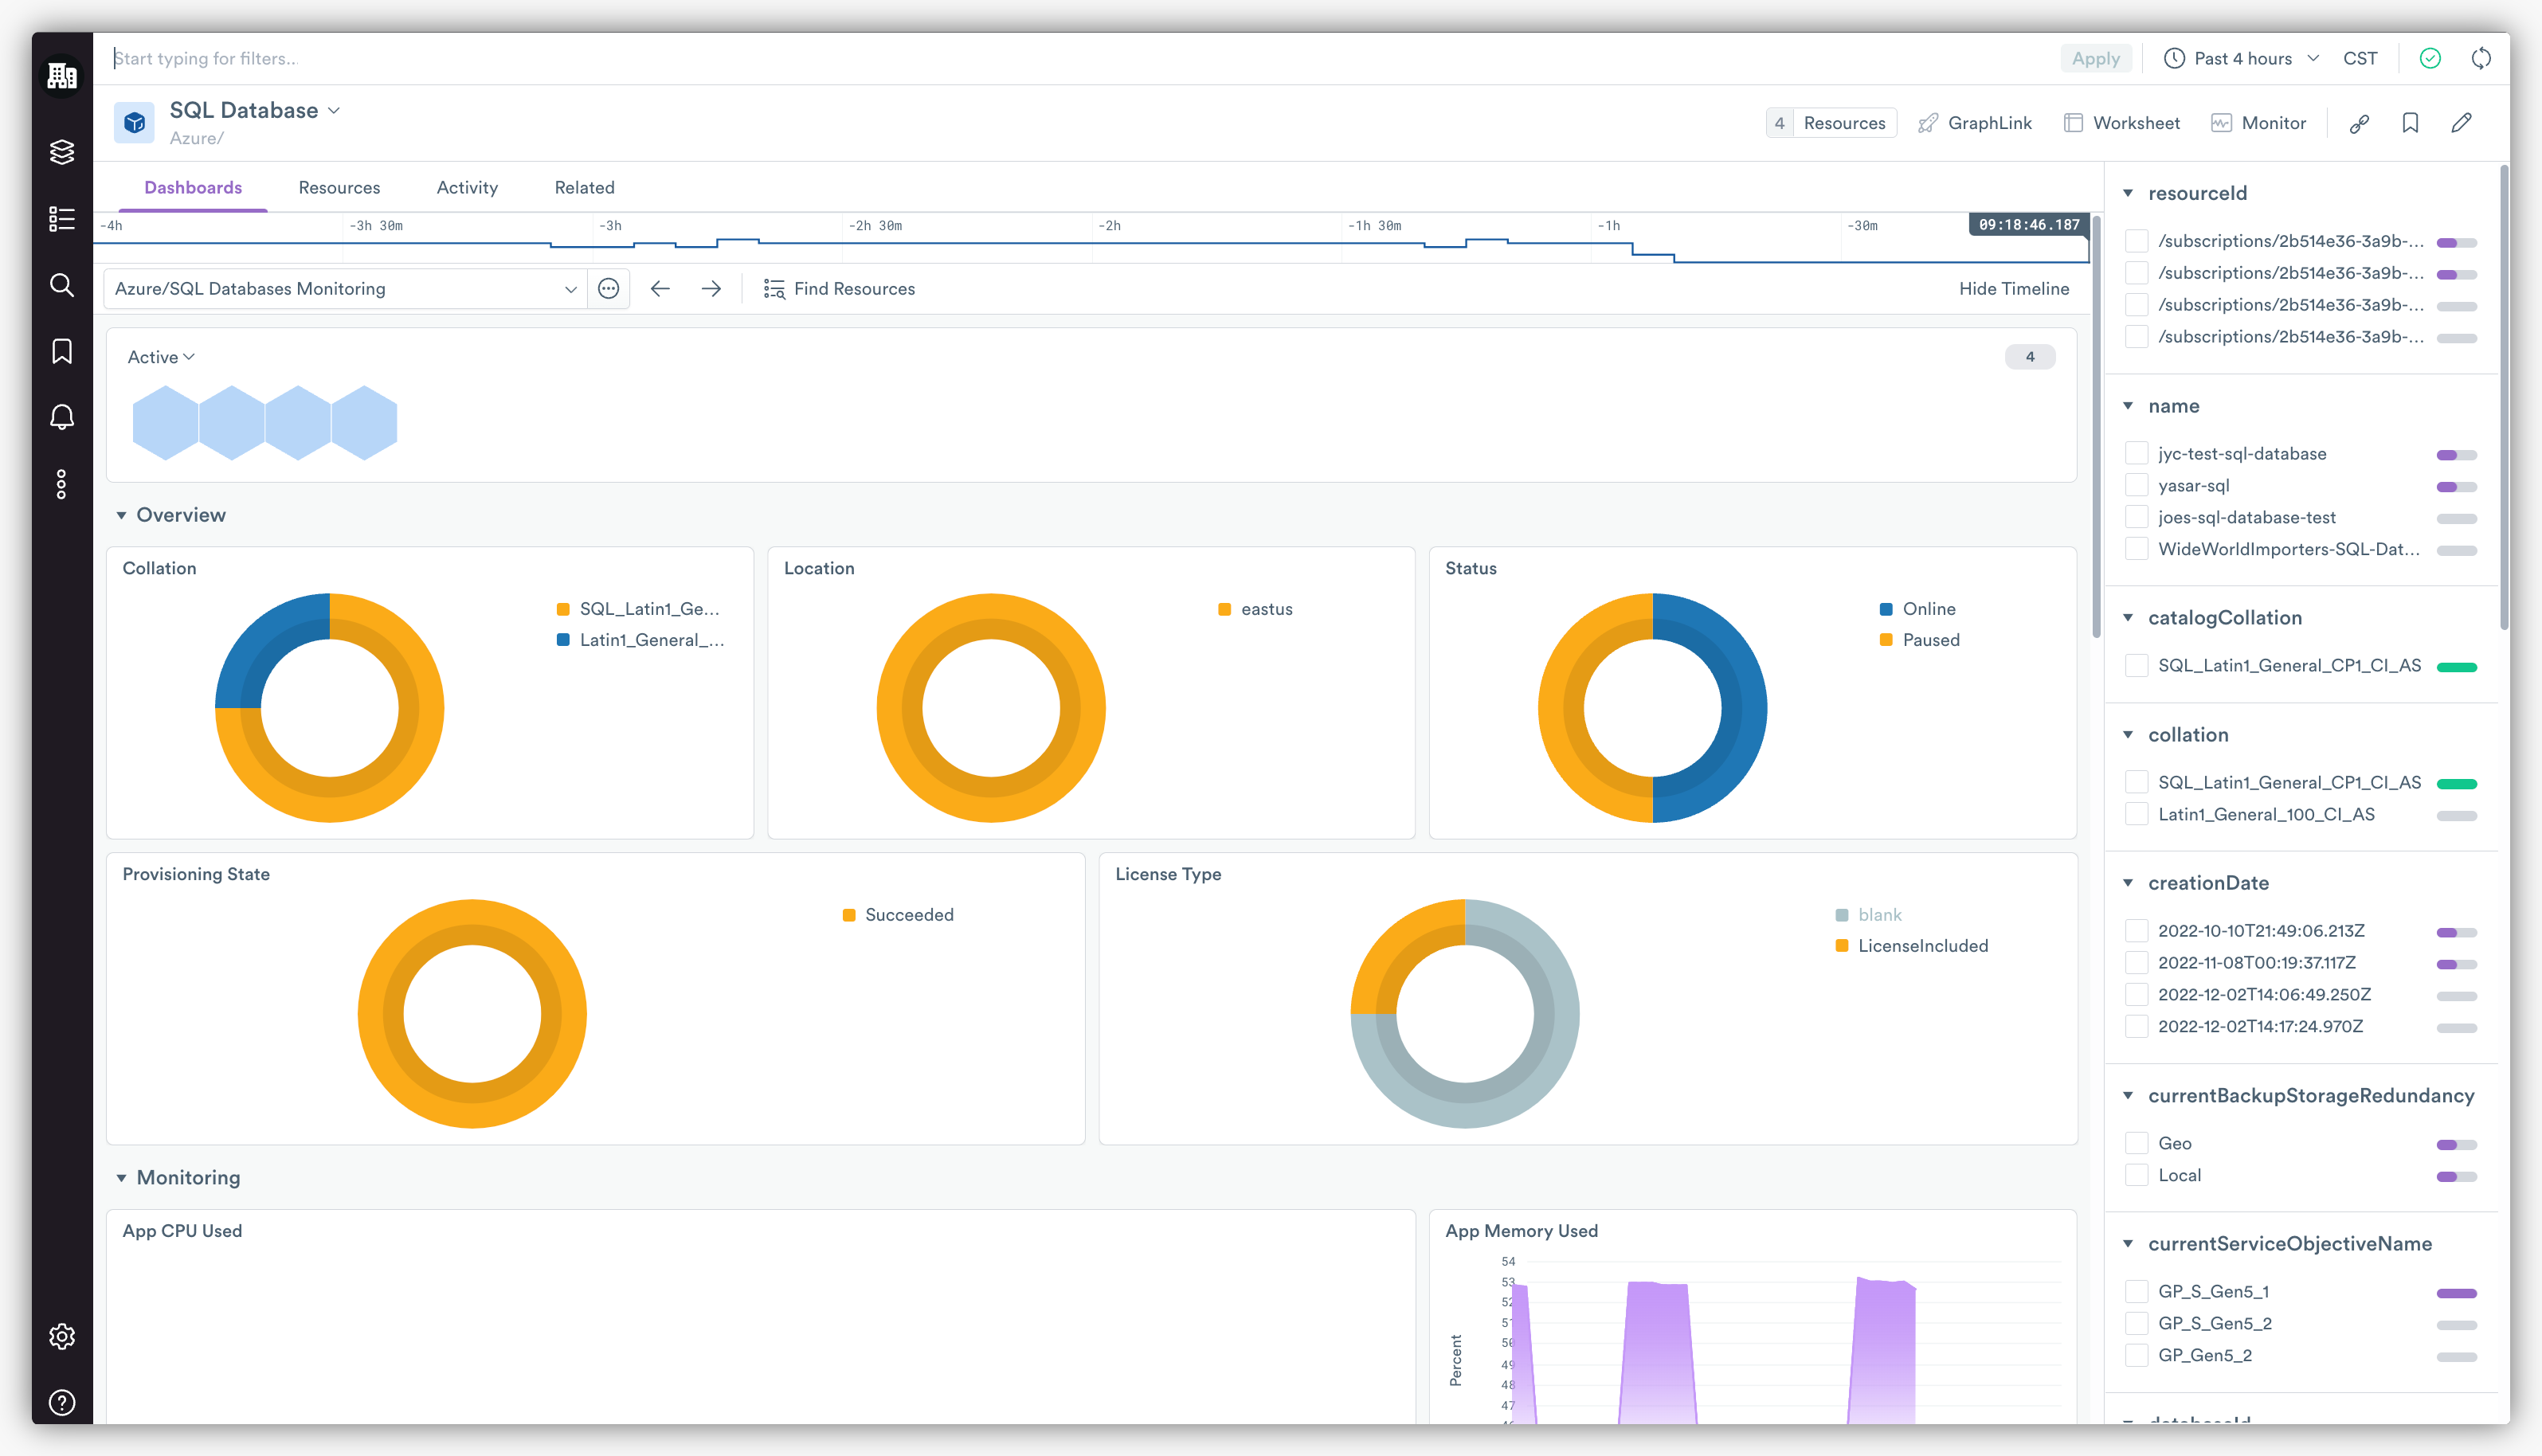
The SQL Databases Monitoring Dashboard (pictured above), which is included in the SQL Databases Resource Dataset, gives you a broad overview of the health and function of all of your SQL Databases broken down by location, state, status, and more. At the bottom of this Dashboard, you’ll also find all the common instance-level metrics typically found like CPU Usage, Memory Usage, and similar. Use this Dashboard to answer questions like, “How long is the average query duration?”, or “Do any of my databases have timeouts or deadlocks?”
Furthermore, click on any database of interest from the honeycomb icons at the top to drill down further into an individual database. This will take you to the SQL Database Monitoring Dashboard, where you will find more detailed information and metrics around resource usage, database connections, and a table of queries sorted by length.
Datasets
Behind the two previously mentioned Dashboards are eleven Datasets that feed them with crucial information from logs, metrics, and other critical telemetry. Some of the more interesting Datasets are SQL Database Logs, SQL Database Metrics, and SQL Database Query Logs that you can use to build advanced Monitors, or provide context when troubleshooting SQL Databases. Please check out the SQL Database sub-page to see all included Datasets.
Monitor Templates
Lastly, the Azure App provides these four Monitor templates to make alerting on SQL Databases as painless as possible:
- SQL Database Serverless Memory less than 20% – Alerts if memory drops below a given threshold for any serverless SQL database.
- SQL Database Storage Space Used greater than 80% – Alerts if the used storage space climbs over a given threshold (default 80%).
- SQL Database Serverless CPU Threshold – Alerts on CPU usage above a given threshold for any serverless SQL Database.
- SQL Database CPU Threshold – Alerts on CPU usage above a given threshold.
SQL Managed Instance
SQL Managed Instance provides an intelligent cloud database service combining the broadest SQL Server engine compatibility (back to SQL Server 2008) with the benefits of a fully managed, up-to-date platform as a service. With the Observe Azure App, you can easily get real-time insights into your SQL Managed Instances and individual instance performance.
Dashboards
The Azure App provides two Dashboards — the SQL Managed Instance Monitoring Dashboard, and the SQL Managed Instance Database Monitoring Dashboard — to help you monitor and keep track of the state of your SQL Managed Instances. First, let’s take a closer look at the SQL Managed Instance Dashboard (pictured below).
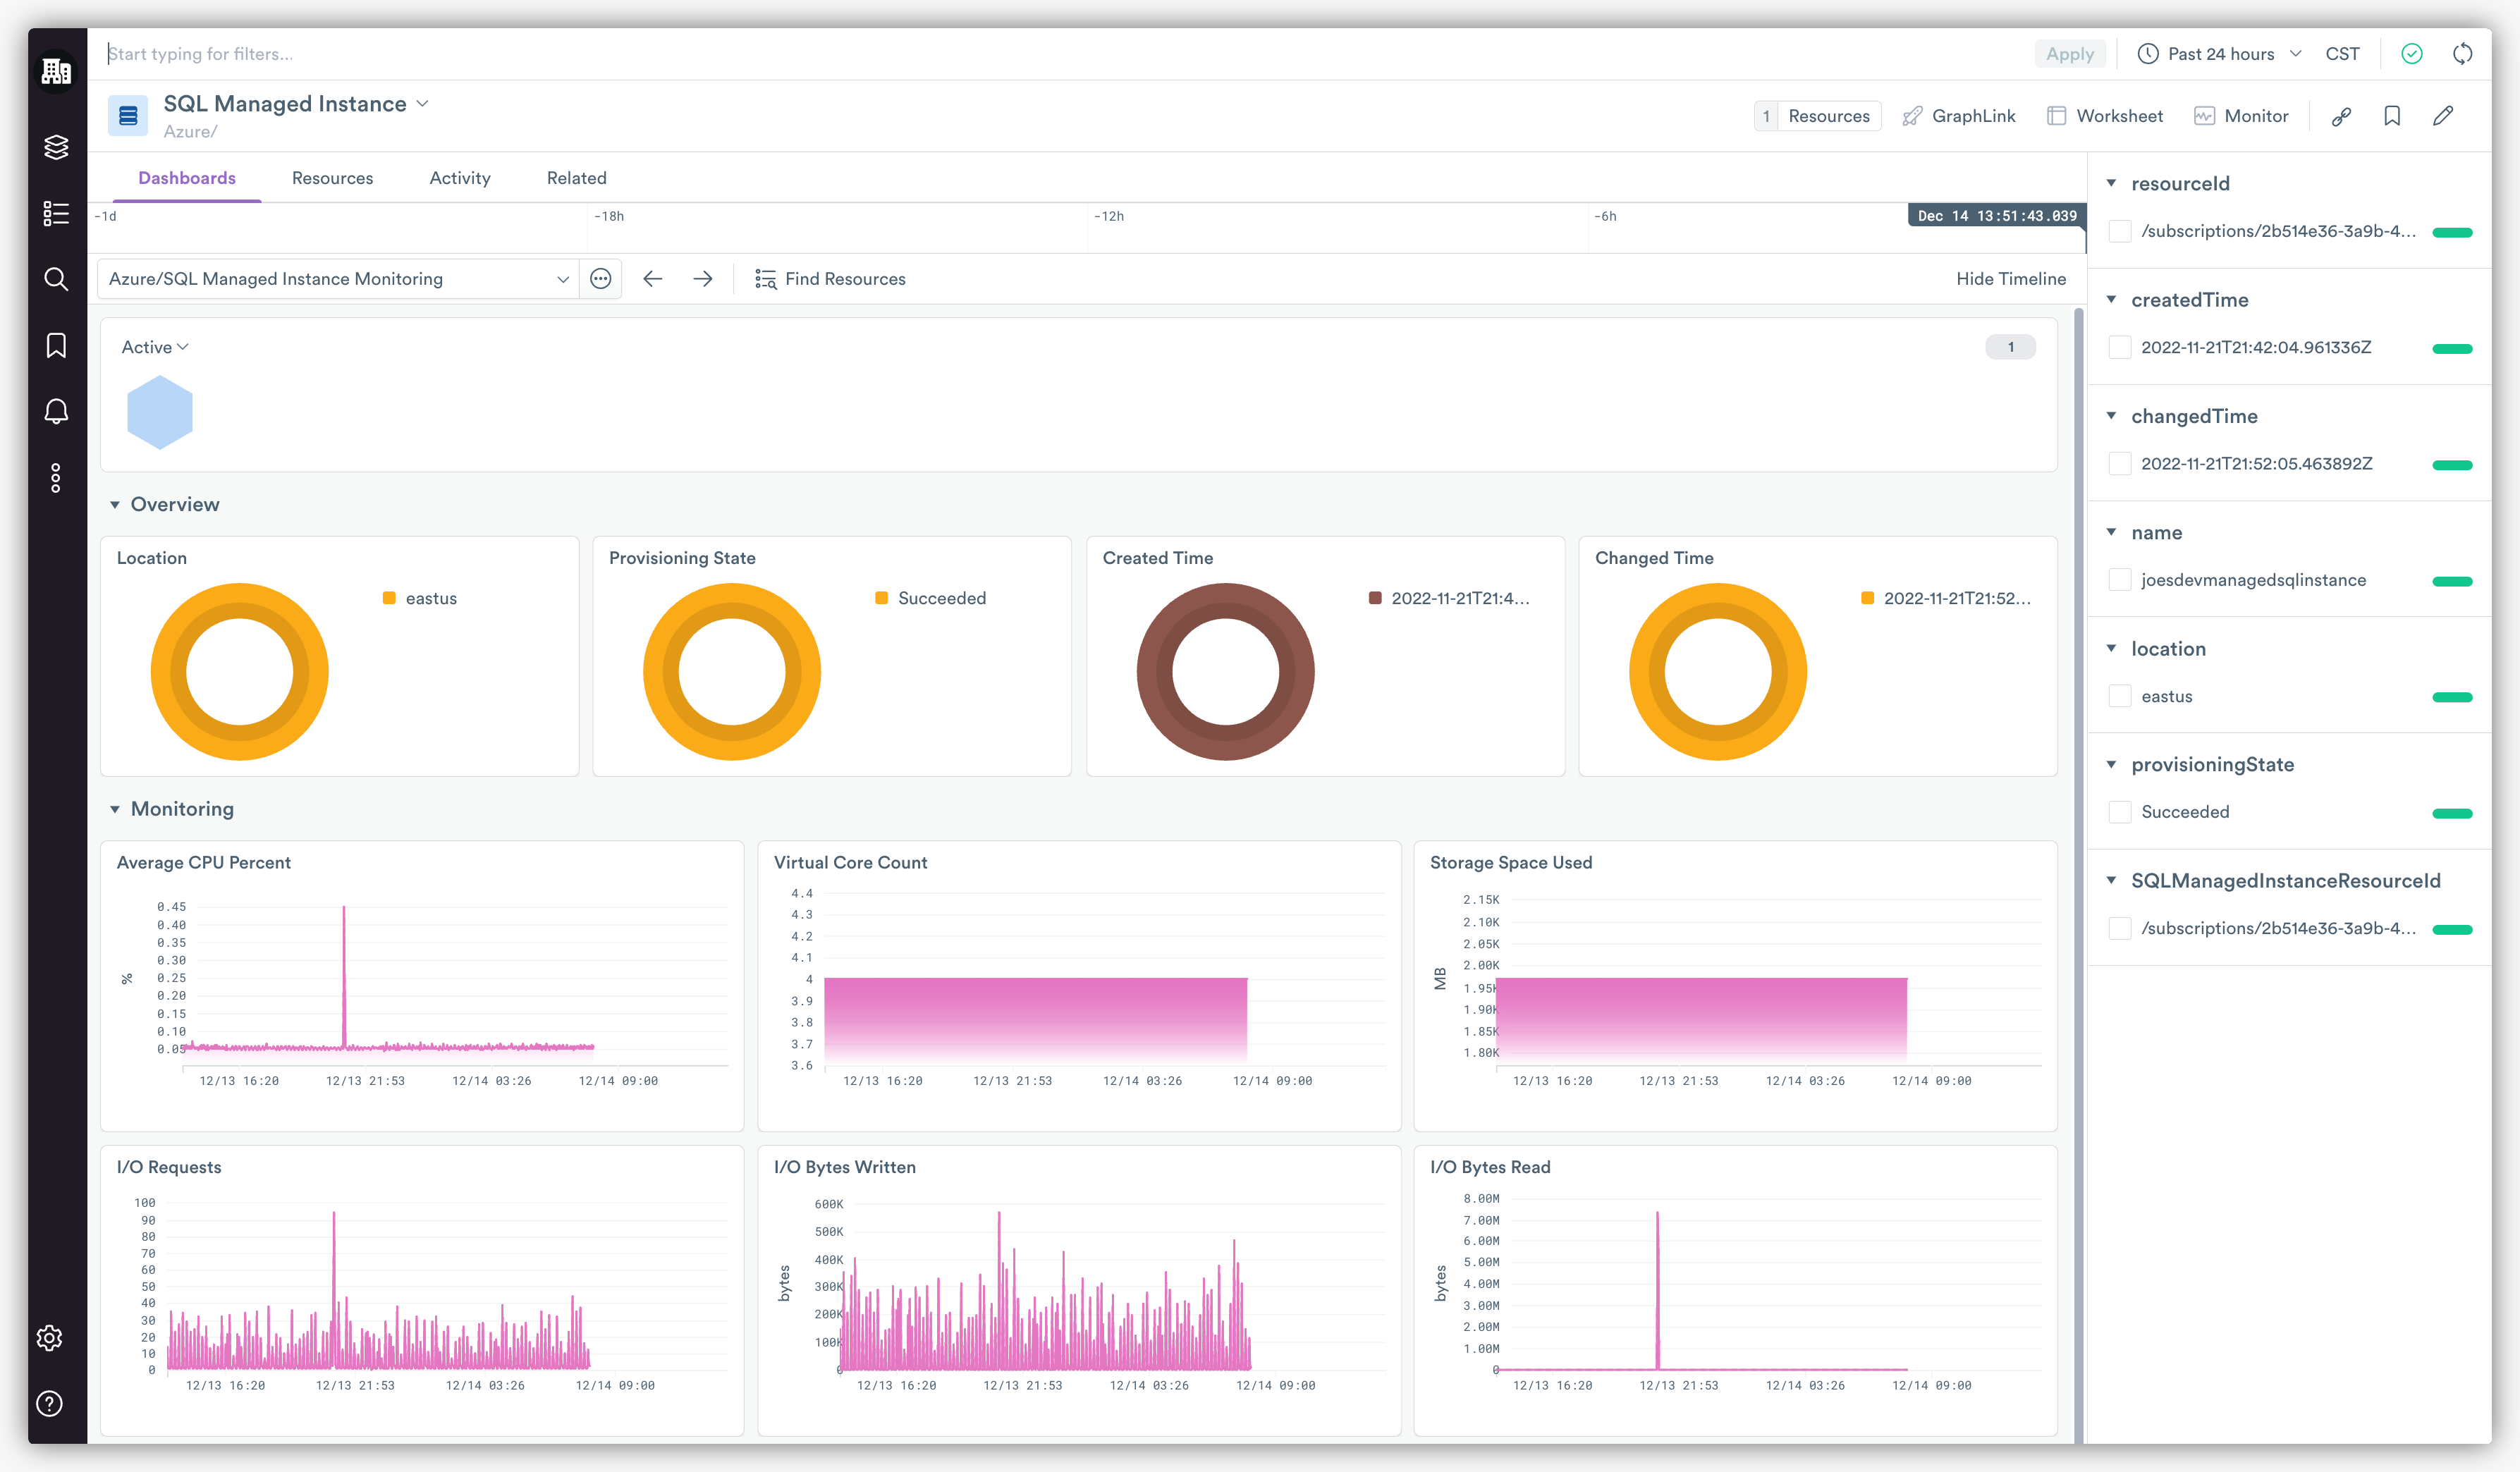
At a glance, this Dashboard provides a broad overview of all your SQL Managed Instances and provides you with advanced resource metrics like CPU Usage, Storage Space Used, and various I/O-related metrics, vital to understanding the performance of your SQL Managed Instances. This Dashboard can help you answer questions like, “Which Databases are associated with my SQL Managed Instances?”, or “What resources are my databases using, and at what rate?”
Simply drill down to an SQL Managed Instance of interest from the honeycomb icons at the top to be taken to the SQL Managed Database Instance Monitoring Dashboard. There you’ll find more detailed information and metrics like the number of Database Connections, Query Duration, and Query Wait, to name a few.
Datasets
In addition to these two Dashboards, the Azure App also includes eight Datasets to help you dig further into observability data from your SQL Managed Instances. Just to name a few, you can expect to find the SQL Managed Instance Logs Dataset, the SQL Managed Instance Metrics Dataset, and the SQL Managed Instance Database Error Logs Dataset. Please check out the SQL Managed Instance sub-page to see all included Datasets.
Monitor Templates
Lastly, the Azure App brings with it two Monitor templates to make alerting on SQL Managed Instances in Azure turnkey. Use these Monitors as is, edit them, or create your own custom Monitors using these templates to alert on the things you care about.
- SQL Managed Instance CPU Threshold – Alert when the CPU percent of a SQL Managed Instance exceeds a threshold for a given period.
- SQL Managed Instance Storage Space Used greater than 80% – Alert when storage space allocated SQL Managed Instance exceeds 80% for a given time period.
Virtual Machines
Azure Virtual Machines are a popular form of an on-demand, scalable cloud computing resource offered by Azure that is commonly used to develop and test applications in the cloud and extend data centers. The Observe Azure App helps you monitor the health and performance of your Virtual Machines with a handful of Dashboards, datasets, and Monitor templates.
Let’s quickly look at some of those features, starting with the included Dashboards.
Dashboards
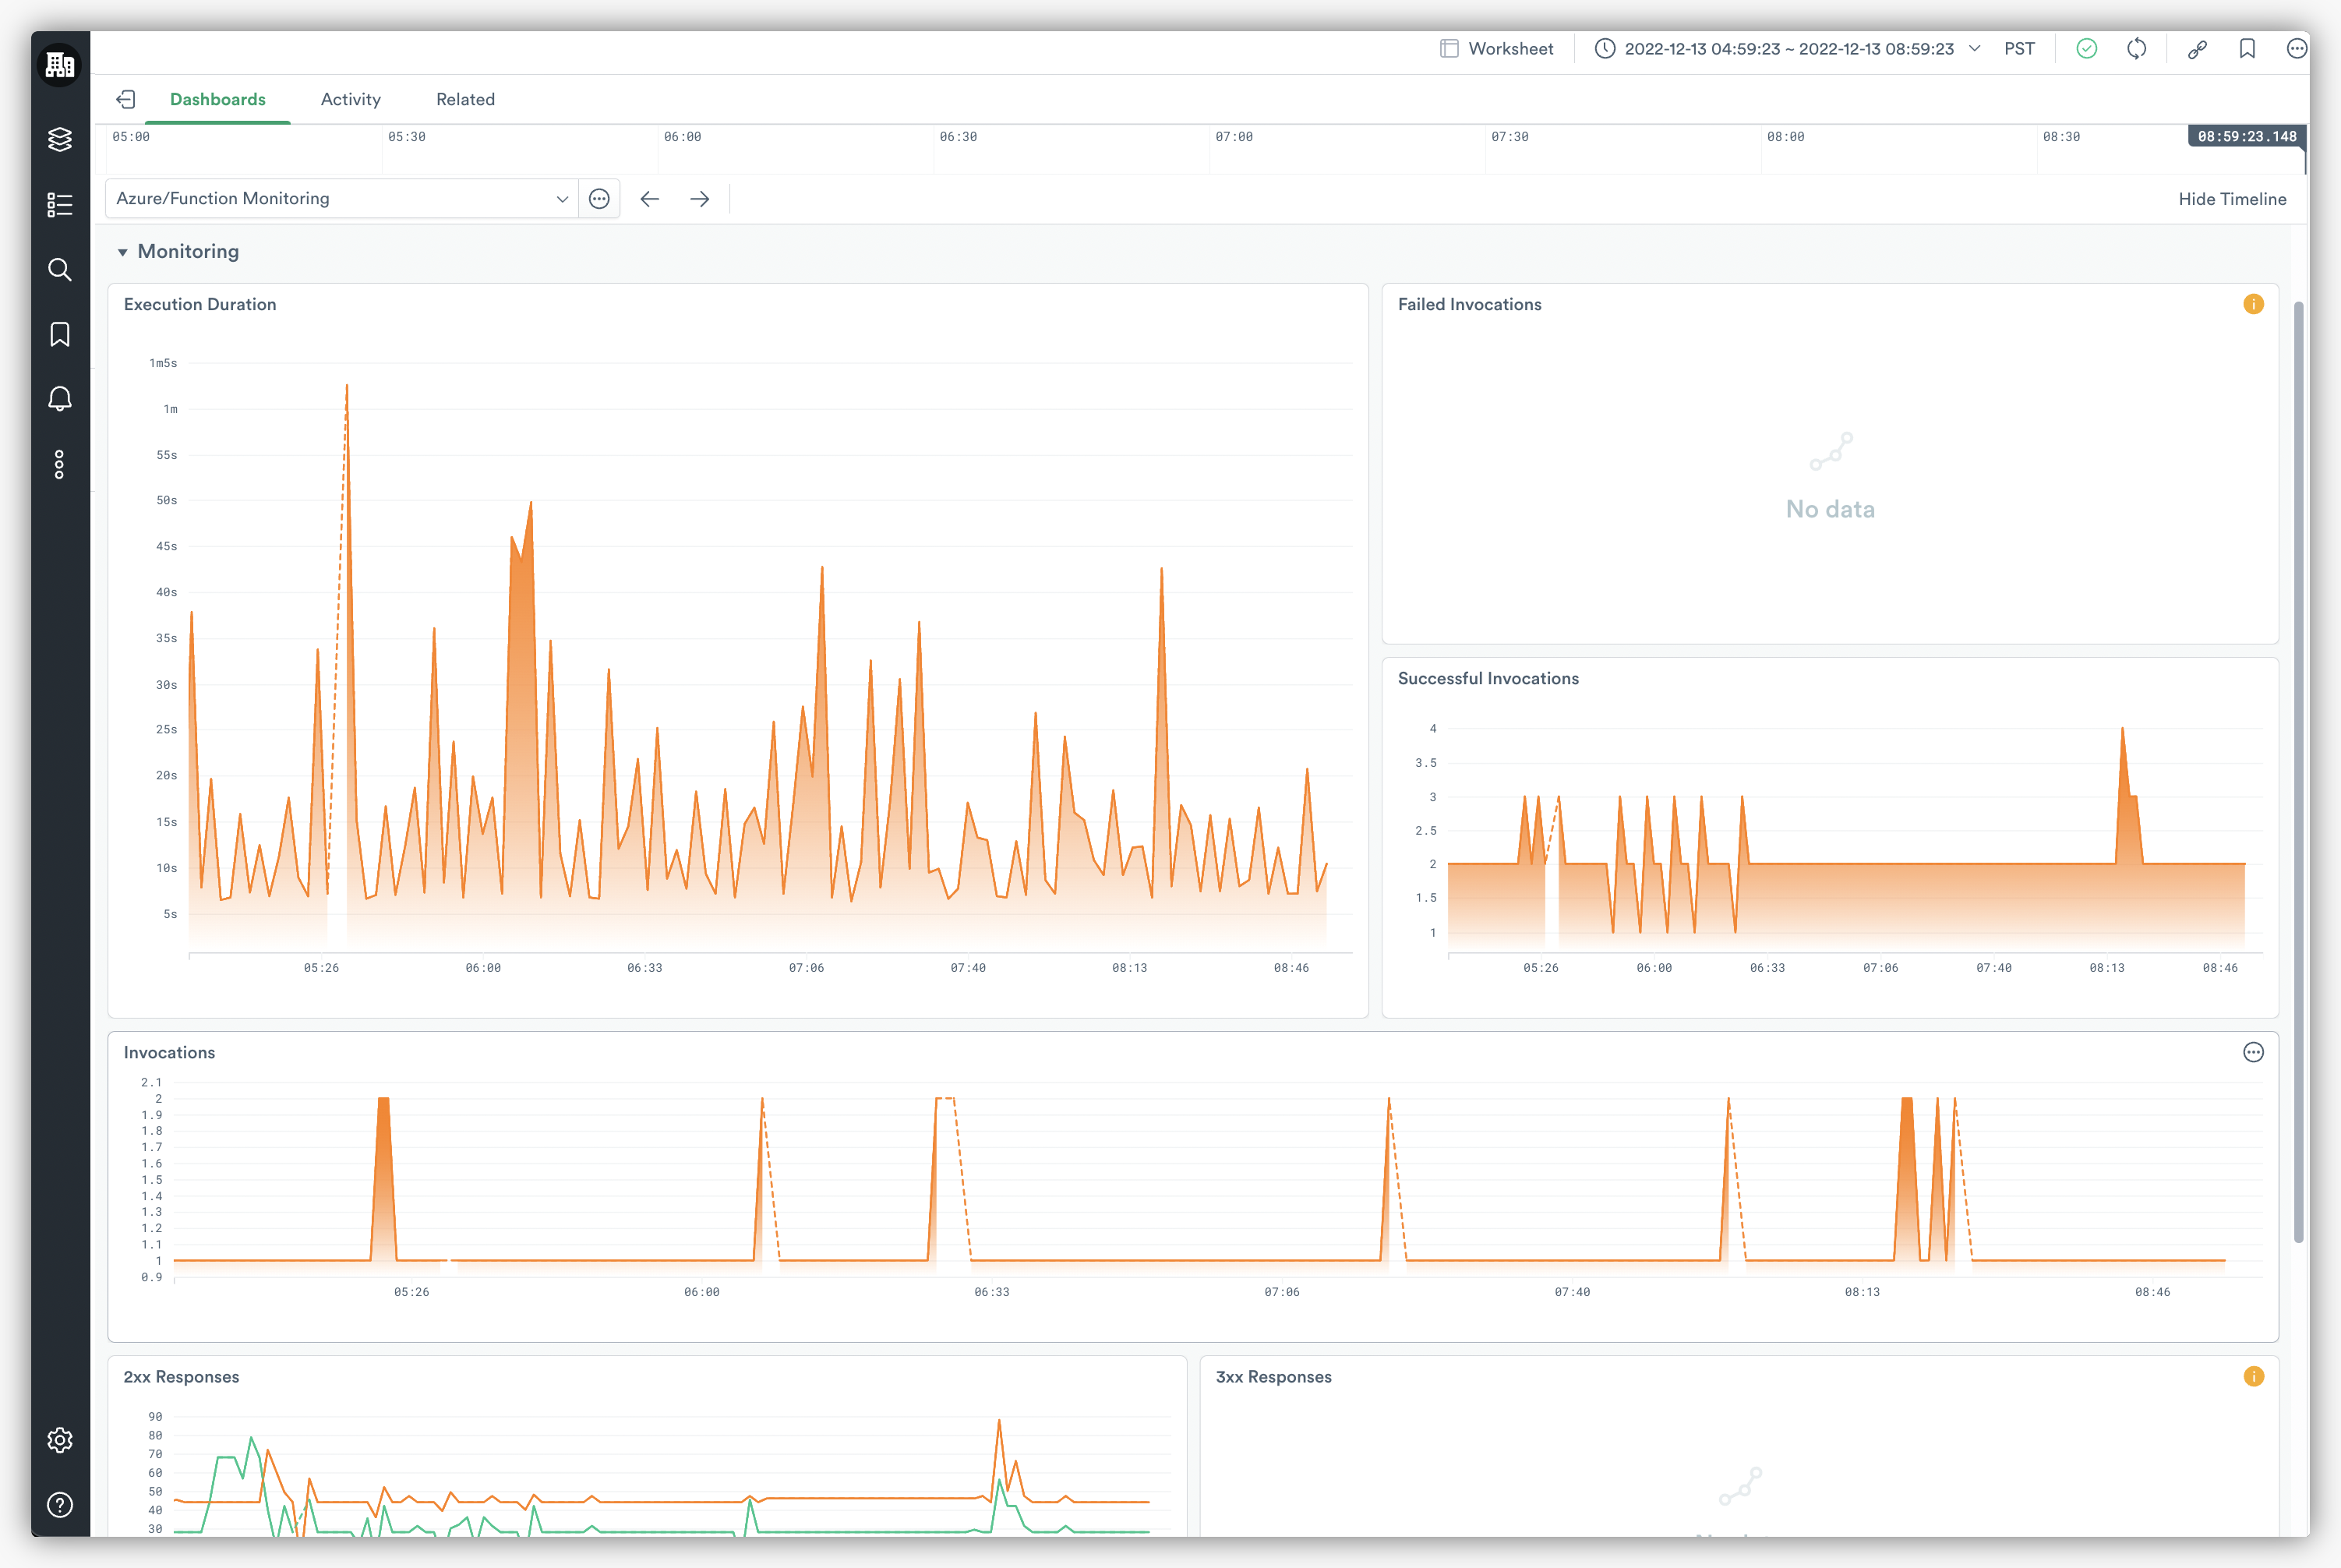
The Azure App brings with it two Dashboards that allow you to quickly gain insights into the performance of individual virtual machines. The Virtual Machines Monitoring Dashboard (pictured below) summarizes all of your instances broken down by region, state, size, and operating system. With this Dashboard, you can also see key metrics over time for things like CPU Usage, Disk Read & Write Operations, and Network Throughput.
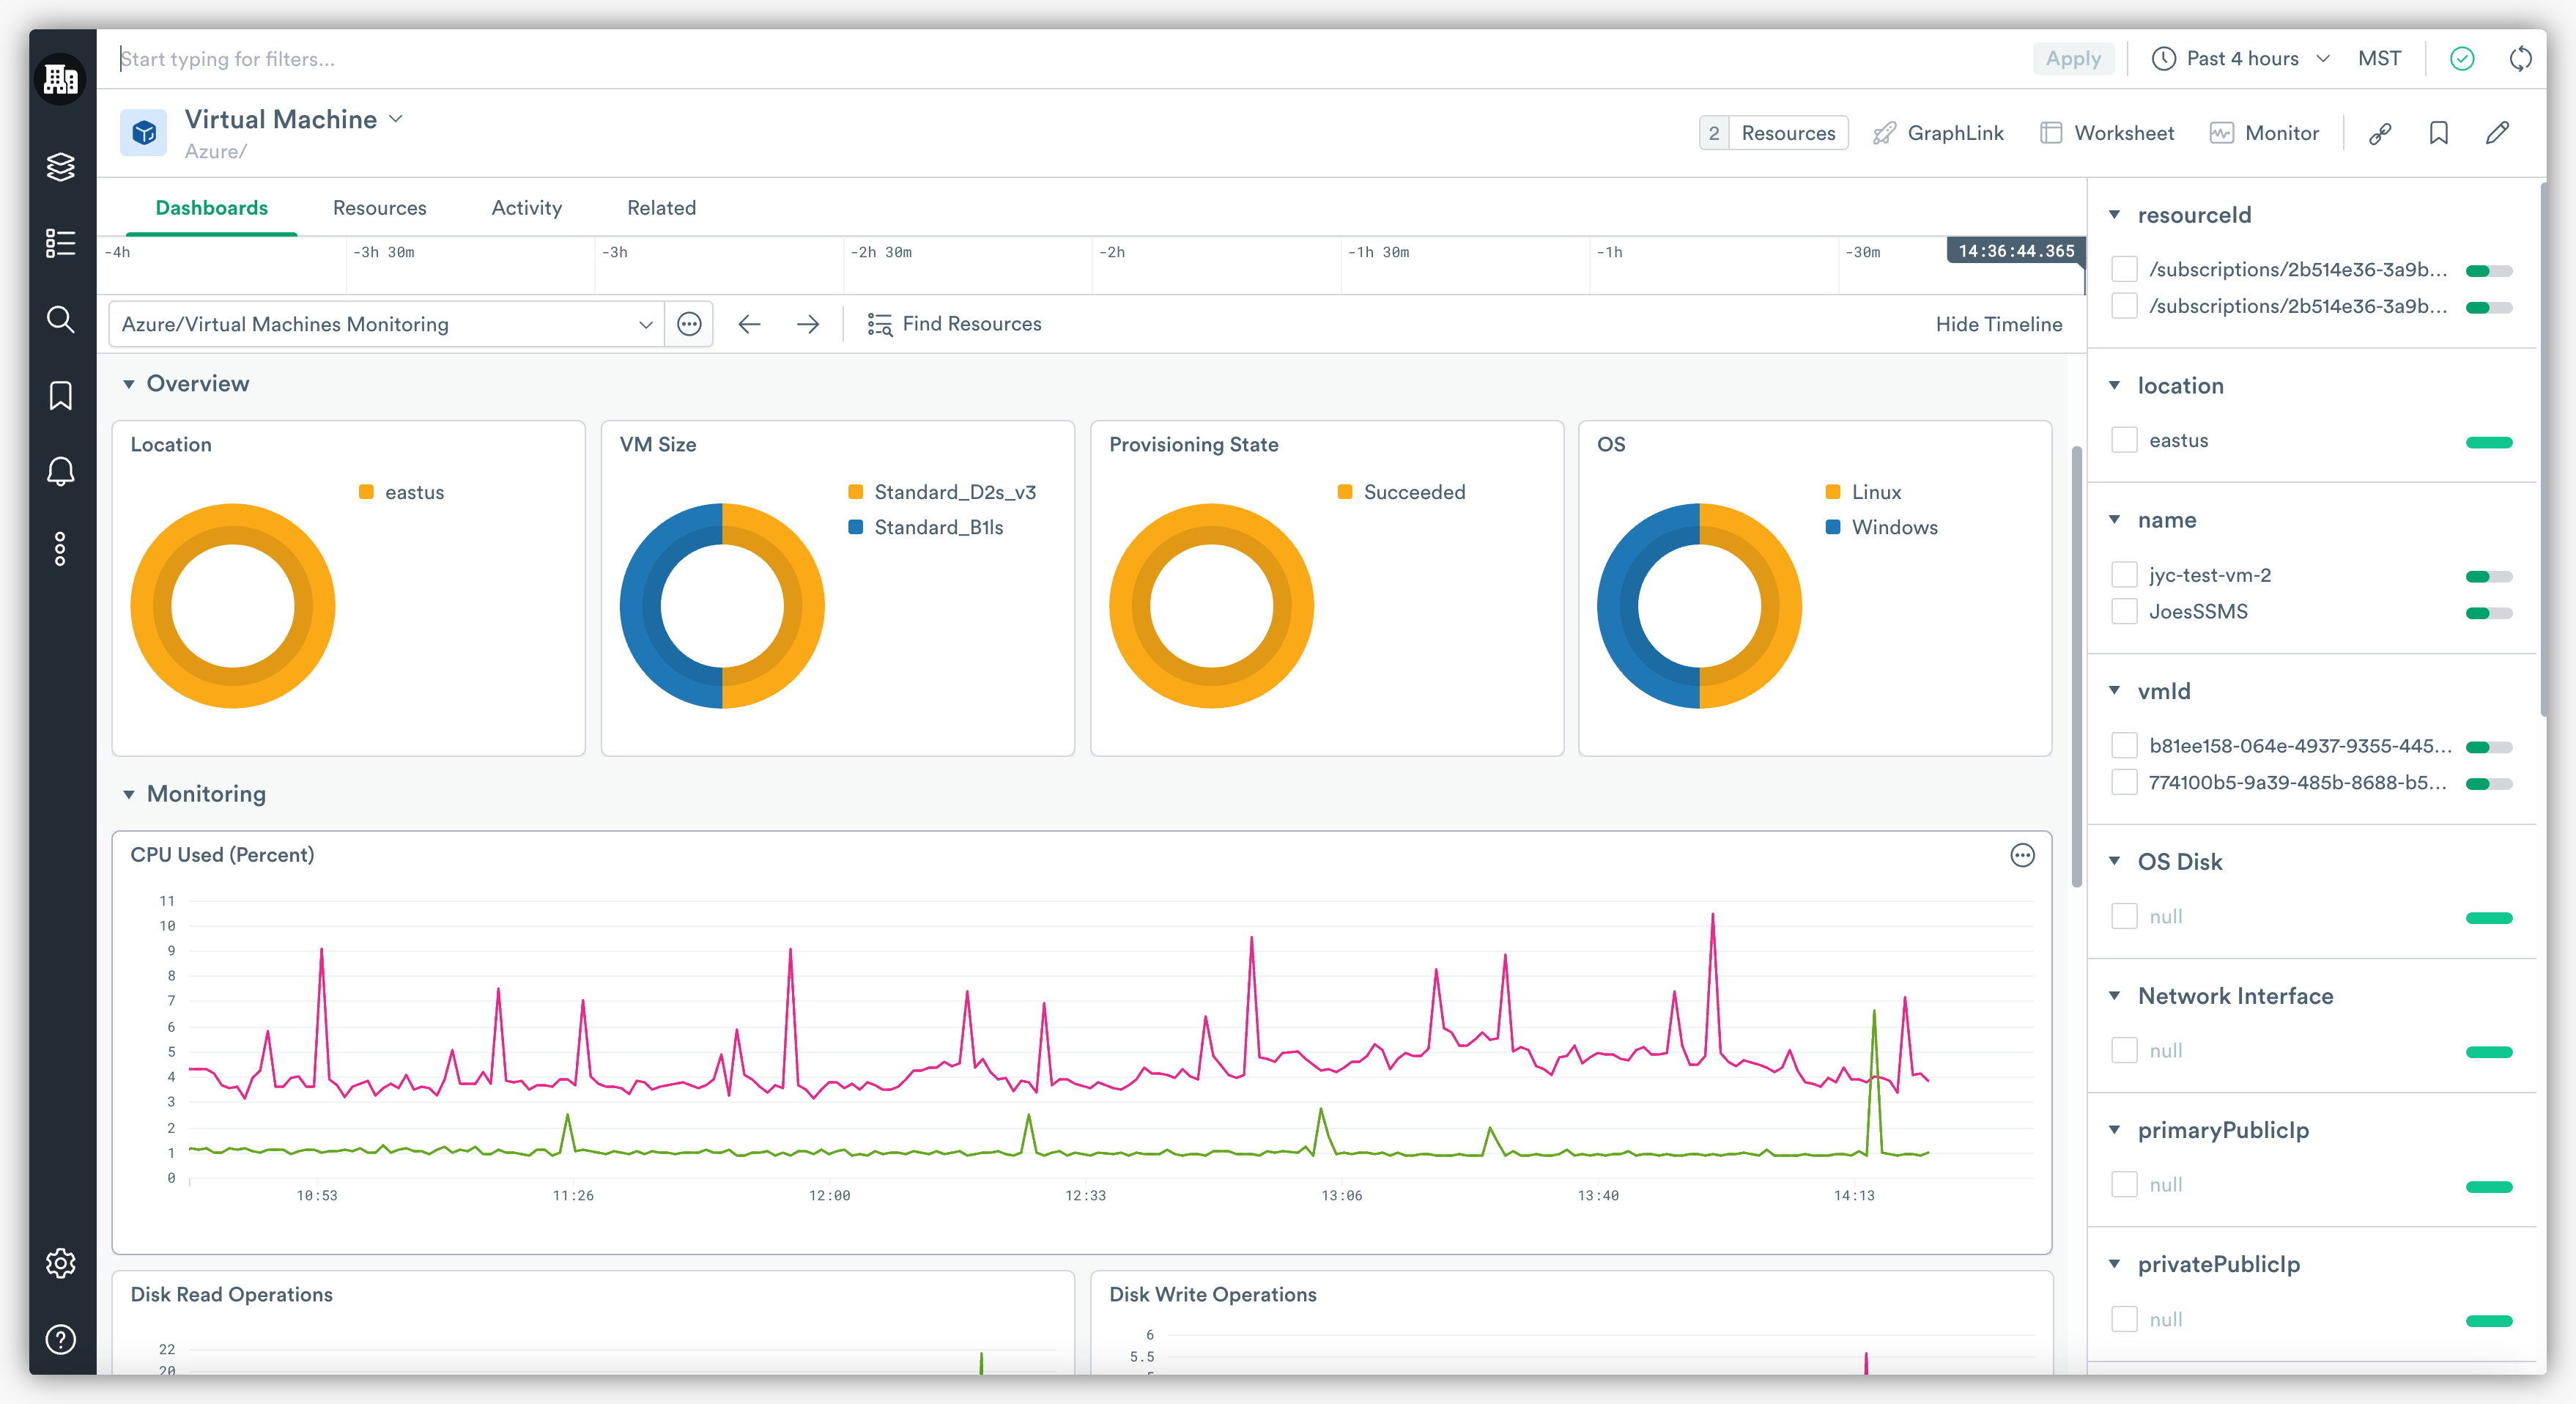
Next, with the Virtual Machine Monitoring Dashboard, you can select an individual instance to drill down into the same metrics seen in the Virtual Machines Dashboard, but with more detail. This dashboard also includes a Metrics Explorer to help you explore all forty-nine of the available metrics for Virtual Machines.
Datasets
There are a total of four Datasets included for the Virtual Machine service in Azure: Virtual Machine Resource, Virtual Machine Metrics, Virtual Machine Disk, and the Network Interface Resource Datasets. With these Datasets, you can deep dive into the details of individual virtual machines and their telemetry over time, or use them when troubleshooting more nuanced issues.
In addition to gaining more context around issues, you can use Datasets like the Virtual Machine Metrics Dataset to create your own custom Dashboards with the metrics you and your team care about.
Monitor Templates
Here are the included sample Monitors to enable proactive alerting on changes in the health of your virtual machines.
- CPU Threshold – alerts when any Virtual Machine’s CPU percentage is above a given threshold.
- Available Memory less than 5GB – alerts when any Virtual Machine’s “available memory bytes” drops below a given threshold.
- Disk Utilization over 80% – alerts when any Virtual Machine’s disk IOPS consumed percentage spikes above a given threshold.
Note: The Azure App does not monitor the operating system itself or processes running on an Azure Virtual Machine. Please install the Observe Host Monitoring App for enhanced monitoring of Azure Virtual Machines.
What Else Can I Do With the Azure App?
Now that we’ve covered the content included in the Azure App and the basic ways you can use it, let’s dive deeper into how else you can use this rich telemetry (Datasets) in Observe.
In total, the Observe Azure App brings with it thirty-eight Datasets from a wide variety of data sources inside your Azure environments. With the Data Graph, you can link these Datasets together to get full traceability between your Azure services or correlate them with other data you already have in Observe — which is where the real power of Observe lies.
Observe Apps aren’t just about observing a particular service, but rather making it easier to correlate that data with other observability data you already have — something no other SaaS observability product can do.
Let’s take a look at a few powerful things this data can allow you to do.
- Correlate data from the SQL Database Audit Logs Dataset with Observe’s natural ability to show how resources change over time to get a complete picture of what’s changed in your environment, who changed it, and when it changed.
- Create a custom Dashboard with a “bird’s-eye view” of your entire Azure environment using any combination of the 768 metrics provided by the five included metrics-related Datasets.
- Correlate traces from OpenTelemetry with the SQL Database Logs Dataset, and ultimately to your Customer Tickets, to see when a database issue occurred, why it happened, and how it affected end users.
- Combine your Load Balancing logs with the Network Interface Dataset, and then with the Virtual Machine Dataset to get a detailed view of where network traffic originates from and where it is heading in your environment.
- Link your CI/CD Build logs to the Functions Logs Dataset to get enhanced visibility into failed deployments to your serverless infrastructure.
Getting Started with the Azure App
Find instructions on how to install the Azure App by visiting the Microsoft Azure App page in our docs. There, you’ll also find a detailed guide on how the App works, a full list of the included Dashboards, Datasets, and Monitors, and more use cases. Also, you can visit each service’s documentation (found in the section headers) for details specific to each of the five services this App currently supports.
Lastly, be sure to check out the full list of integrations we currently provide to make even more discoveries from data that you already have in Observe!
If you’re not an Observe customer, but want to get full observability from your CI/CD pipelines with these latest Apps, then click here to get started!


