

Multi-line Logging Strategies

It’s 2 am on a Saturday and you get paged. You open your computer and start searching for an error breadcrumb. You find something but there’s a problem, it’s a stack trace that’s been broken on every new line — which makes it nearly impossible to read it in full.
Multi-line logs can be the bane of an SRE’s existence. Most logs are well-behaved and use a new line delimiter (“\n”) to denote where one log message ends and the next begins. As a result, common logging systems like the ELK stack make this assumption and errantly break up multi-line logs. Not all log messages are well-behaved, and it’s common to find things like multi-line stack traces in application error logs.
At Observe we think about log analytics in the following stages. Using this as a map, let’s review how to deal with multi-line logs at each stage.

Collection
Most modern log collectors provide the capability to merge multi-line logs together. For example, our recommended agent, Fluent Bit, has a parser that is very versatile. You supply it with a regular expression that identifies the start of a logline. The parser will merge all of the log lines between that starting expression and the next one.
Parser example
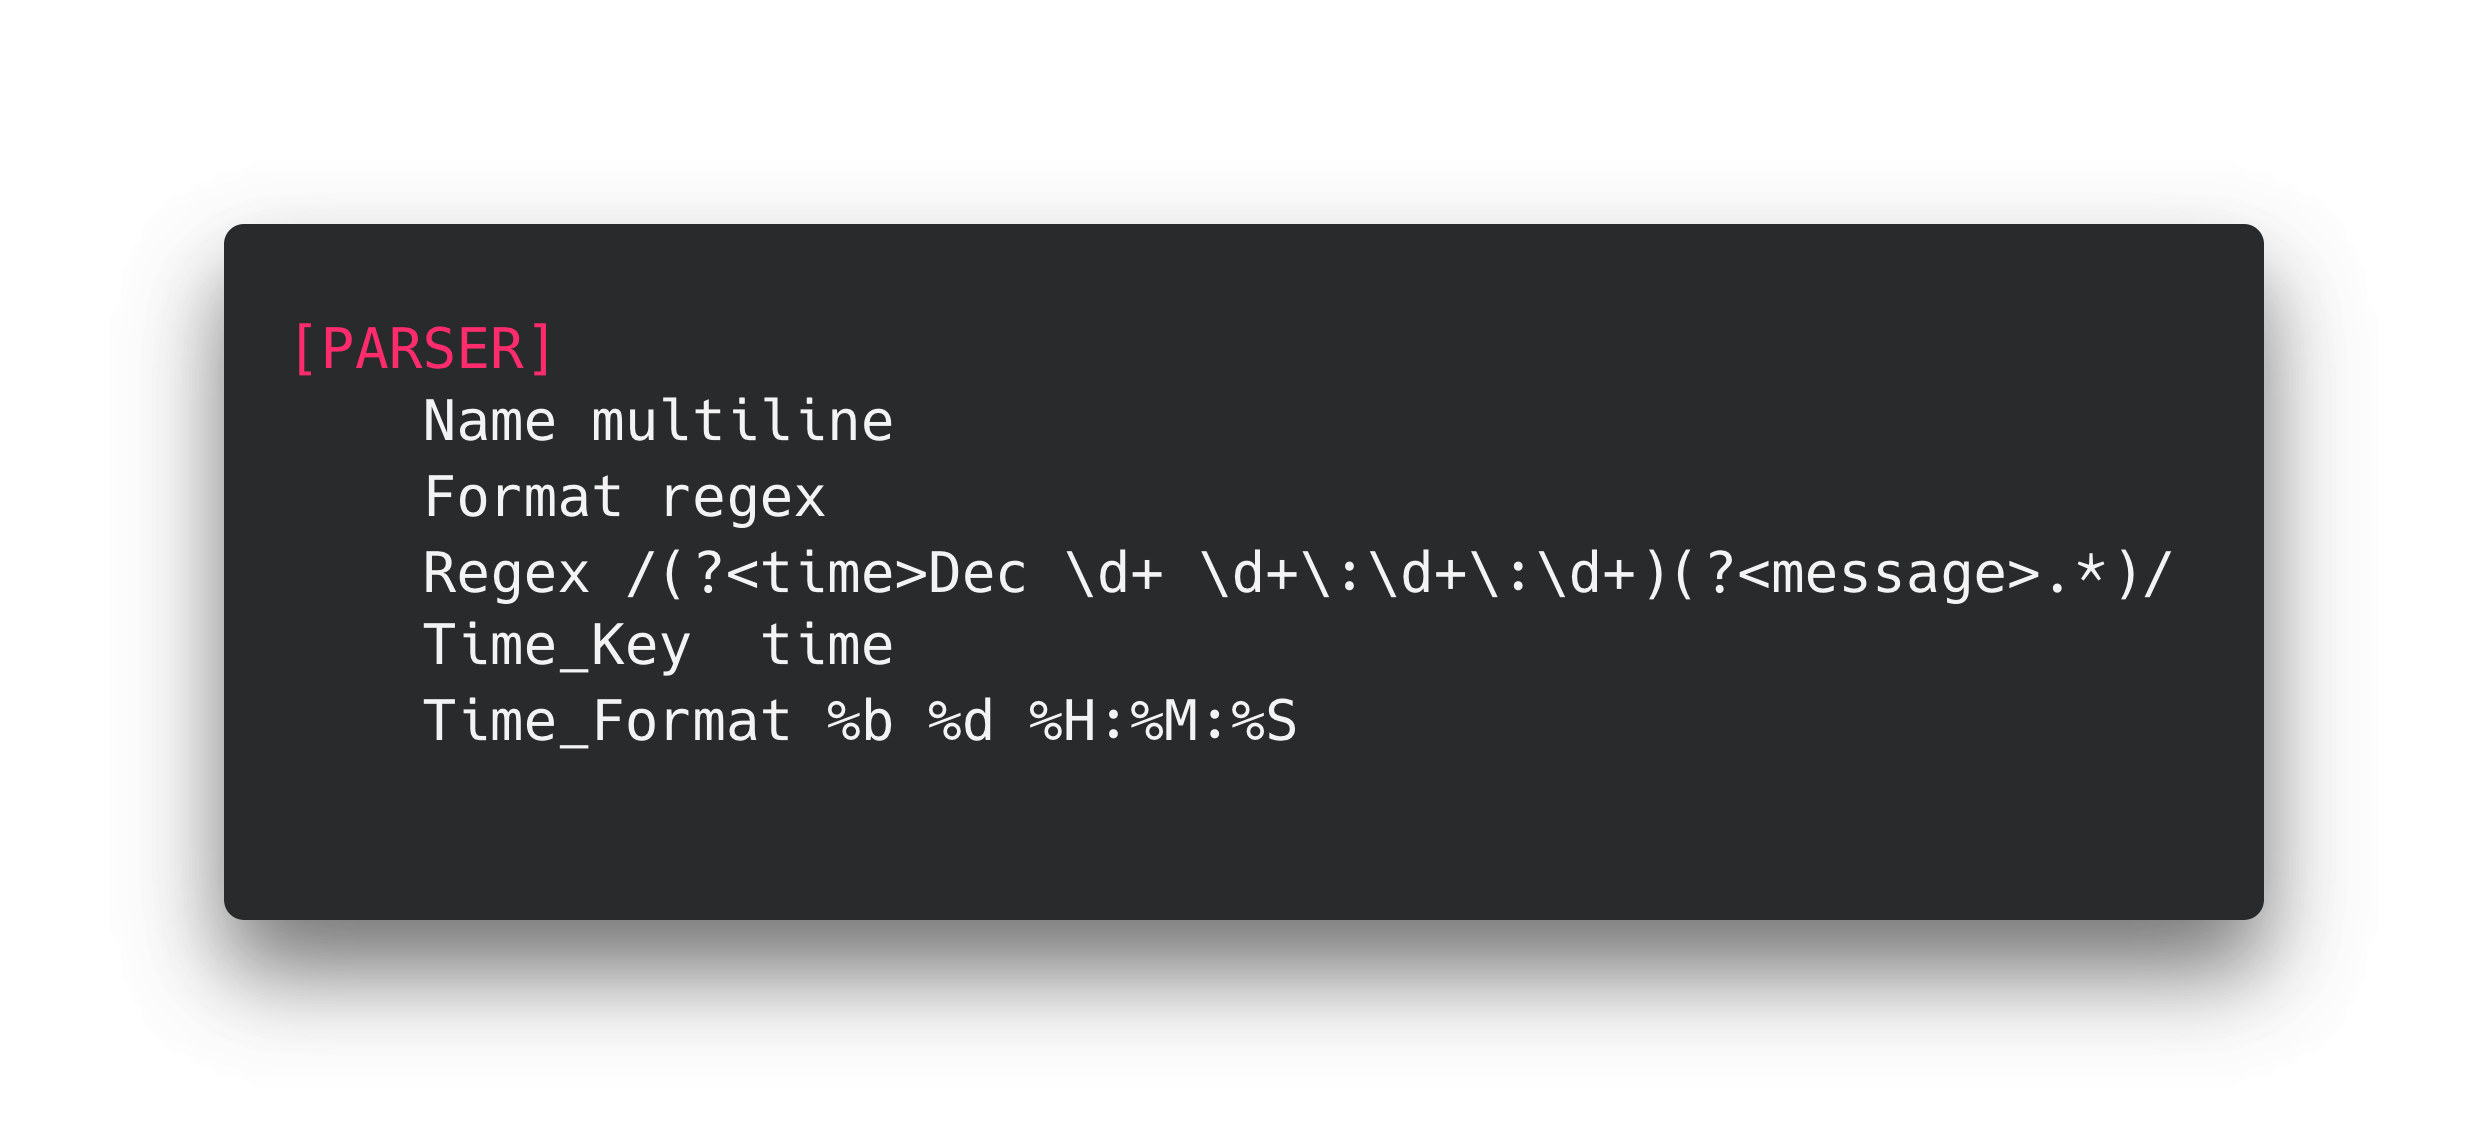
Note: This example should not be used because it assumes that logs only occur in December.
While this is an acceptable way to merge these loglines it does have a few drawbacks:
- Not having a host to run your agent on – Serverless environments or third-party services do not let you host an agent. For example, logs from AWS Lambdas are automatically picked up by Cloudtrail.
- It’s HARD to get these right, and it’s an awful whack-a-mole exercise after you first sort-of-kind-of get it working. Think about how ambiguous it is to know if a given log line starts a new log message or is a continuation of the old one. We have not encountered any widely accepted standard for this and encounter new examples all of the time. Assuming that you know all of the flavors of this ahead of time is a recipe for failure. This applies to collection-time and ingest-time parsing.
- Pushing log parsing configuration to your hosts is PAIN – Being able to configure this in ONE PLACE is a lot more fun than having to distribute this configuration to everywhere you run fluent-bit, or to include deployment into your test/debug cycle when you craft multi-line merging rules.
- Resource consumption – Running these rules is going to consume resources. Depending on how slim your resources are this may be unacceptable with lots of rules. The longer your log lines the more resources you will consume trying to regex match them. We’ve run into situations where this has ballooned when dealing with the occasional 500kB log line.
Forwarding
This is an optional phase that some companies have. In this tier, a customer would create a tier of forwarding servers using open source technologies like Vector and Logstash. There are also commercial offerings that do this, like our friends at Cribl.
You can run logic on the forwarding servers that merge log lines, but there are two main drawbacks of doing it here. First, you need to get the rules right and, secondly, you need to run dedicated infrastructure to handle this. If your use case for a forwarding tier is merging log lines that may be a lot of added overhead. Customers should have additional uses before standing up to this kind of tier.
Ingest
Tools that index data, like Splunk, allow users to specify transformations on data as it is ingested. This is a slightly better approach because the configuration is centralized, which addresses the management challenges introduced in the collection tier. However, it still suffers from needing to get all of the rules right ahead of time. If you mess this up your logs will be split across multiple lines and stuck this way. Some solutions will let you replay logs after fixing rules and happily charge you for that privilege — assuming that you are ok with the downtime from blowing away your indexes and reindexing all of your logs.
Transform and Query – The Observe Way
Observe is the only vendor that allows users to merge log lines on the fly when queried AND when they transform the data. This has many advantages as it allows you to centralize rules, moves processing off of critical infrastructure, avoids having to run a forwarding tier, and is forgiving if — when — you get your rules wrong. Let’s take a look at this in action in a real-life example that happened just a couple of weeks ago.
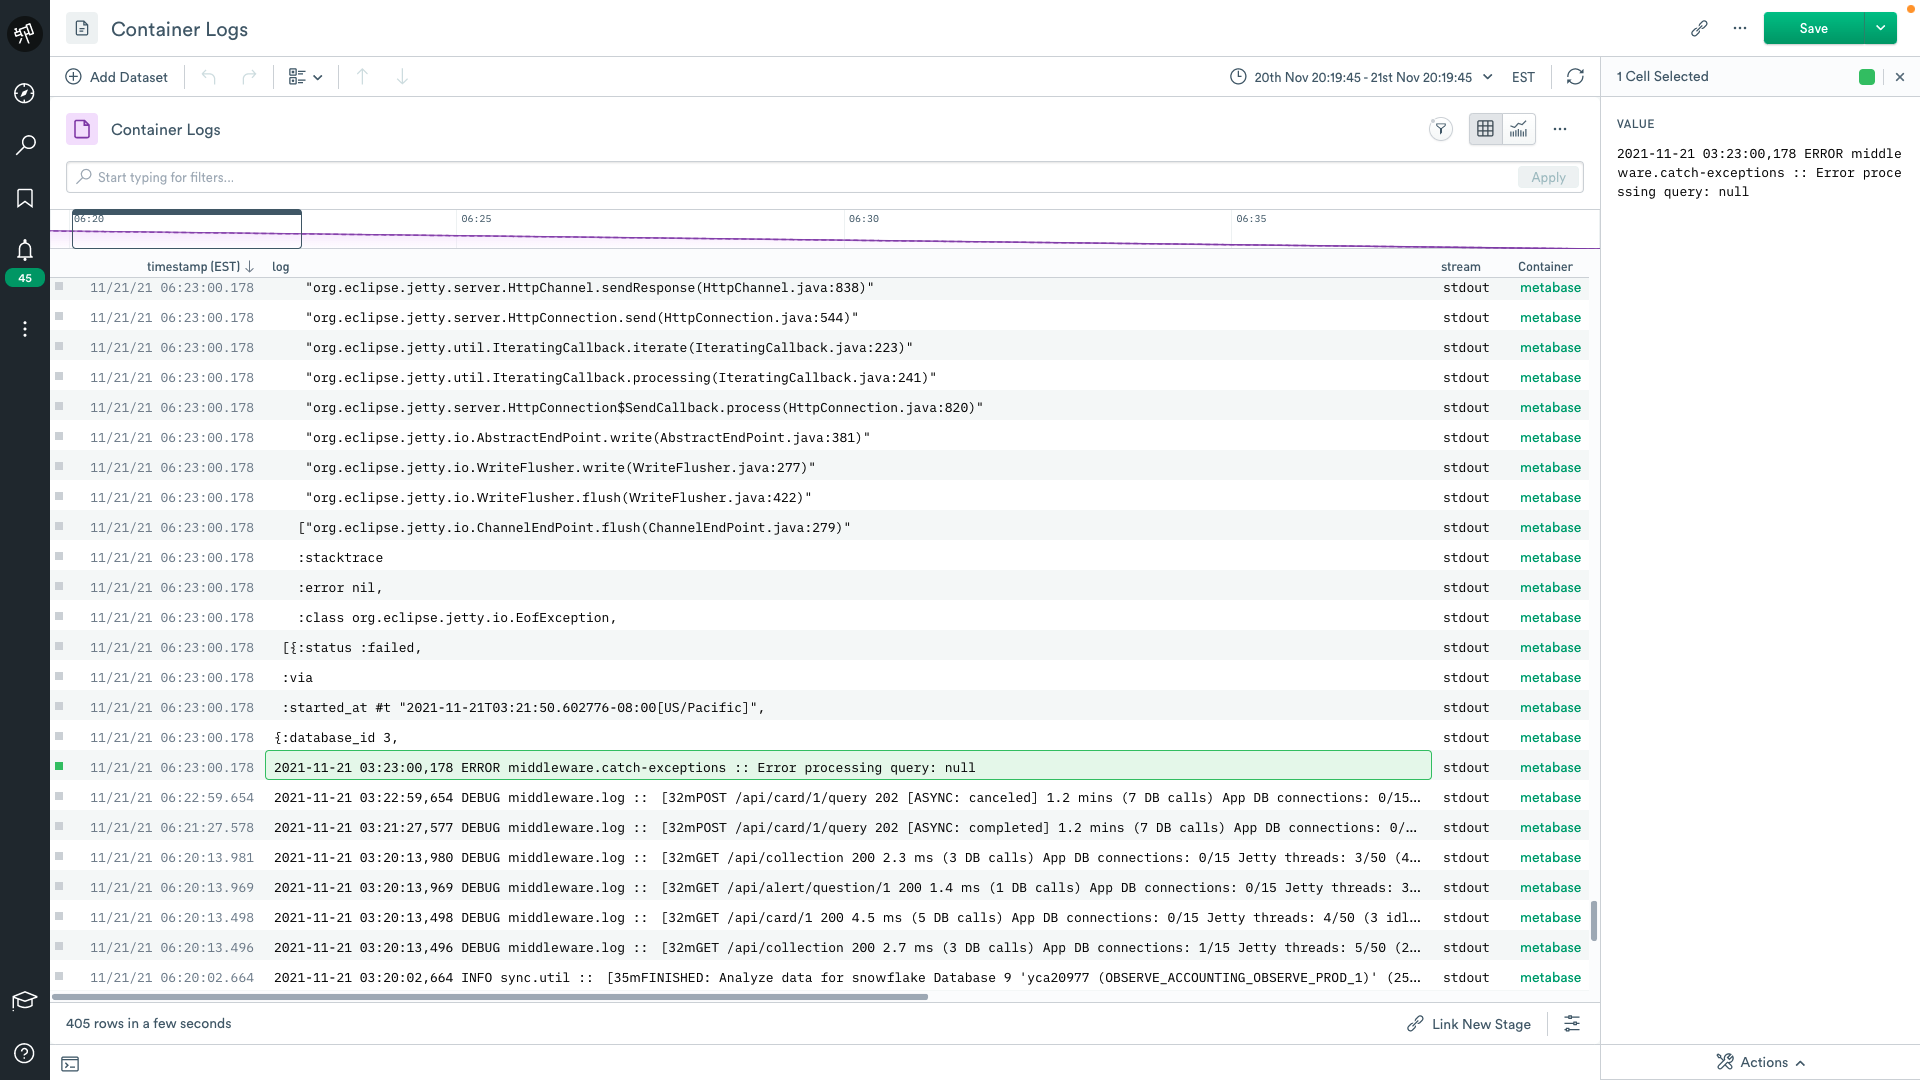
Example: We host an open-source, java-based, BI tool for internal use. One night while observing our container logs, I found some particularly unruly logs.
This was frustrating because I was trying to troubleshoot a burning issue, but the logs had already been collected, ingested, and transformed. Luckily for me, we had just released a new verb in the Observe language, called merge_events. This verb takes arguments very similar to the Fluent Bit parser. Essentially you supply it with a regular expression, a component to group by, and a timestamp. I was able to run the following at query time AFTER the data was already in the system.

This query merged all of the logs that started with an ISO timestamp. Once merged, I had access to all of the analytical capabilities for event data in Observe. While useful for my investigation, I thought it would be even better if I could share this with future users. So I quickly edited our Container Logs dataset so that it contained the merge_events snippet. Now all container logs that stream into our system get merged.

Wrap Up
Multi-line logs are tricky to parse, but there is no shortage of ways to merge them into a single event. You can pick a strategy from above with the right mix of benefits and tradeoffs for your environment. A little forethought may save you a lot of pain in a future incident.
If you think Observe can help with your logs feel free to sign up for a trial or demo.


