How Observe Uses…Observe! [Part I]
 By Knox Lively,September 19, 2022
We dogfooded the crap out of it!
Introduction
Since we came out of stealth mode two years ago, we’ve added more than sixty customers, but no one has used Observe more than our first customer has…Observe!
The concept of dogfooding isn’t new, but observing an observability product has unique challenges – and benefits. It’s safe to say that Observe wouldn’t be half the product it is today if we didn’t rely on it as our sole observability tool. Our observability environment, which we affectionately call “O2”, is the watcher that watches our watcher and our ultimate source of truth when it comes to observability at Observe.
Keep reading to see how we use 02, some basic principles we found helpful along our own journey towards observability, and to see just how “meta” this series can get.
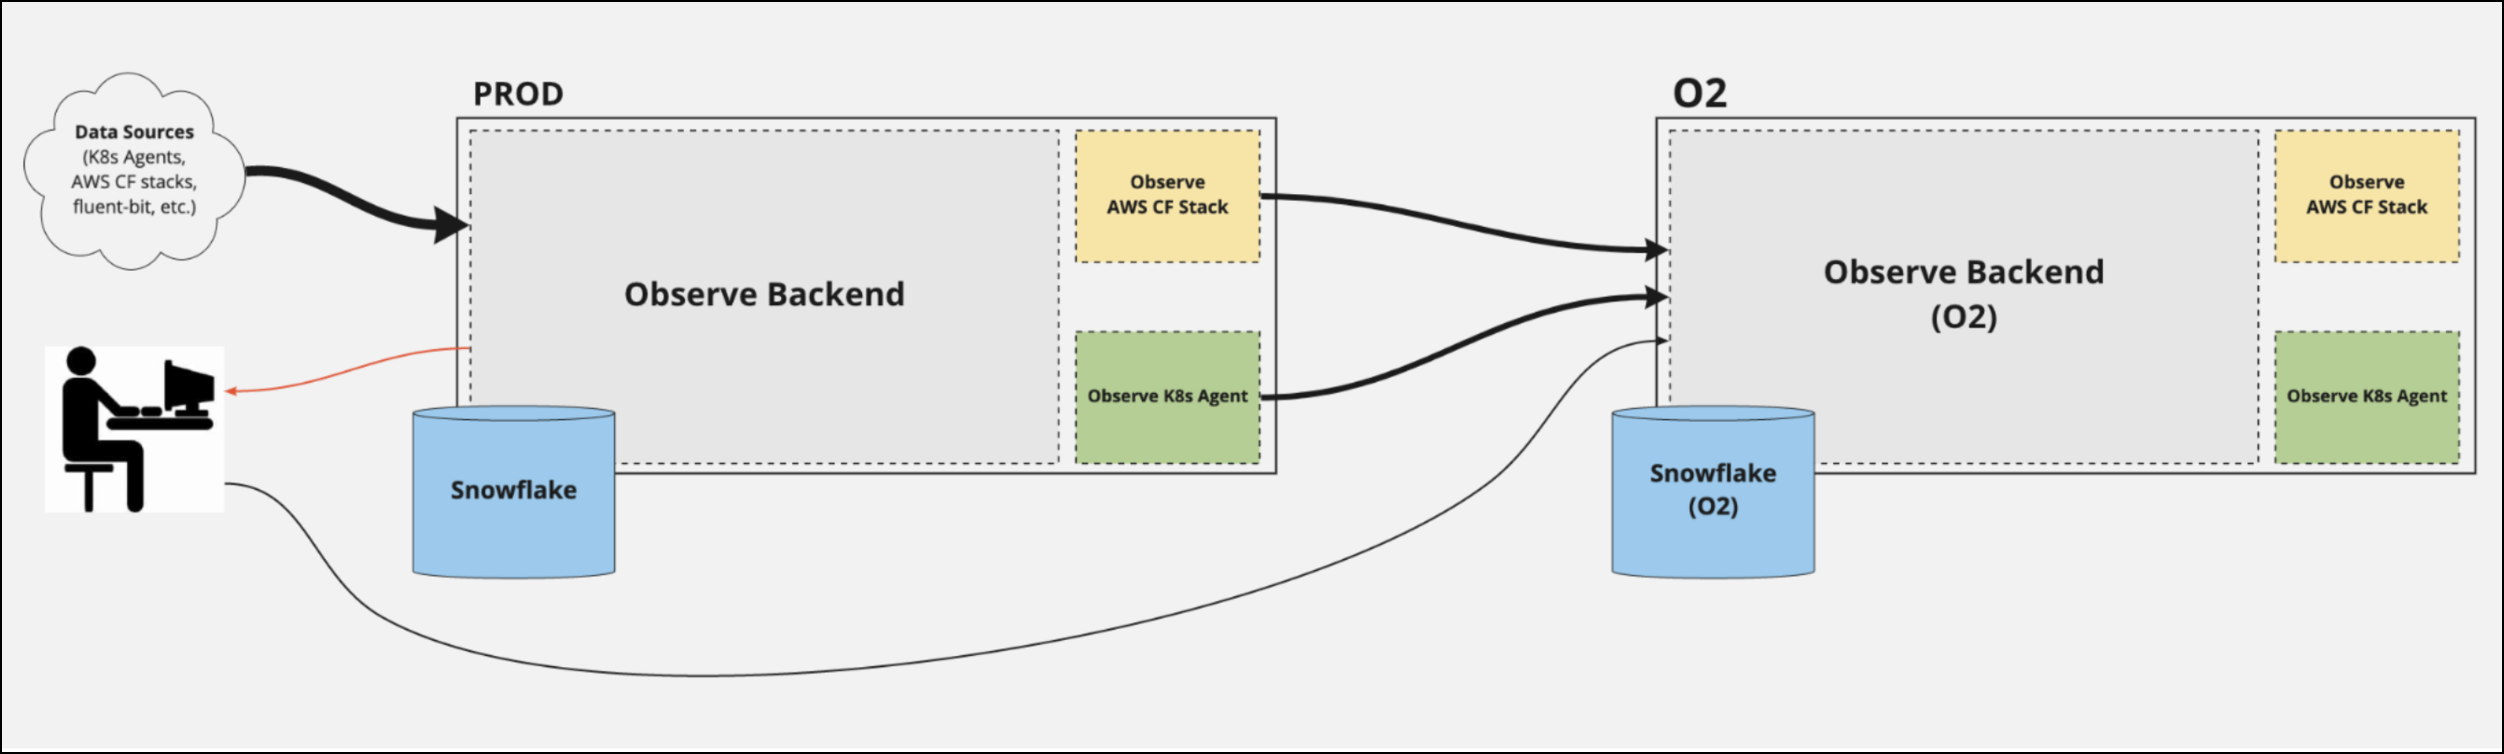
What is O2?
As the centerpiece of our observability stack, O2 is the first place we go to dig into issues not only with Observe itself, but with our customers, infrastructure, and more. This environment is a completely distinct deployment of Observe – separate from prod, staging, and eng – that we use to observe our own SaaS application in production. It’s even isolated to the extent that we run different code versions, and we do not deploy to the O2 environment at the same time we do other environments.
O2 is heavily utilized by our own engineers to test new code, hotfixes, troubleshoot Observe, and more. But engineering isn’t the only department that uses 02, it’s used heavily by many other roles throughout the company. For example, our sales engineers might use O2 to replicate an issue with a customer’s environment or even develop a POC. Our product managers use this environment to see what features customers use the most (or the least) and any other product-related questions they need to answer.
In the early days of developing Observe, we relied heavily on O2 to plan and design the various types of analytics, charts, alerts, and other features we planned to develop. As one of our co-founders, Jacob Leverich put it, “We dogfooded the crap out of it!”
What Do We Observe With O2?
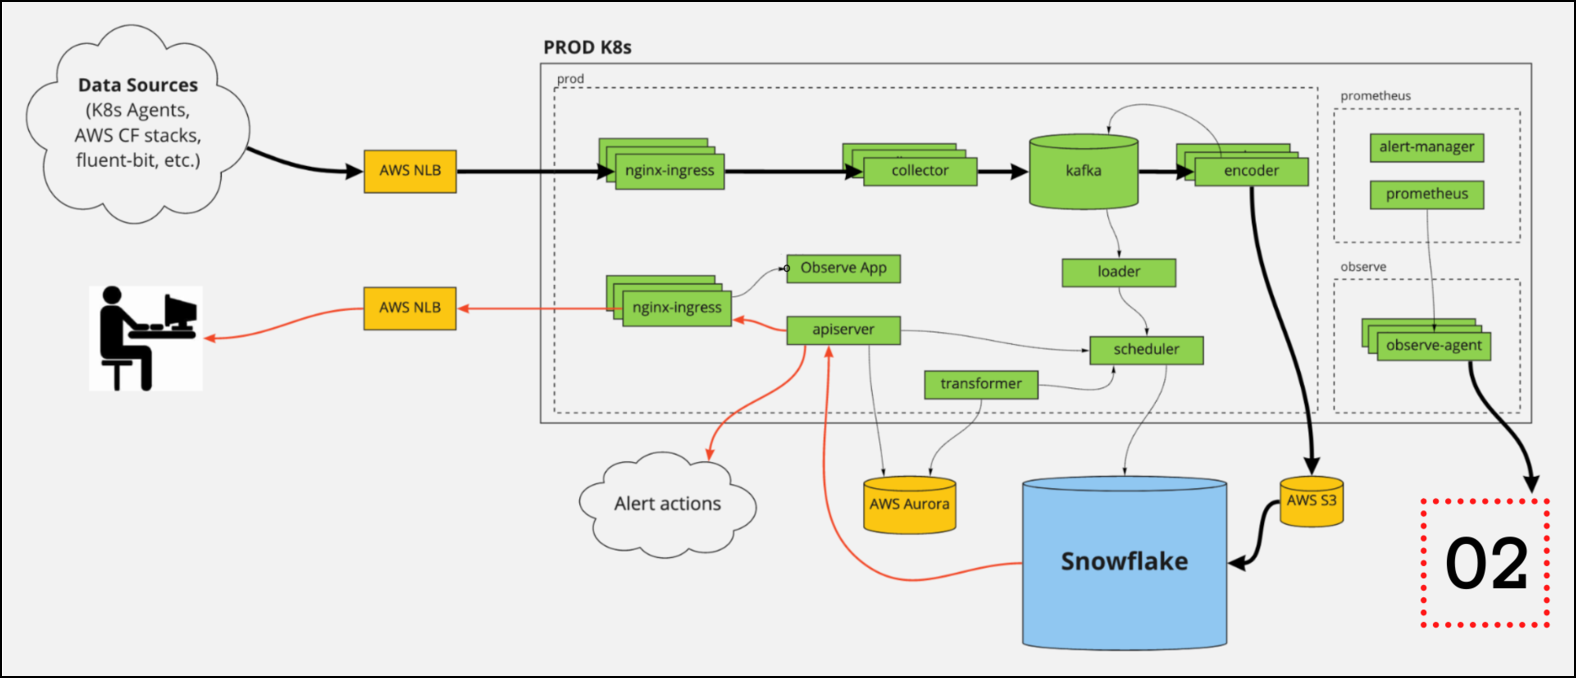
To put it simply, we observe Observe with O2. However, Observe isn’t a monolithic app as you might guess, but rather a collection of cloud-based infrastructure, services, microservices, and application code.
Besides observing our production environment, we also observe all of our other environments like staging, eng, and even O2 itself. That’s right, not only do we eat our own dog food, but we also eat our own tail!
As you can imagine, ingesting dozens of different data types from numerous sources means we ingest A LOT of data – at the moment, O2 ingests over 5 TB of data per day!
What Kinds of Data Do We Ingest Into O2?
In general, we ingest two main types of observability data into 02 — “generic” infrastructure-level data that we collect with off-the-shelf agents, and application-specific data from Observe.
Infrastructure Data Sources
As mentioned earlier, Observe is a modern SaaS platform, which means our services are built on a variety of cloud-based services like AWS, Snowflake, and Kubernetes as a container orchestrator. Example infrastructure data sources we collect from:
- AWS – CloudWatch Logs, CloudTrail Events, Metrics, etc.
- Kubernetes – Container Logs, Ingresses, Pods, Nodes, etc.
- CICD & SCM Data – Data from our CICD build pipelines and commits to our repos.
- Prometheus Metrics – Various system metrics like CPU, Memory, Disk I/O, etc.
- Fluent Bit – Systemd logs, Syslog events, command history, etc.
- Kafka – JMX Metrics, topic throughput, Observe microservice metrics.
Observe Data Sources
Apart from our infrastructure telemetry, we also collect mounds of application data from Observe. This data is instrumental for helping us plan and design new features, understand usage patterns, or even troubleshoot Observe. Example data sources we collect from Observe:
- Observe Usage Data – Metrics related to credit, storage, and feature usage.
- UI Events and Exceptions – Raw event data from UI actions.
- Observe Backend – Open Tracing Spans from our backend microservices.
- Observe Application Objects – Datasets, Users, Worksheets, etc.
- Snowflake Usage Data – Warehouse credit usage, data storage usage, etc.
Until Next Time…
There’s simply too much to cover in one post when it comes to O2, so we’ve broken this post down into three parts.
In this post, we talked briefly covered how we use the O2 environment, and the different kinds of data we ingest. In part II, we’ll get our hands dirty and show how we use this data, who uses it, and how this helps us improve different aspects of Observe.
And in part III, we’ll bring it all together to show how we are able to tie a few of these data sources together for advanced troubleshooting, as well as tips, tricks, and best practices that we picked up along the way.