Blog


How Observe Uses...Observe! [Part III]

Imagine being able to see how that PagerDuty alert is related to your Jenkins build logs and find the single commit that broke your environment – no more opening multiple browser tabs and correlating events by hand across several tools!
Tying It All Together!
In part II, we talked about how we use the various types of data we collect in our observability environment — which we call O2 — but now we’ll look at a scenario where we combine a few of them to troubleshoot an issue. Just as important, we’ll show you how we do that in Observe and the features that allow us to do that.
A Typical Use Case
Occasionally, a user contacts us because they see an error that one of their Datasets is unavailable. Troubleshooting these types of errors is often a breeze, as we’ve modeled Datasets from “things” found in our product, and from other data that we find important.
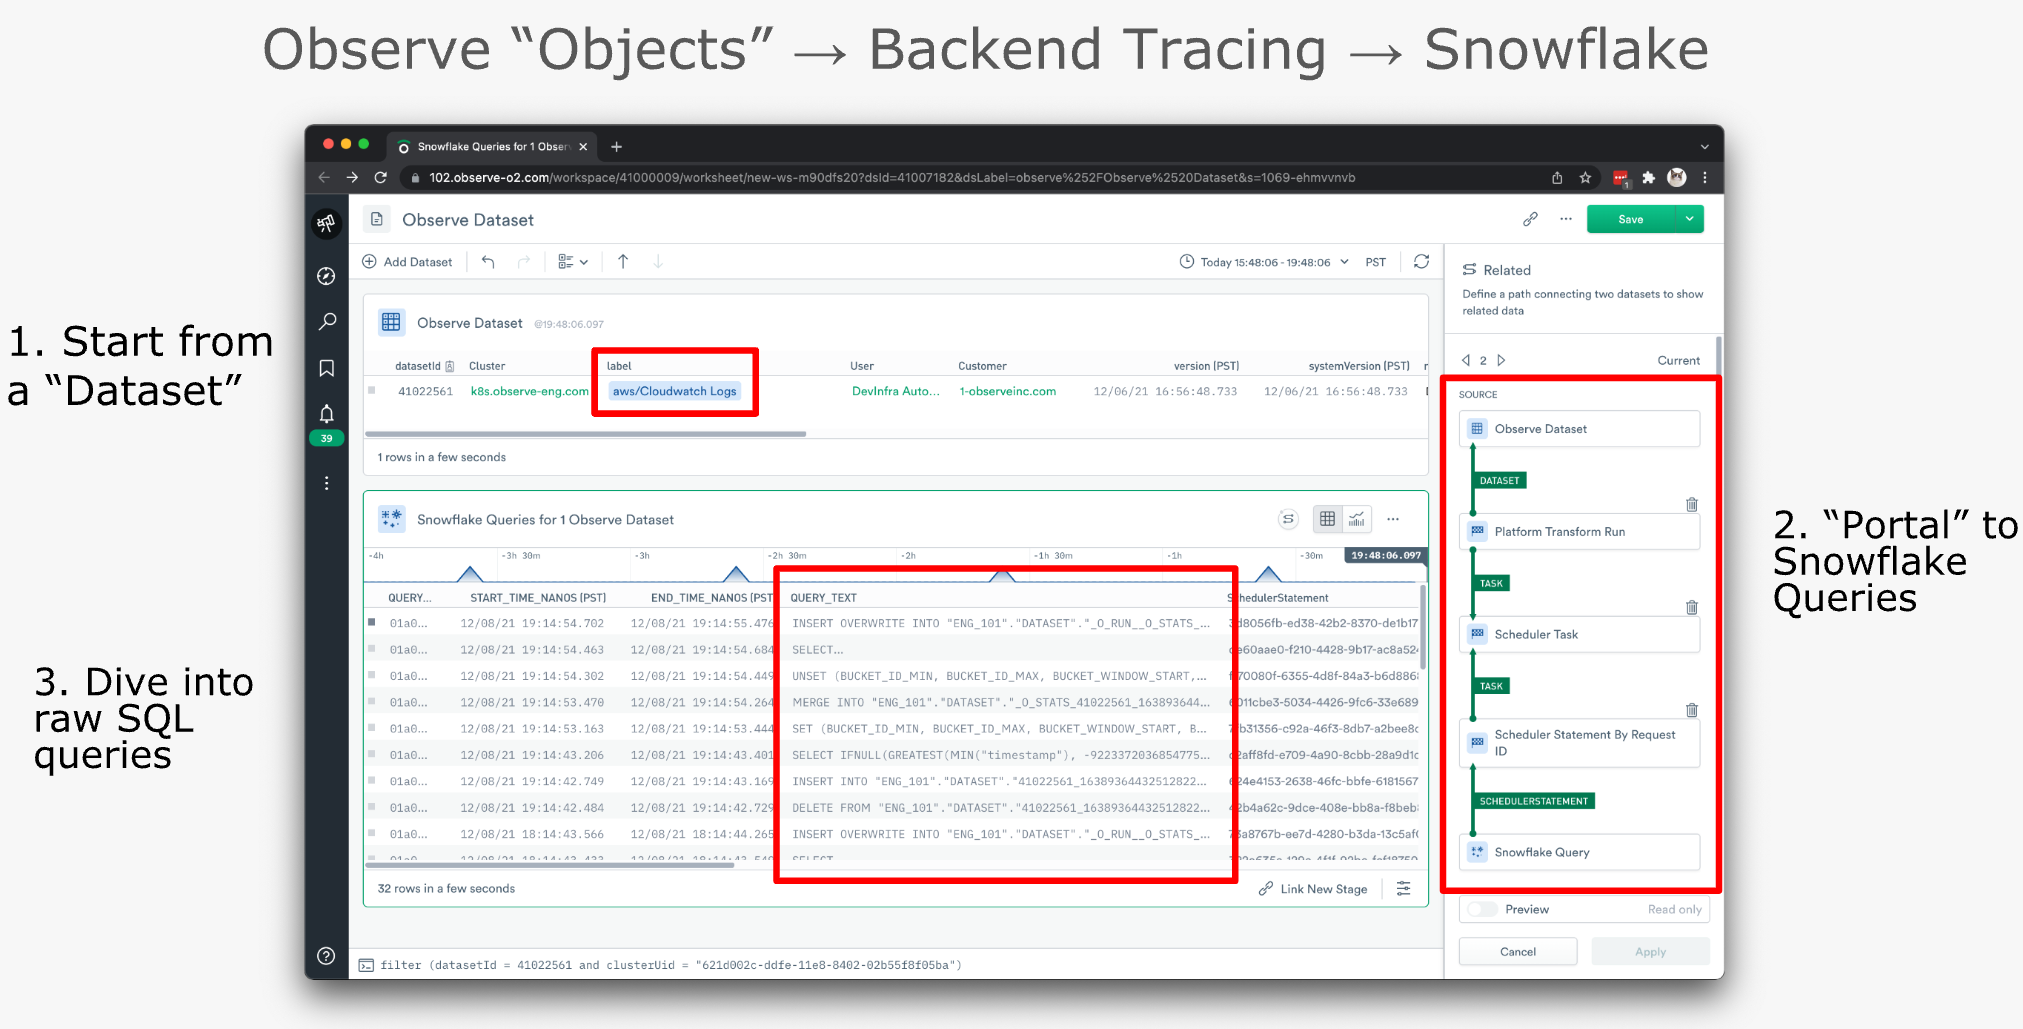
Here’s the typical troubleshooting workflow for “unavailable Datasets”:
- We locate the troubled Dataset in our “Observe Dataset” Dataset (top) – you read that correctly.
- Using GraphLink (right) we portal to our “Snowflake Query” Dataset.
- Note: The path from the “Observe Dataset” Dataset to the “Snowflake Query” Dataset hops through a few other Datasets to get there. Observe automatically generates this path after the user selects the destination Dataset if a relationship exists between the two. Observe can do this because it understands how your Datasets are related by using foreign key relationships in your data.
- That gives us a table containing the raw SQL queries (bottom) related to the Dataset in question, allowing us to troubleshoot accordingly. In this use case, we are usually looking at query performance metrics, failure messages, and occasionally digging further into the raw SQL if needed.

We can also troubleshoot in reverse. Meaning, we can start with failed Snowflake queries and then portal to our “Observe Datasets” Dataset to find out which Dataset was impacted. From there we can notify the customer that one or more of their Datasets are broken due to upstream errors.
Other use cases
We don’t have enough time to cover all the ways we use O2, as we find new use cases daily. But let’s take a look at a few more of the more common ways our engineers utilize O2 to make their jobs easier:
- CI/CD performance monitoring and troubleshooting: From our various build logs we’re able to create useful metrics like avg_build_latency, job_count, job_failures, etc, and then chart them to get a much clearer, and visual, picture of the health of our CI/CD pipeline.
- SOC-2 Audit: With the help of an automated, third-party, security and compliance tool we use O2 to prove our own SOC-2 compliance!
- Sharing URLs: Whether in Slack messages, bug reports, or post-mortems, we can easily share an Observe URL to a Dataset, Monitor, or Worksheet to provide as much context as possible around an issue to aid our engineers when troubleshooting.
Tips and Tricks for Success
You’ve seen how we use Observe, but let’s look at a few best practices so that you can make the most out of your observability strategy!
Step 1: Ingest Everything
The first step in building a fully observable system is to ingest telemetry from every source in your environment that will help you better understand its health, and how your customers impact it. Don’t worry about how you’ll use this data at this stage, simply get it in and analyze it later.

Though Observe can handle both structured and unstructured events, we recommend that you save yourself some time by structuring your data in JSON or a key-value format beforehand. Structured data is always a little easier to work with, and the last thing you want to do while troubleshooting is additional data modeling.
Step 2: Create Datasets That Reflect Your Environment
Now that you’re swimming in telemetry, let’s talk about Datasets. Datasets are essentially a structured representation of data from a single source. Out-of-the-box, Observe provides hundreds of Datasets, allowing users to focus on telemetry at the application level, rather than digging through piles of machine data looking for that “magic” log line. But for now, we’re going to focus on user-defined Datasets, and specifically how to best model that data.
The biggest thing to remember when modeling your own Resource Datasets is to make sure that the Datasets you model best resemble your environment. These Datasets will form the backbone of your troubleshooting workflow, so take your time here.
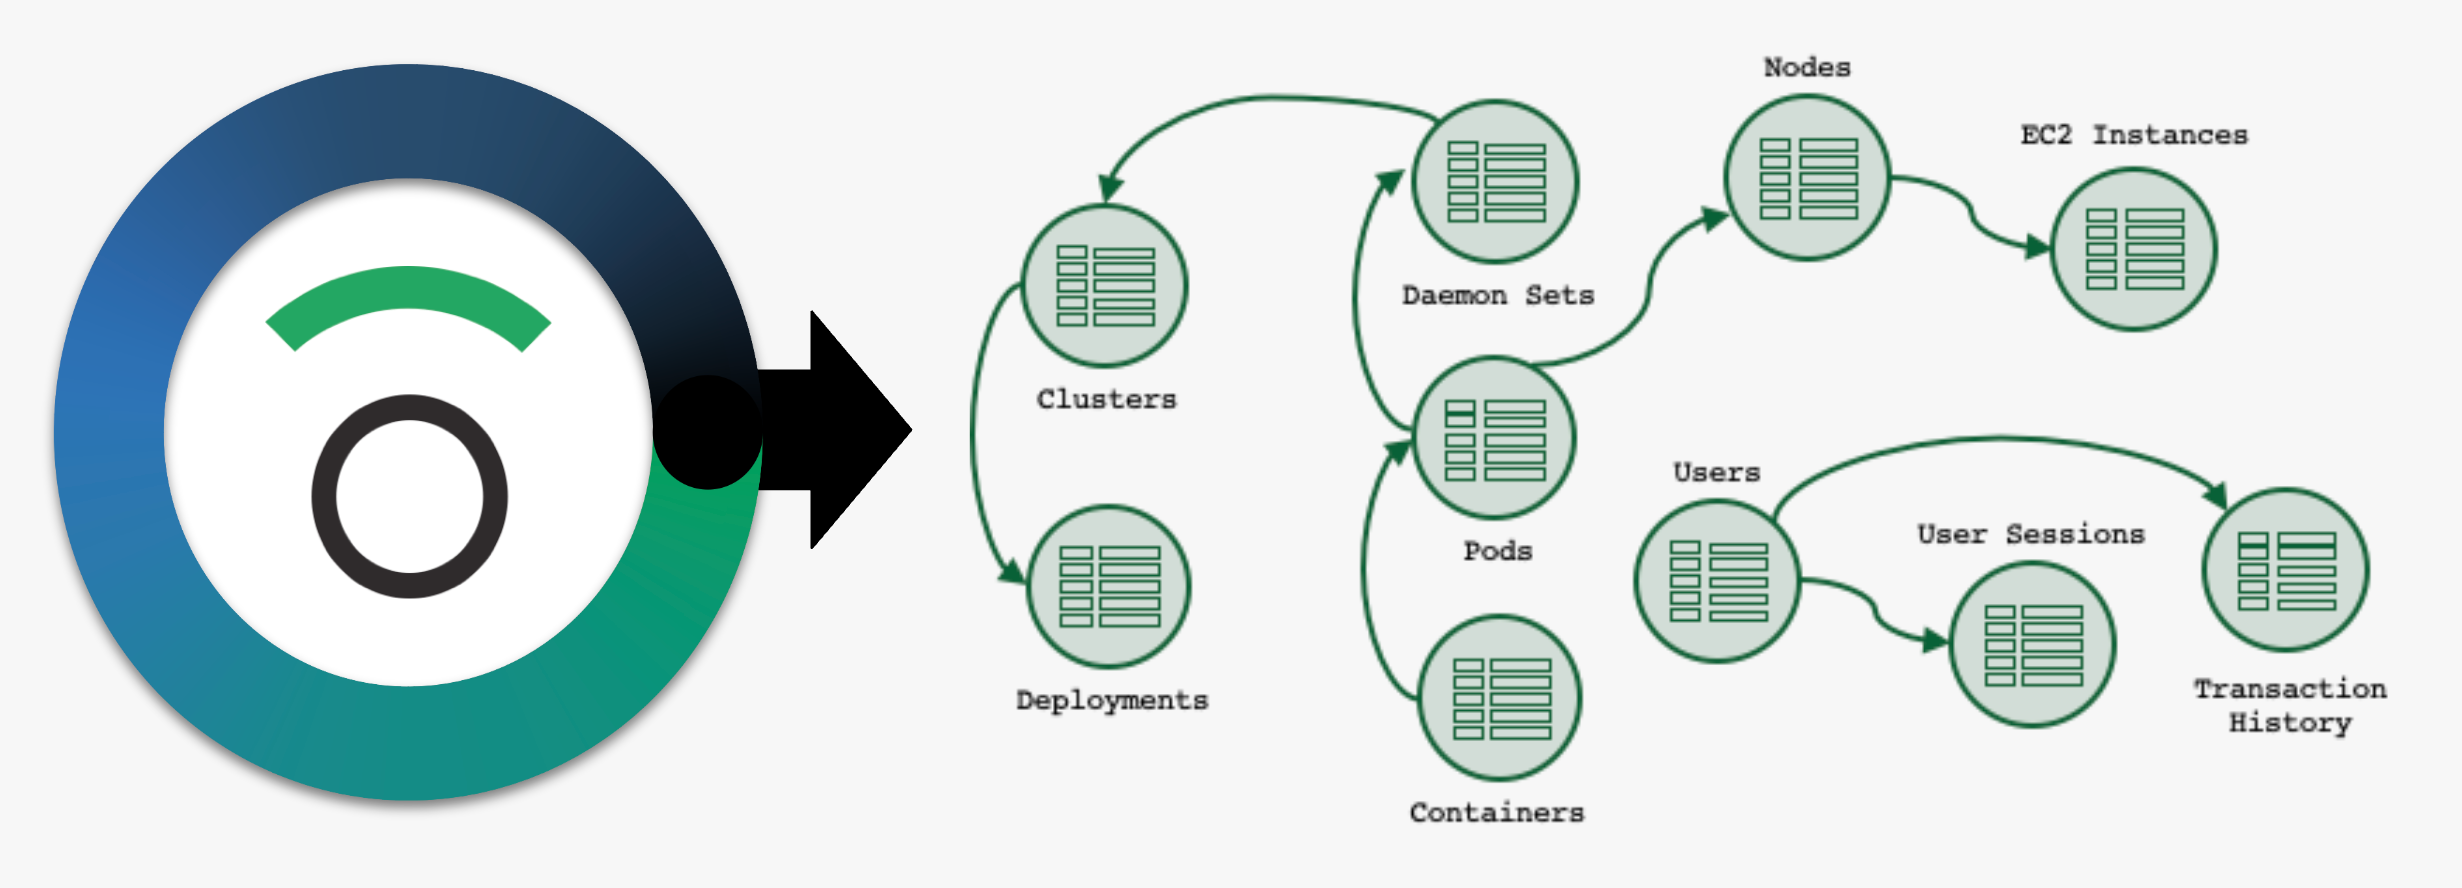
A good first question to ask is, “What are the things we want to ask questions about?” For us, these are things like Users, Monitors, and Datasets, but for you, they might be Customers, Pods, Shopping Carts, or Support Tickets.
As a part of the modeling process, you’ll identify how these Datasets, and other Datasets already found in Observe, are related by using foreign-key relationships found in your data. Once modeled, you can visually explore these relationships with features like GraphLink & Dataset Graph to make troubleshooting a breeze.
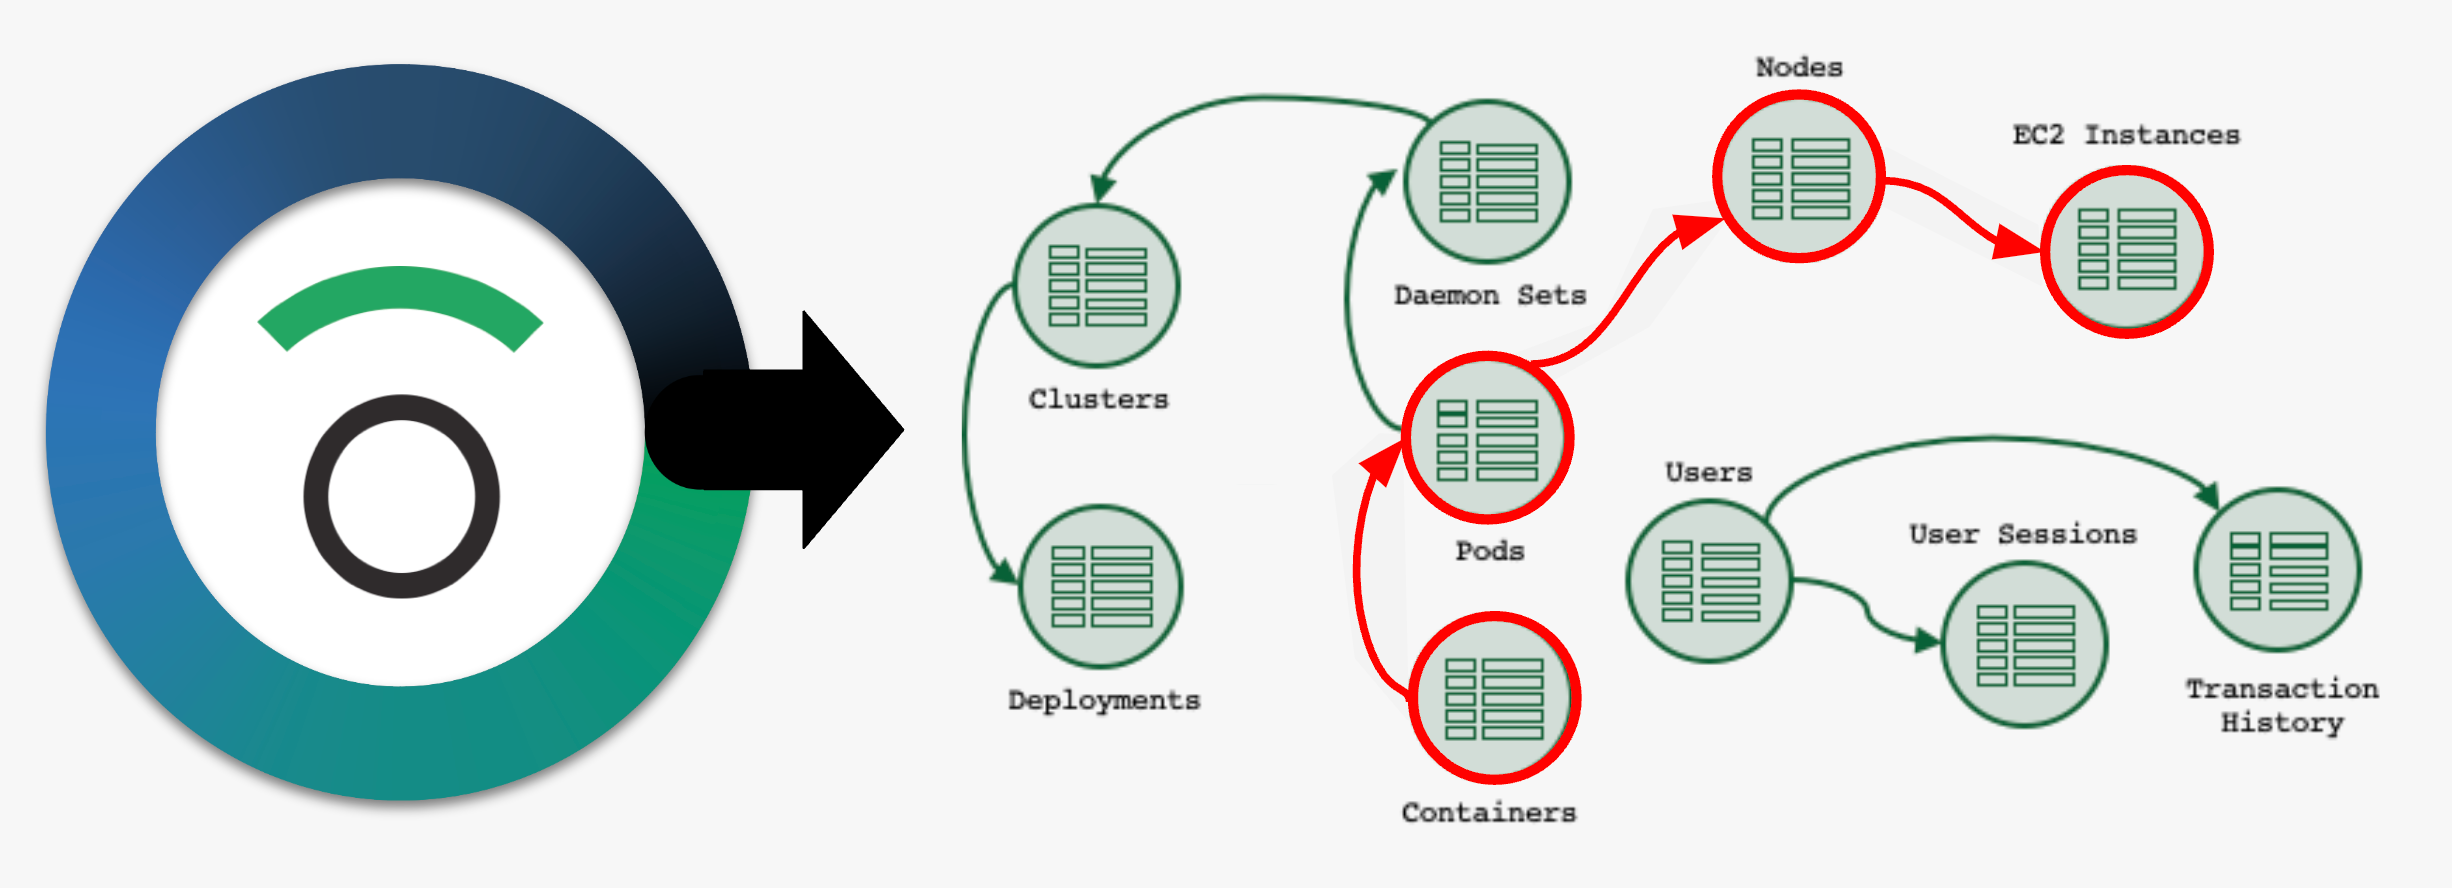
Imagine being able to see how that PagerDuty alert is related to your Jenkins build logs and find the single commit that broke your environment – no more opening multiple browser tabs and correlating events by hand across several tools!
Step 3: Create Meaningful Alerts
Last but not least, you’ll want to create alerts so that they’re timely and provide rich context when an issue arises. A noisy or poorly configured alert is not only disruptive but can also bury crucial information and hinder your troubleshooting workflow.
Here are a few best practices for creating useful alerts:
- The golden rule and first question you should ask yourself is – is this monitor actionable? If it’s not, ditch it. Or re-write it so that it is actionable.
- Provide as much context around the alert as possible. Your future self and team members will thank you for it.
- If you find that you and your team are ignoring an alert, then it’s time to reassess the feasibility of that monitor. Do you really need it? If so, can it be re-configured to be more meaningful?
Until Next Time…
If you’d like to know more about how we use Observe to monitor our own SaaS platform, data modeling, or general troubleshooting questions, visit our Support workspace on Slack and one of our engineers would be happy to help.
Or, if you think you’ve seen enough and want to give Observe a spin, click here to request trial access!


