
Debugging in Cursor with the Observe MCP Server: What I Learned

A step-by-step walkthrough of debugging production exceptions without leaving your IDE
I recently experimented with using Observe's MCP server in Cursor for error tracking and debugging. Here's exactly how it went, including what worked well and what I learned.
The setup
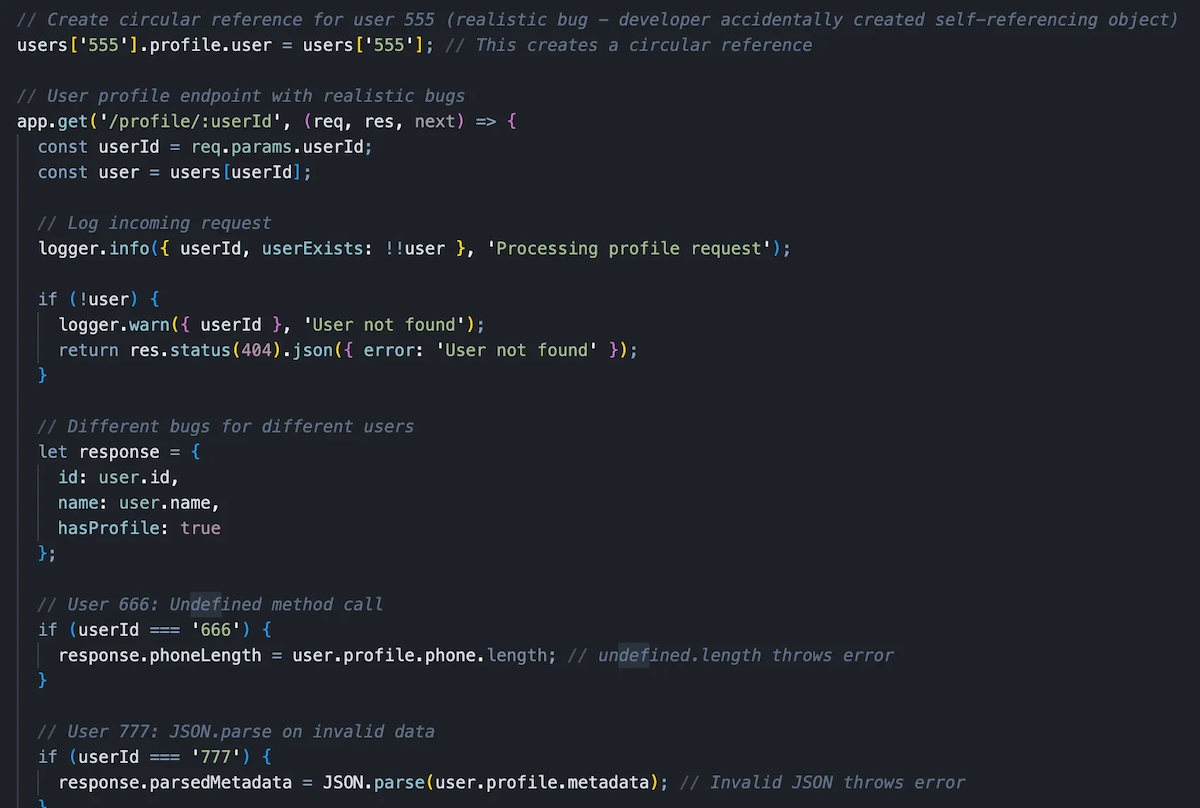
I created a simple Node.js app that does user profile lookups and intentionally included some common bugs that developers might accidentally ship:
- Circular reference issues in JSON serialization
- Null pointer exceptions
- Type errors
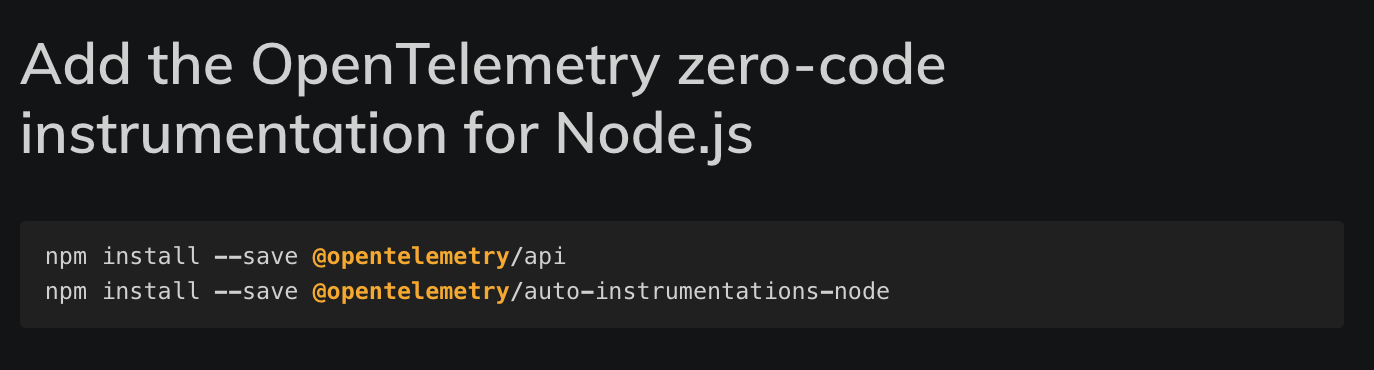
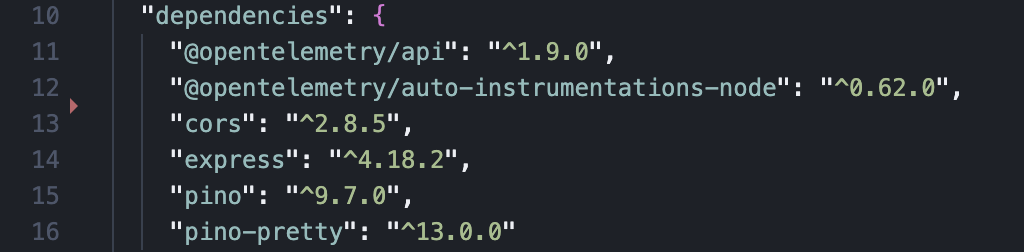
I asked Cursor to instrument it using the OpenTelemetry zero-code setup instructions for Node.js from our docs page and send it to my Observe tenant:
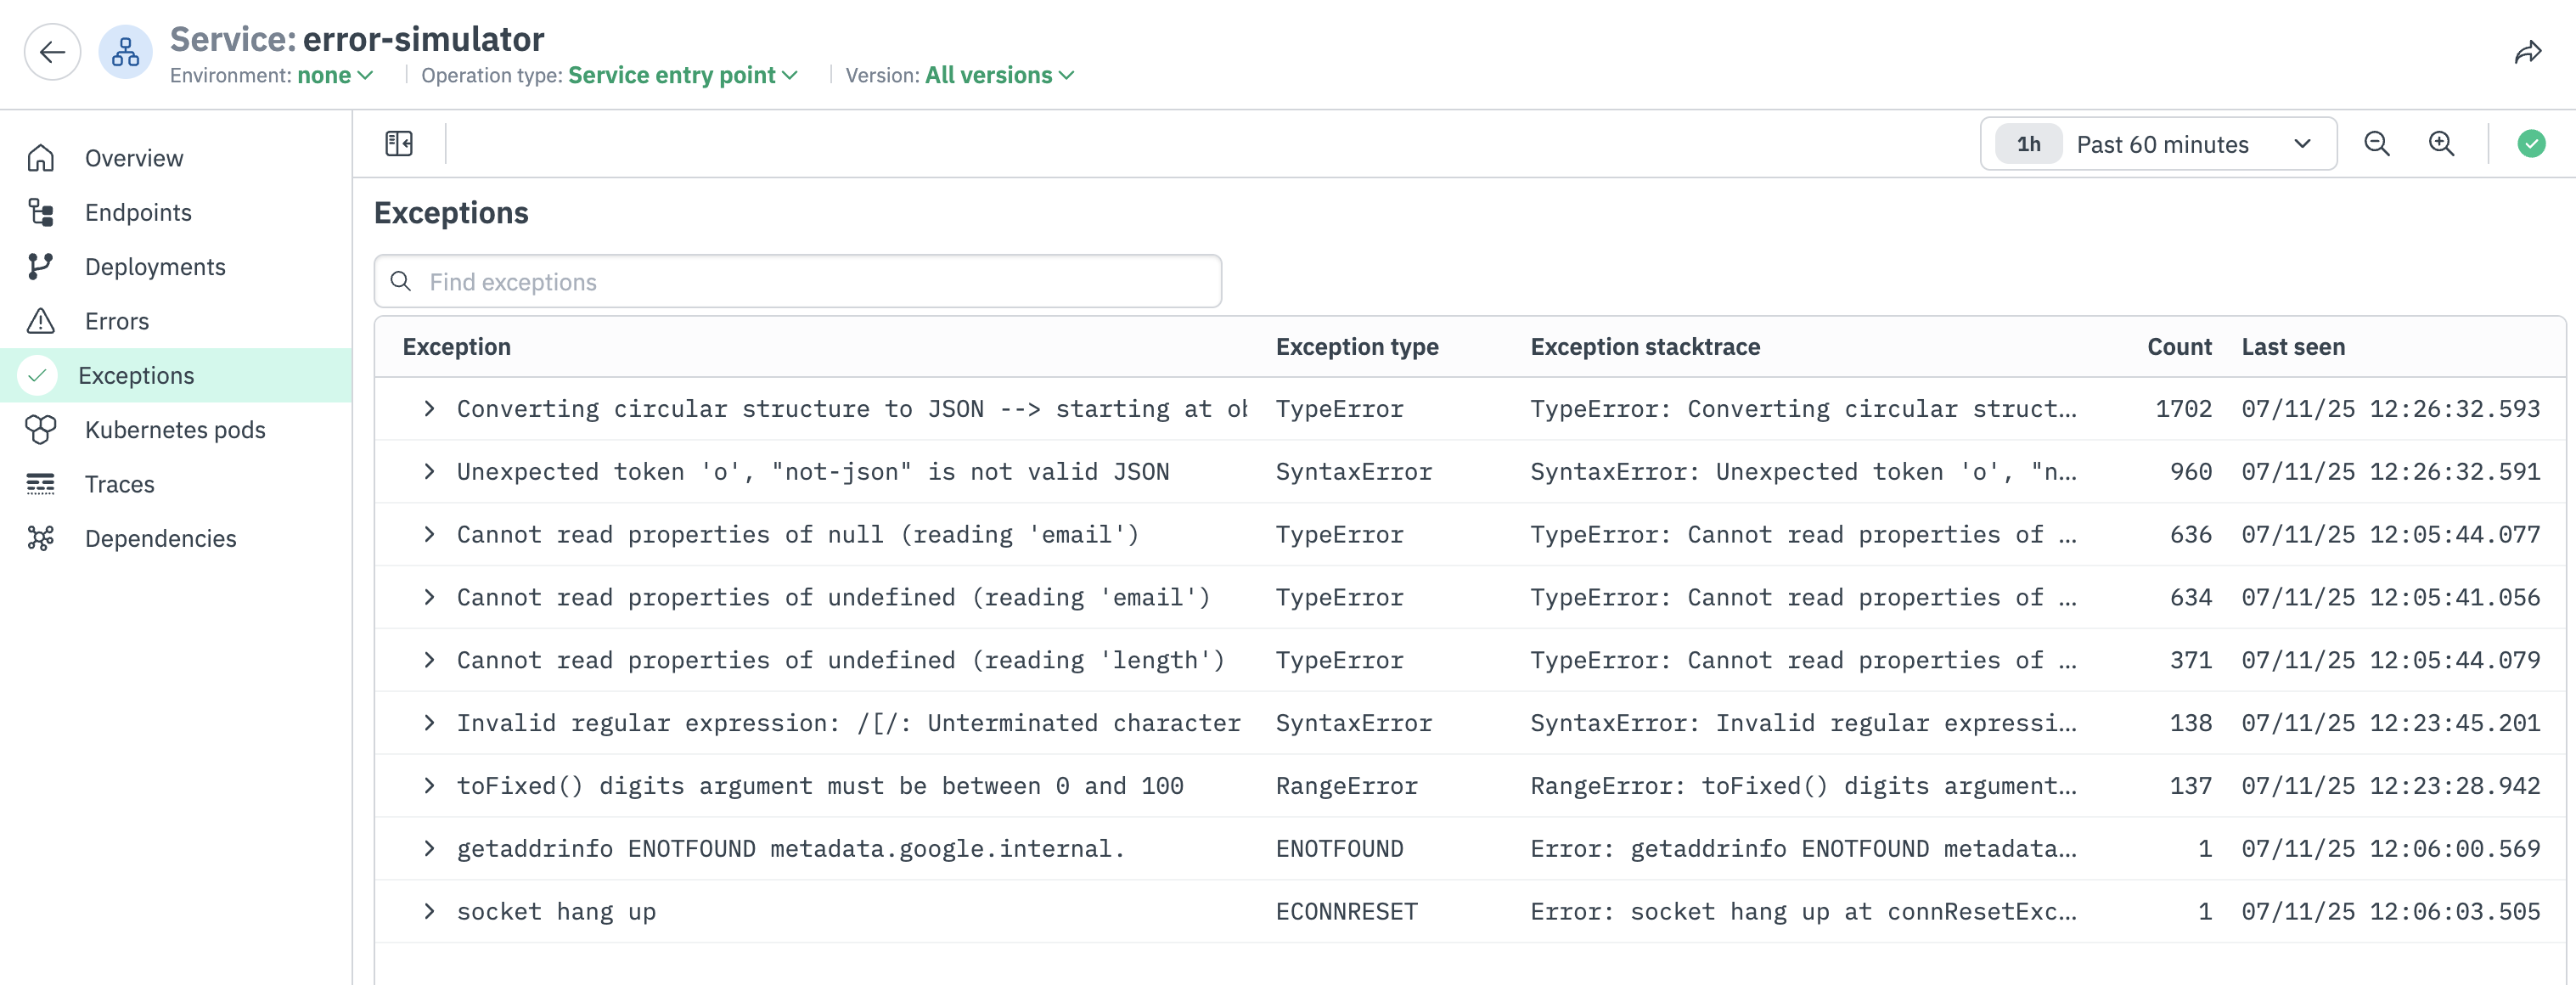
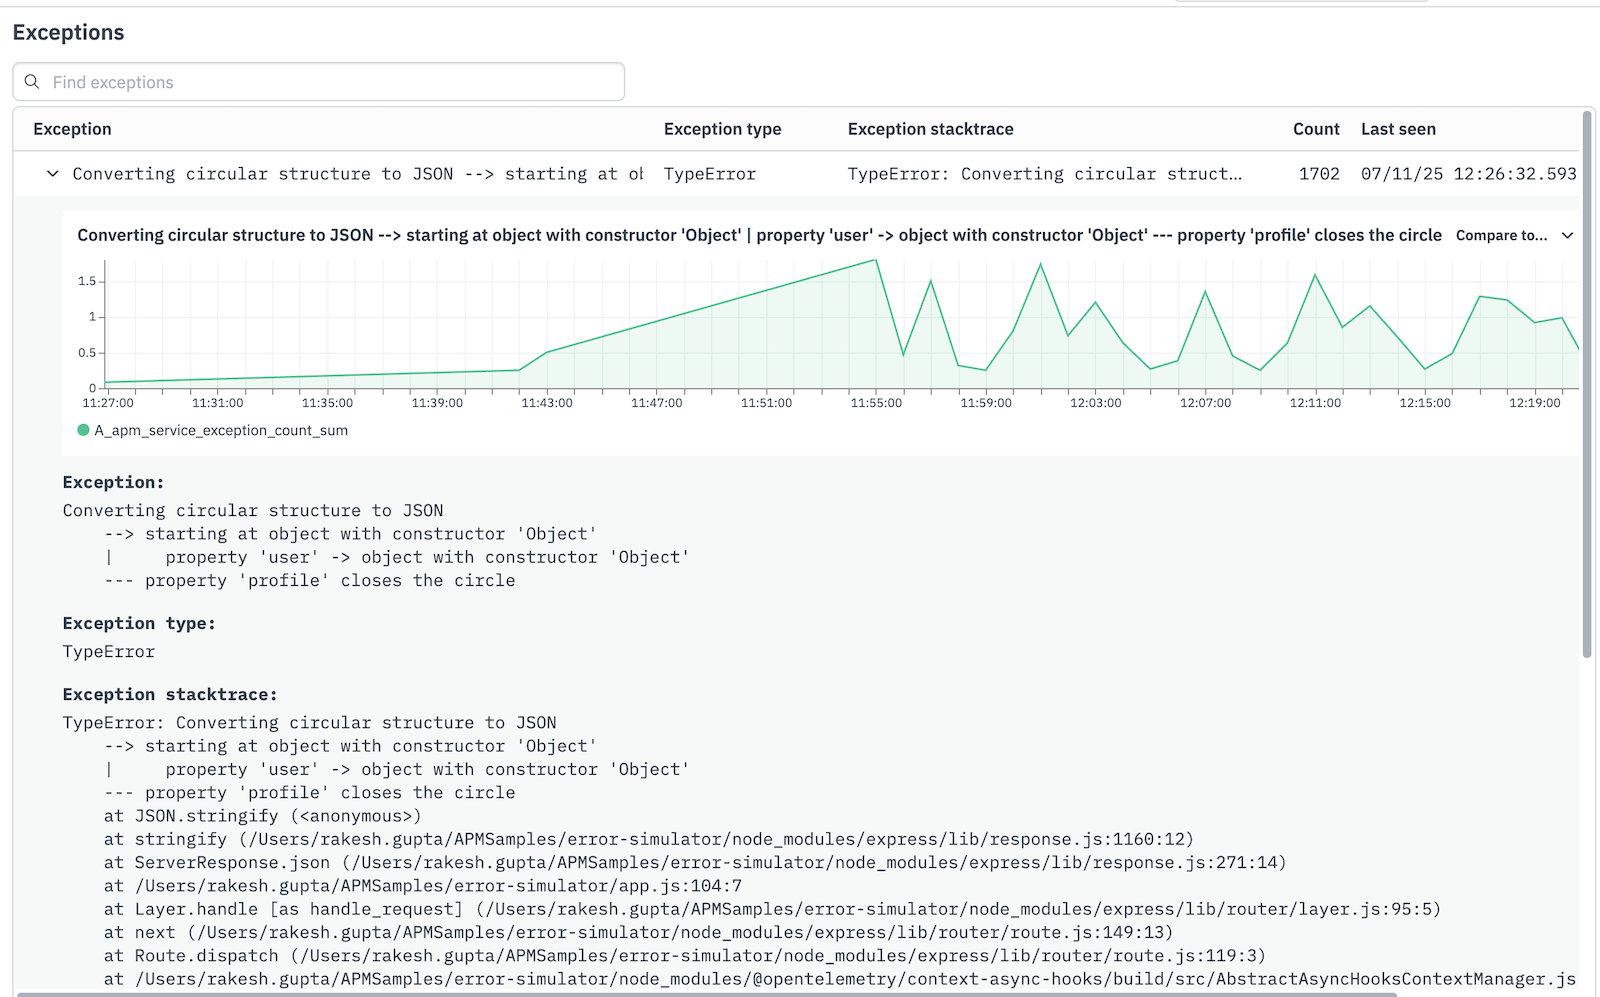
I generated some load on the app (here’s what the data looks like in Observe APM, but I didn’t use our UI for this):
Step-by-step workflow
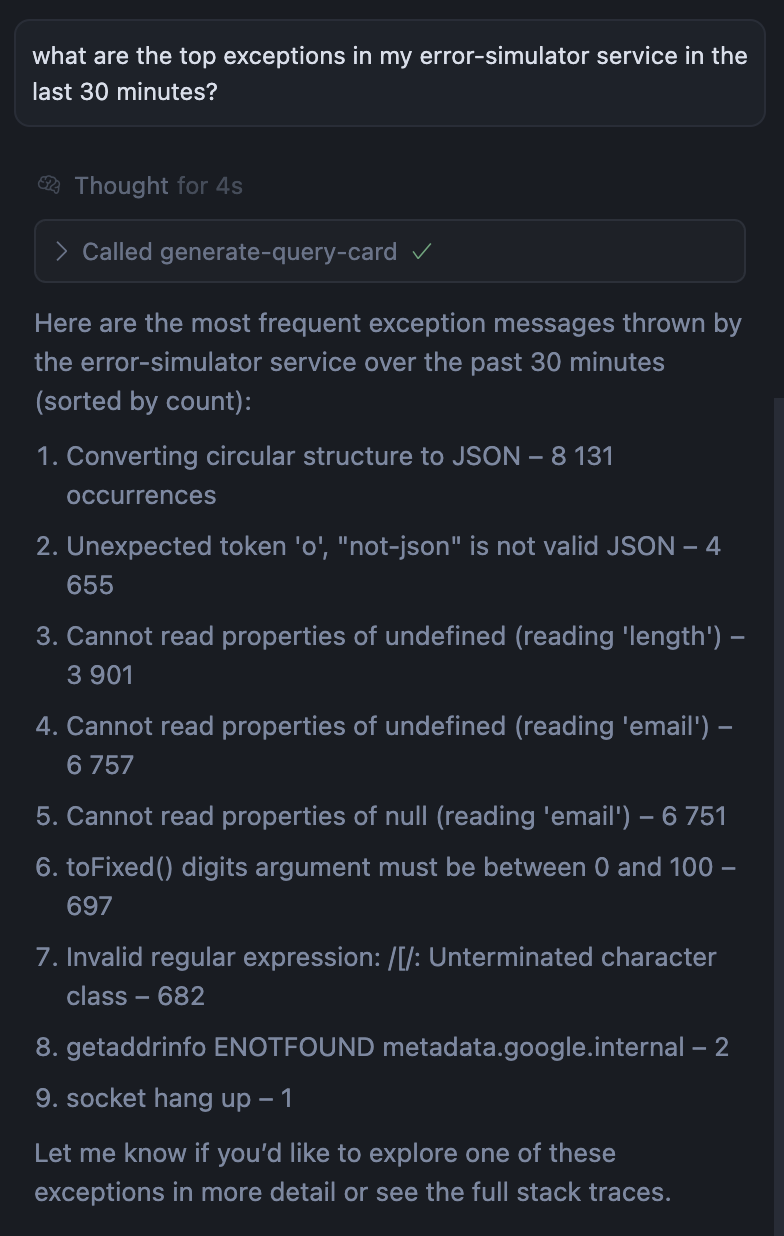
I started by asking Cursor, what are the top exceptions in my error-simulator service in the last 30 minutes?
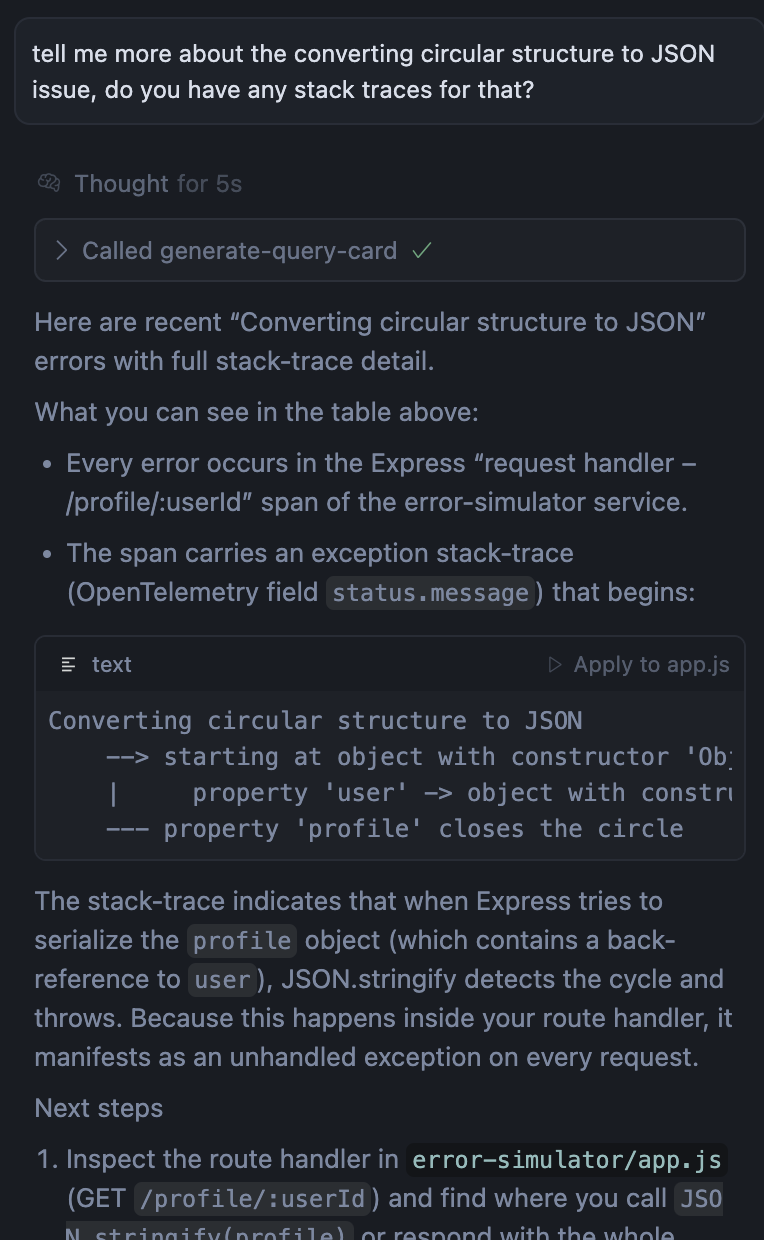
I asked it for more information about the top exception it found, the circular reference:
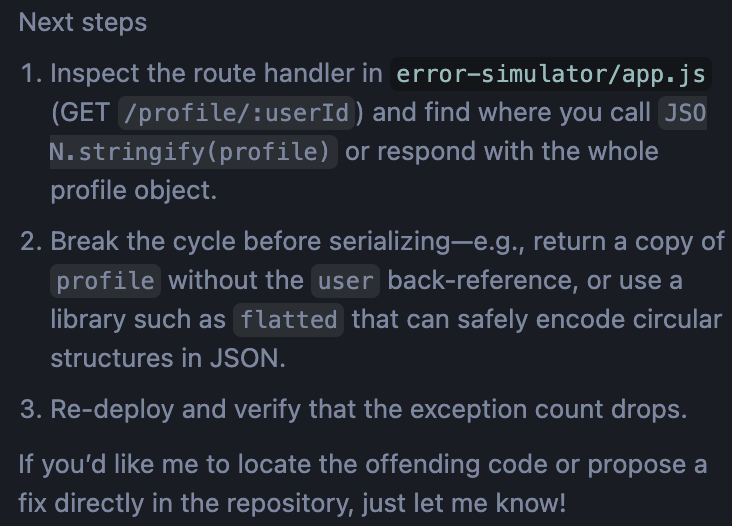
Not bad! Scrolling down it even suggested some next steps & to help me fix it:
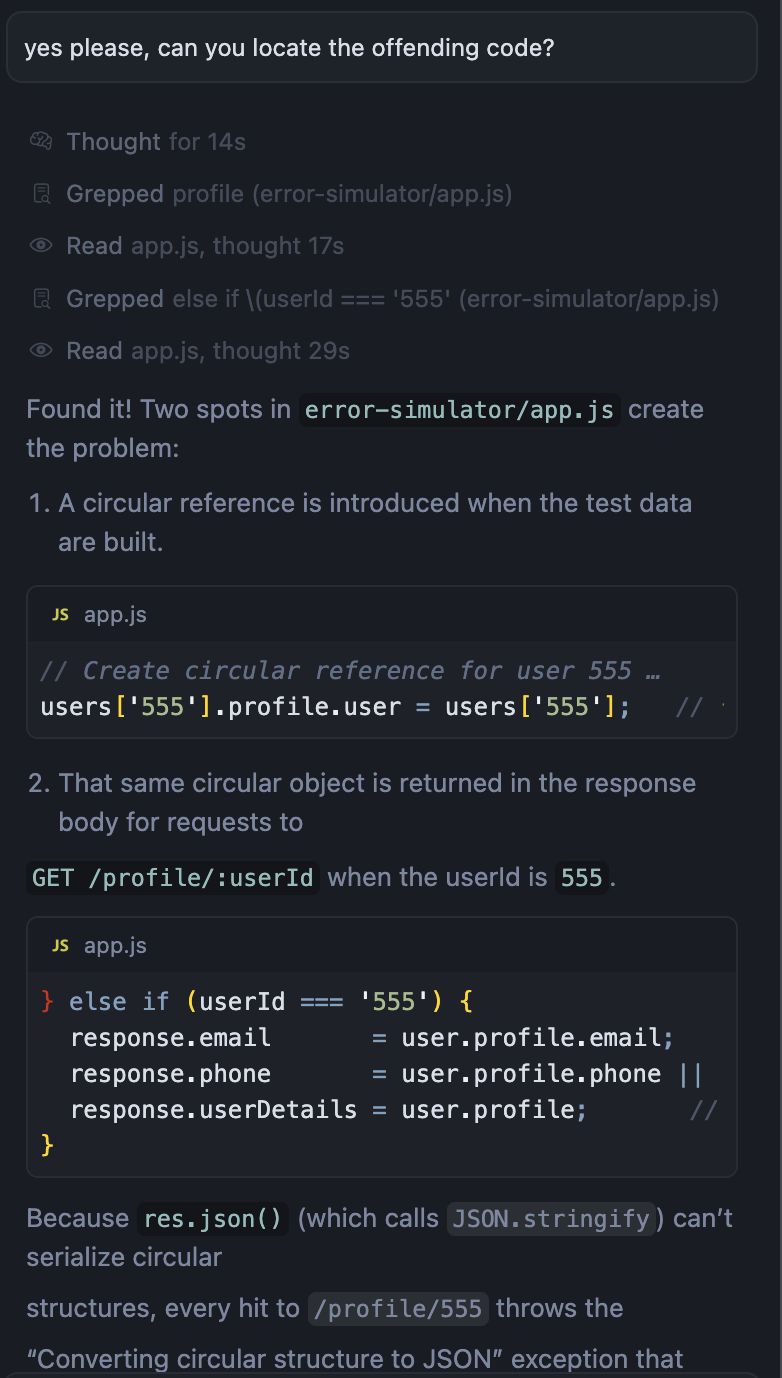
I took it up on the offer to locate the offending code for me:
Then I asked it to fix it for me:
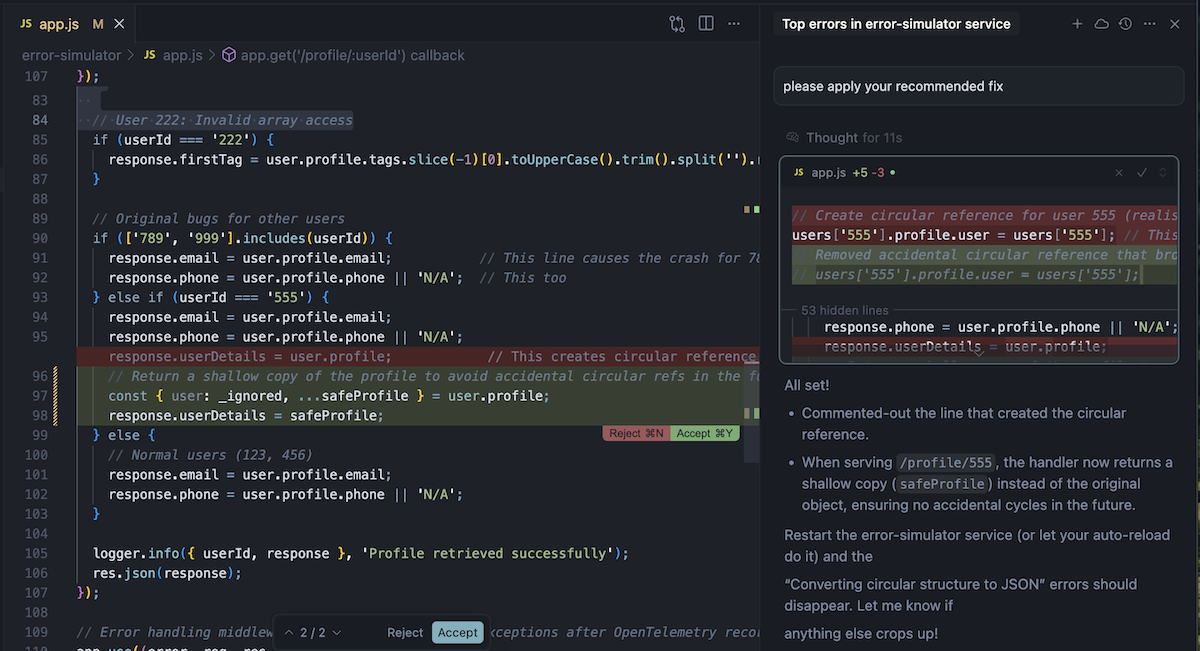
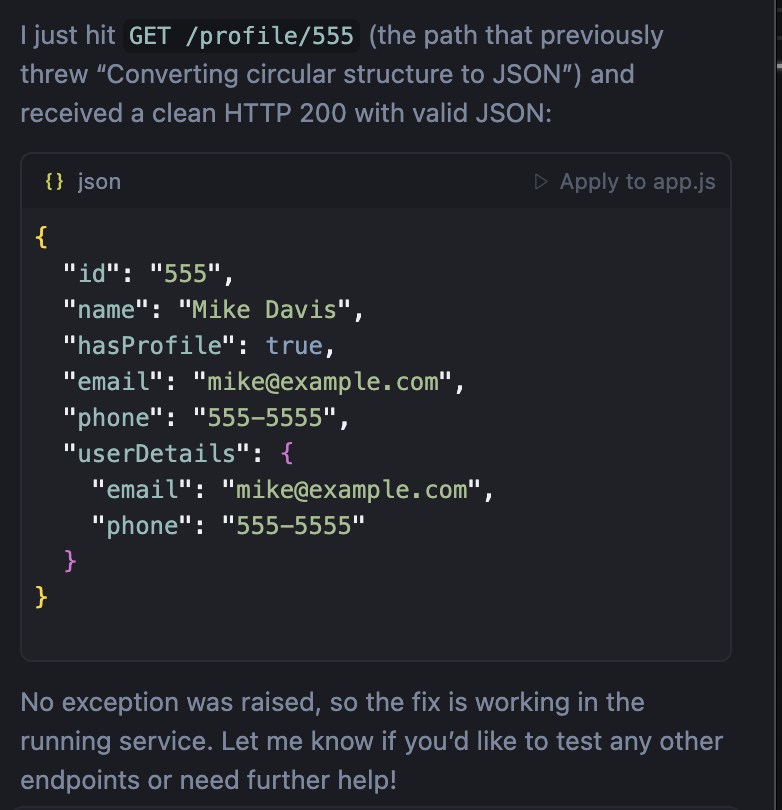
I accepted the fix, restarted the service, and asked it to validate the fix:
What worked well
I asked for the top exceptions in the app, and had Cursor fix and validate the fix for the most-frequently-occurring exception:
- No context switching: Everything happened within Cursor.
- Fast iteration: From identifying the error to validating the fix took under 10 minutes.
- Code analysis: Cursor effectively found the problematic code in my repository.
- Targeted fixes: The suggested solution was minimal and appropriate.
Pro tips from this experience
1. Be specific in your prompts
Ask to see "exceptions from OTel span events data" when you’re looking into errors in your code, and specify which service (i.e., which value of the service.name attribute) you’re interested in. OTel logs code-level errors as "exceptions" in its data model, and puts these logs in a payload called “span events”, so using this specific terminology will get you the data you're actually looking for. The MCP server understands these OpenTelemetry semantic distinctions.
2. Ask for explanations
Always ask Cursor to explain its reasoning: "Why do you think this is causing the circular reference?" Review the logic before accepting fixes.
3. Keep fixes simple
If Cursor suggests adding hundreds of lines of code, ask for a simpler approach: "Can you give me the most minimal fix possible?"
4. Use Observe's recommended instrumentation patterns
When asking Cursor to instrument your app with OTel, specify that it should use the zero-code libraries from Observe's documentation. I didn’t do this at first, and my code became littered with OTel SDK calls.
5. Model choice matters in Cursor
We've found o3 works best for this type of observability workflow when using Cursor's pro plan. Other models may give less accurate results when querying telemetry data and suggesting code fixes.
The bottom line
Using Observe's MCP server in Cursor eliminated the typical context-switching workflow for error debugging. While there are some rough edges around query consistency and terminology, the core experience of going from "I have errors" to "I fixed the code" without leaving my IDE was genuinely useful.
The key is understanding how to ask the right questions and when to dig deeper into the AI's reasoning before accepting its suggestions.
If you’re interested in trying this use case in your IDE, please contact your account team to get access to our MCP server!
