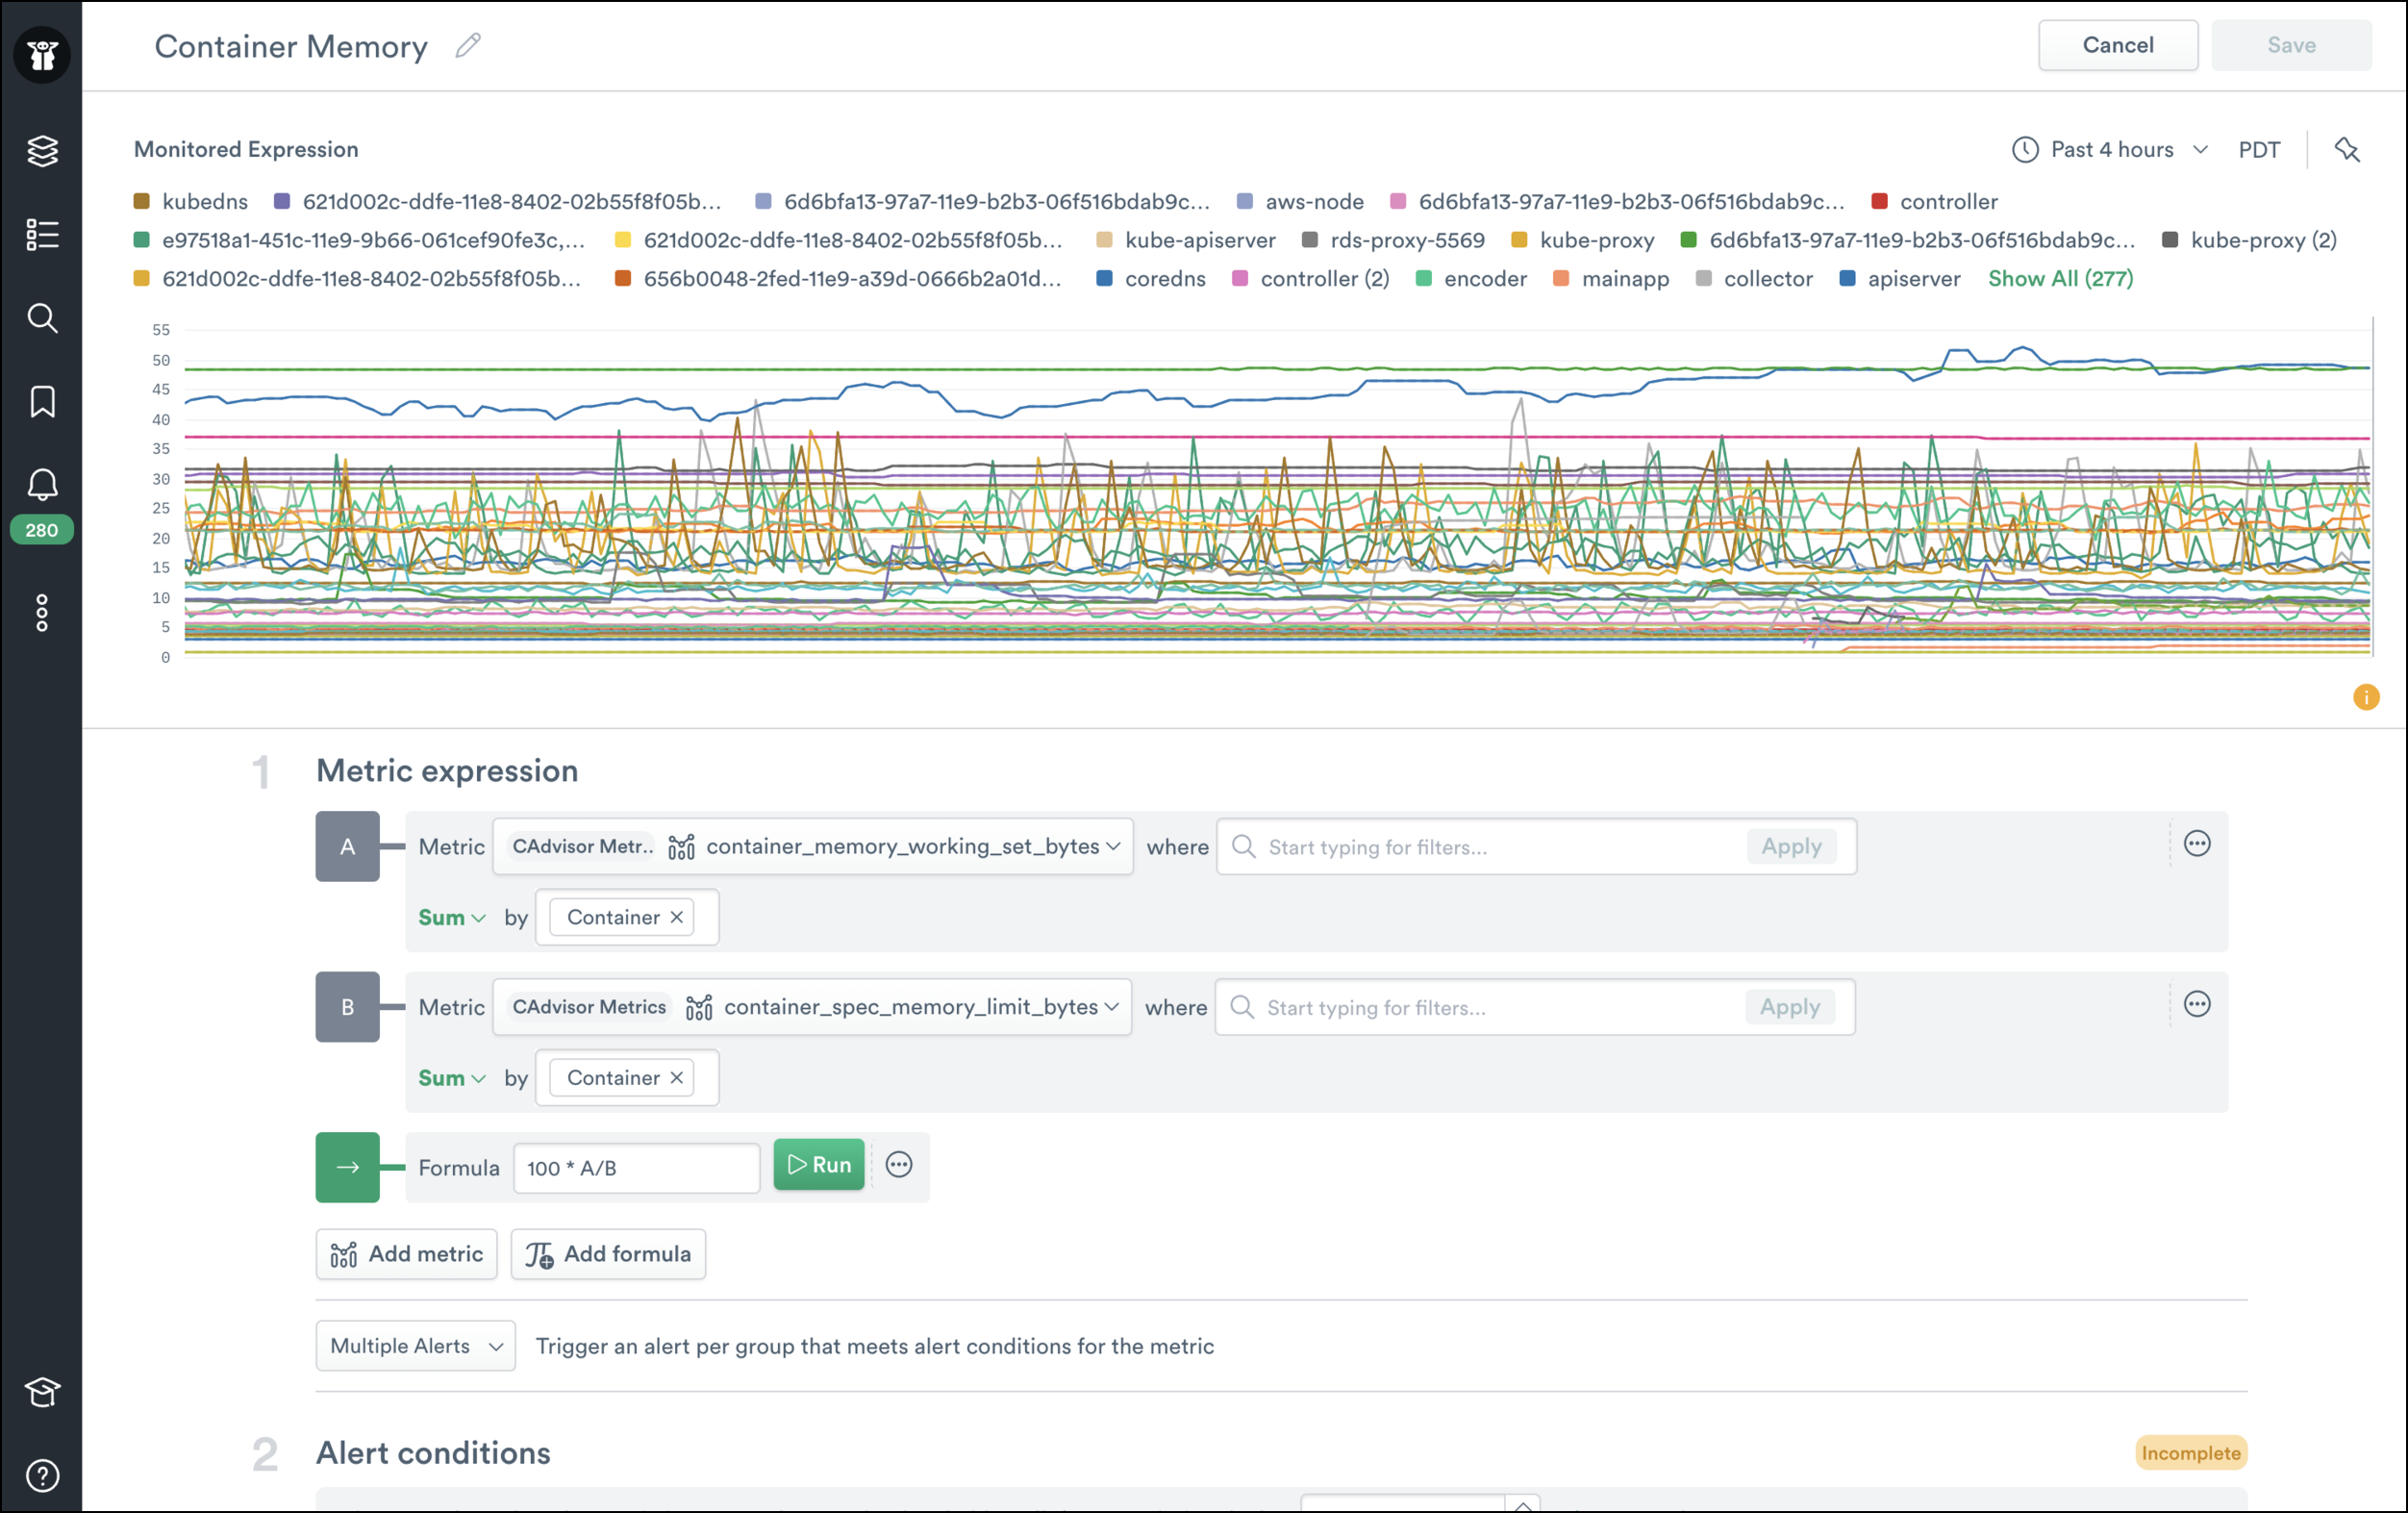
What’s New: Metric Alerting
 By Ross Lazerowitz,August 25, 2022
Noisy, or poorly configured alerts can be extremely disruptive and can even bury crucial information.
Metrics For The Rest of Us
As a product manager, I spend a lot of time speaking with our users. One thing became very apparent when we introduced metrics support in Observe – metrics are way too hard. If the engineering team wants to adopt Observability, not just SREs, we need to make them a lot easier to use. To make metrics more accessible I’m happy to introduce our new metrics expression builder.
The first use case we wanted to address with this builder is the alerting experience. Ask anyone who has to be on call and you’ll hear about alerting-related pain. “Noisy” or poorly configured alerts can be extremely disruptive and can even bury crucial information. To make alerting more useful and less painful to experience day-to-day, we first set out to address a few key challenges with metrics:
- Abstracting away time vs. space aggregation: Most of the alert types that users want to build are simple. However, a lot of tools force you to understand the difference between time and space aggregations when dealing with advanced metrics expressions. While it’s a necessity to learn that concept for advanced queries, you shouldn’t need an advanced degree in statistics for simple queries. For instance, setting up simple alerts on a request count, or system metric.
- Counters, gauges, histograms, and other units: You should be able to create a metric alert without understanding how to manipulate the different types of metrics. For example, if you select a counter metric such as restart count, then the tool should automatically choose a rate() time alignment so that you can visualize the per-second average rate of increase.
- Previews with real-world data: A major limitation of most metric alert tools is the lack of a real preview. It’s not enough to show a static threshold line. Tooling should show you when your alert would’ve fired by leveraging historical data. Without this functionality, creating effective alerts is trial and error.
- Multi-metric expressions: If you want to perform arithmetic across metrics you should not need to specify join conditions manually, which can be time-consuming. For example, imagine you want to compute the K8s memory utilization per container. You need to get the working_set_bytes container metric, divide it by the dynamic memory limit metric, and then multiply it by 100. This kind of query is only expressible by a query language power user.
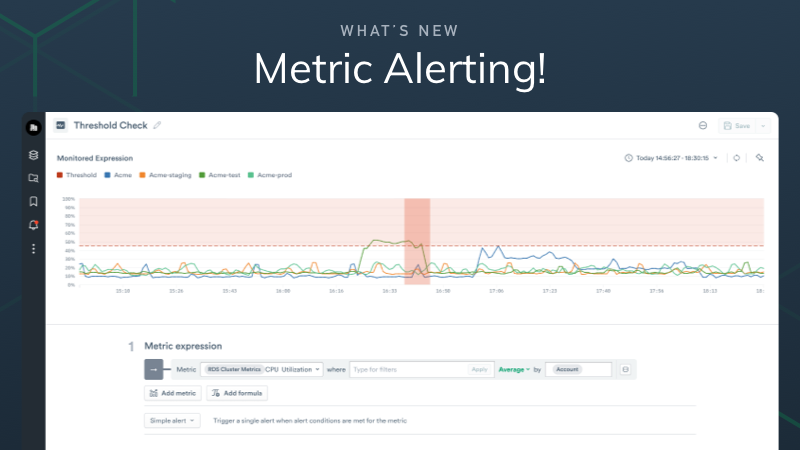
A Simple Example
Here I’ll walk you through setting up a simple alert using the metric expression builder. You can access the new alerting experience by clicking on the “New Monitor” button on the monitor list page and selecting “Threshold metric” as the monitor type. In this simple example, I’ve selected the cpu_utilization metric made available by our host monitoring app. Users can change the aggregation function, group by conditions, and filters — all from the GUI.
Adjusting the Alignment
Let’s take a look at something a little more complex. We collect Nginx ingress controller metrics from our Kubernetes cluster. I plotted the request_duration metric, but I can clearly see that it’s a counter.
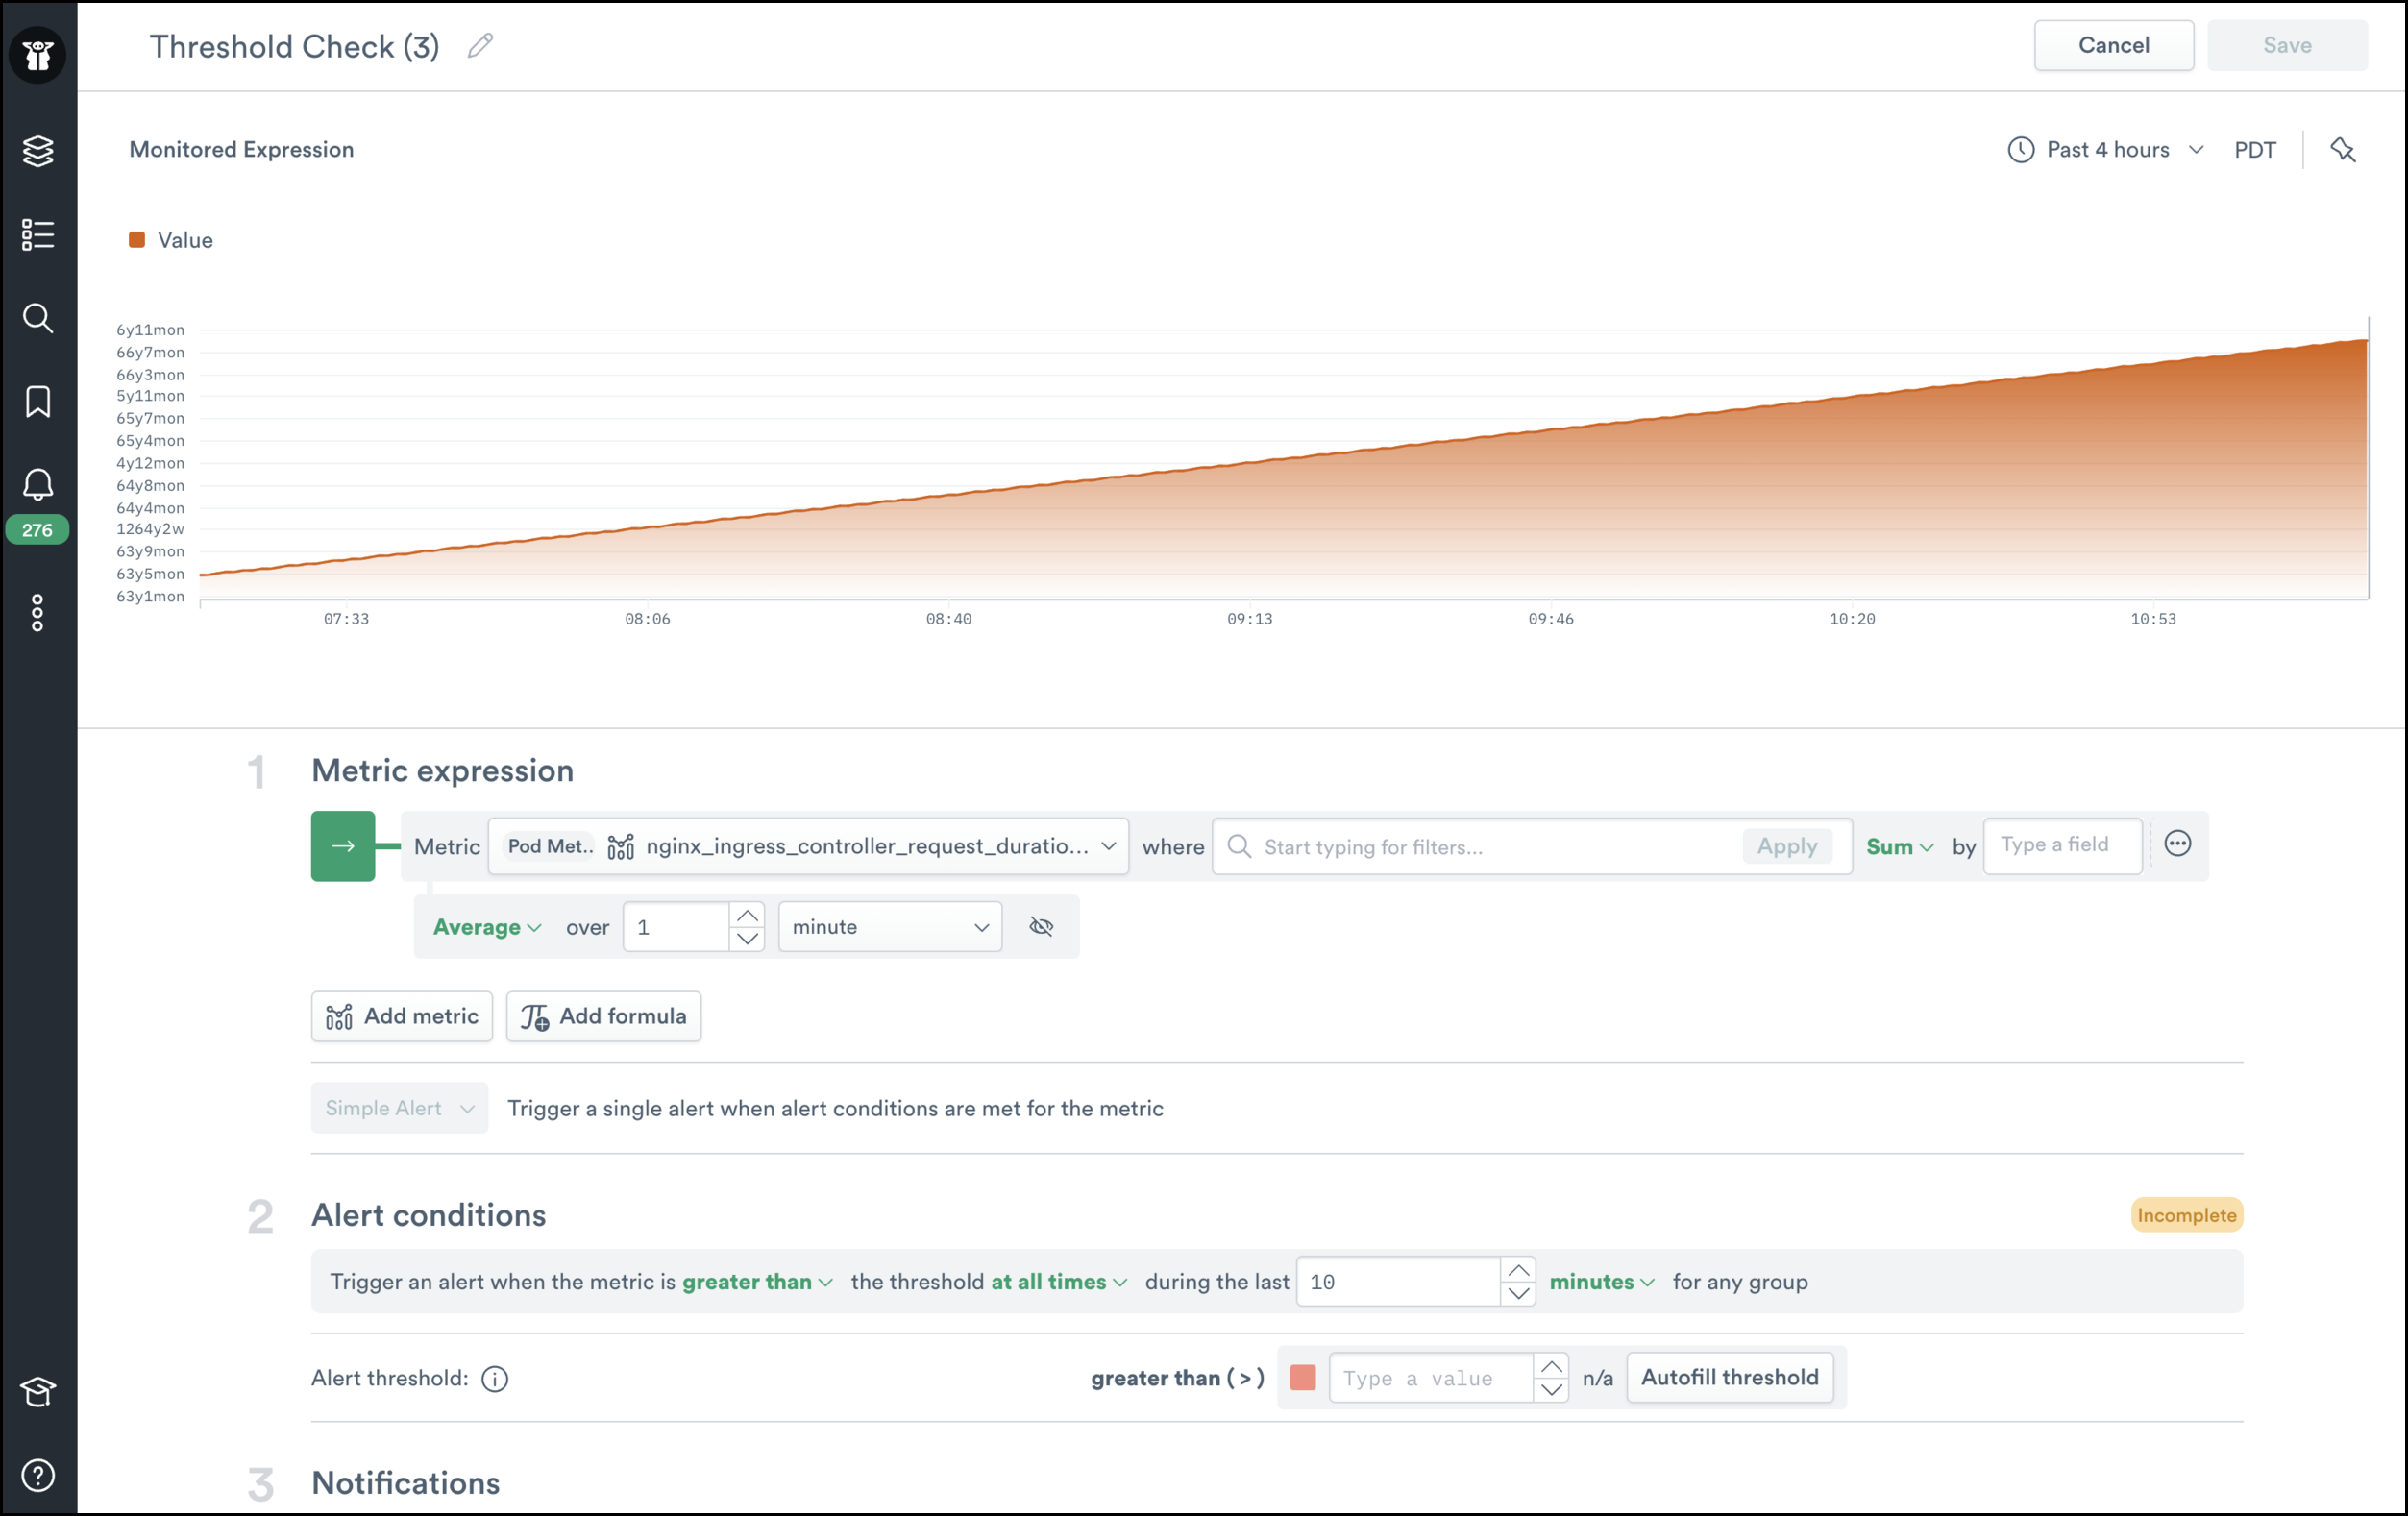
If I click “Adjust alignment”, I can specify a rate() alignment function instead of the average() that was being used. All of our out-of-the-box metrics have metadata that specifies this automatically, but it’s nice to still have this feature for custom metrics or advanced plotting.
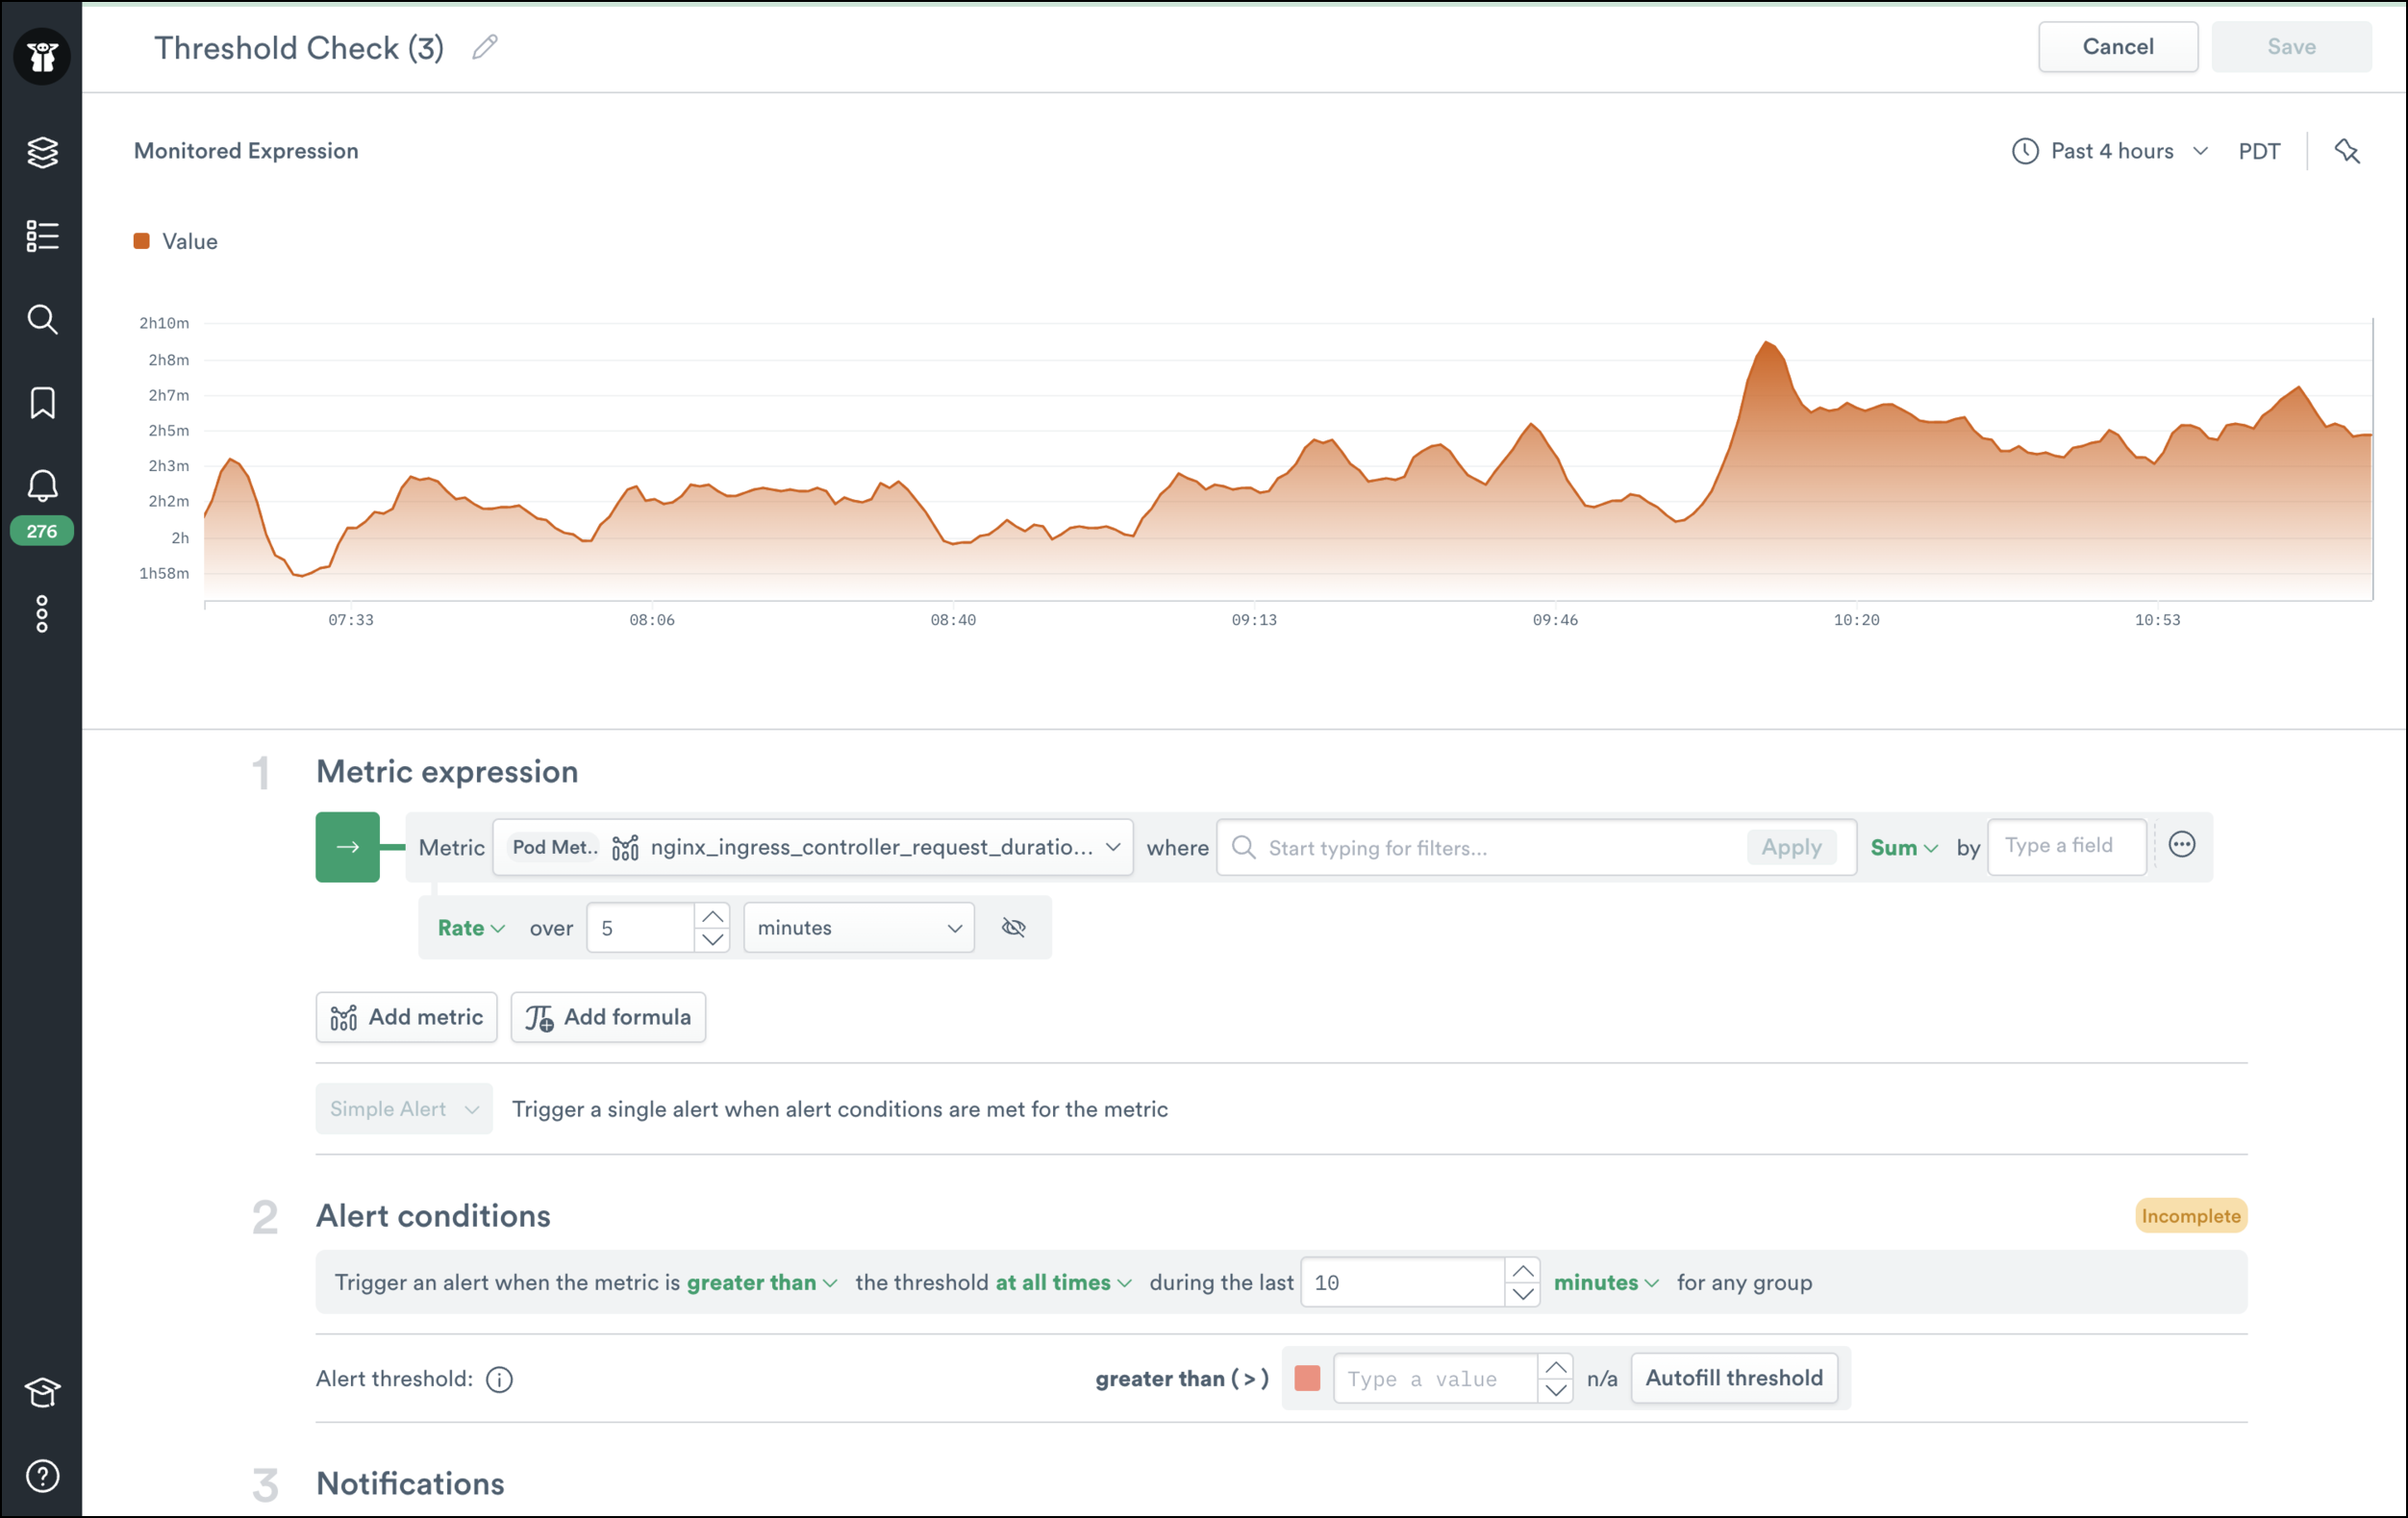
Working with Multiple Metrics
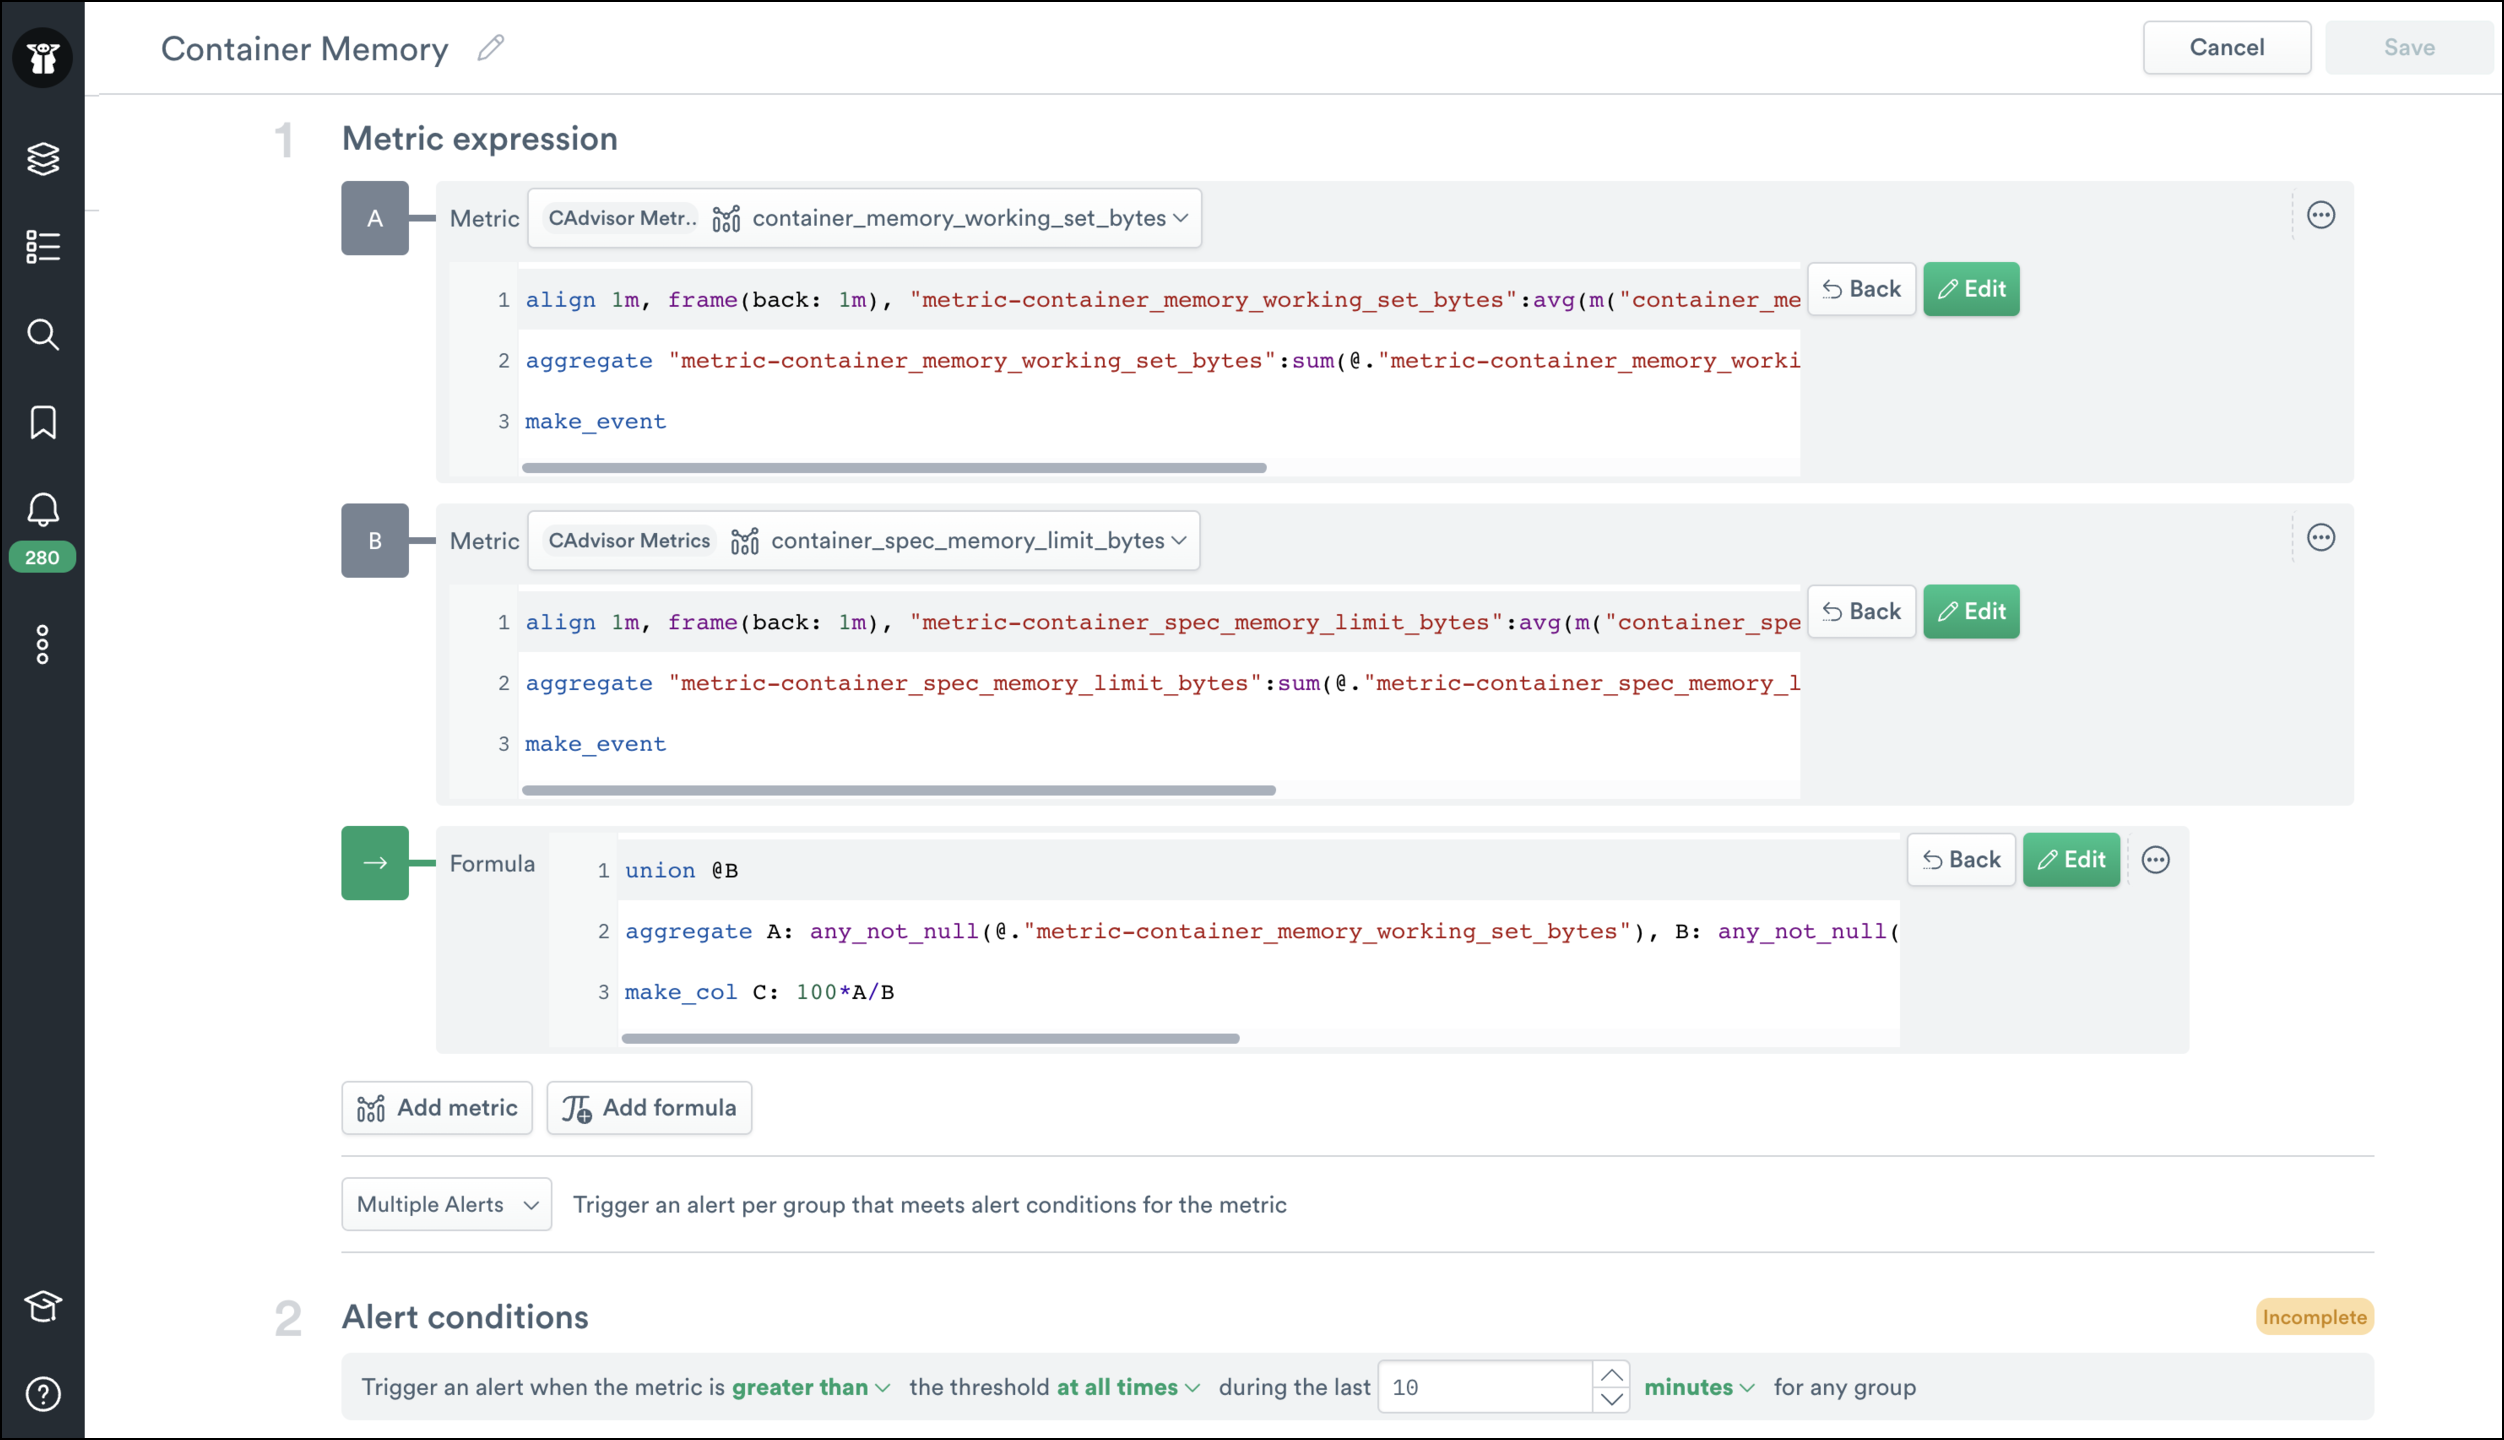
There are times when a user wants to work with multiple metrics. Common examples include computing utilization metrics by dividing multiple metrics together or looking at the ratio of requests that failed/succeeded. Traditionally multi-metric expressions have been challenging, but Observe makes this easy by automatically joining the metrics together. In the example below, I’ve computed the memory usage for containers in a K8s cluster by comparing the dynamic memory limit to the memory used.
OPAL for Power Users
The expression builder makes it a lot easier for you to build queries. However, we also want to support more complex analytics that a UI has challenges trying to generate. To support this use case, the expression builder lets you view and modify the OPAL that it generates. Let’s take a look at the memory limit example’s OPAL below.
Alert Preview
Making it easier to create metrics expressions is only half the battle when it comes to alerting. We heard from many users that a quick feedback loop between the time an alert was created and the time it actually fires is essential to building less noisy alerts. That’s why the new alerting experience includes a rich preview.
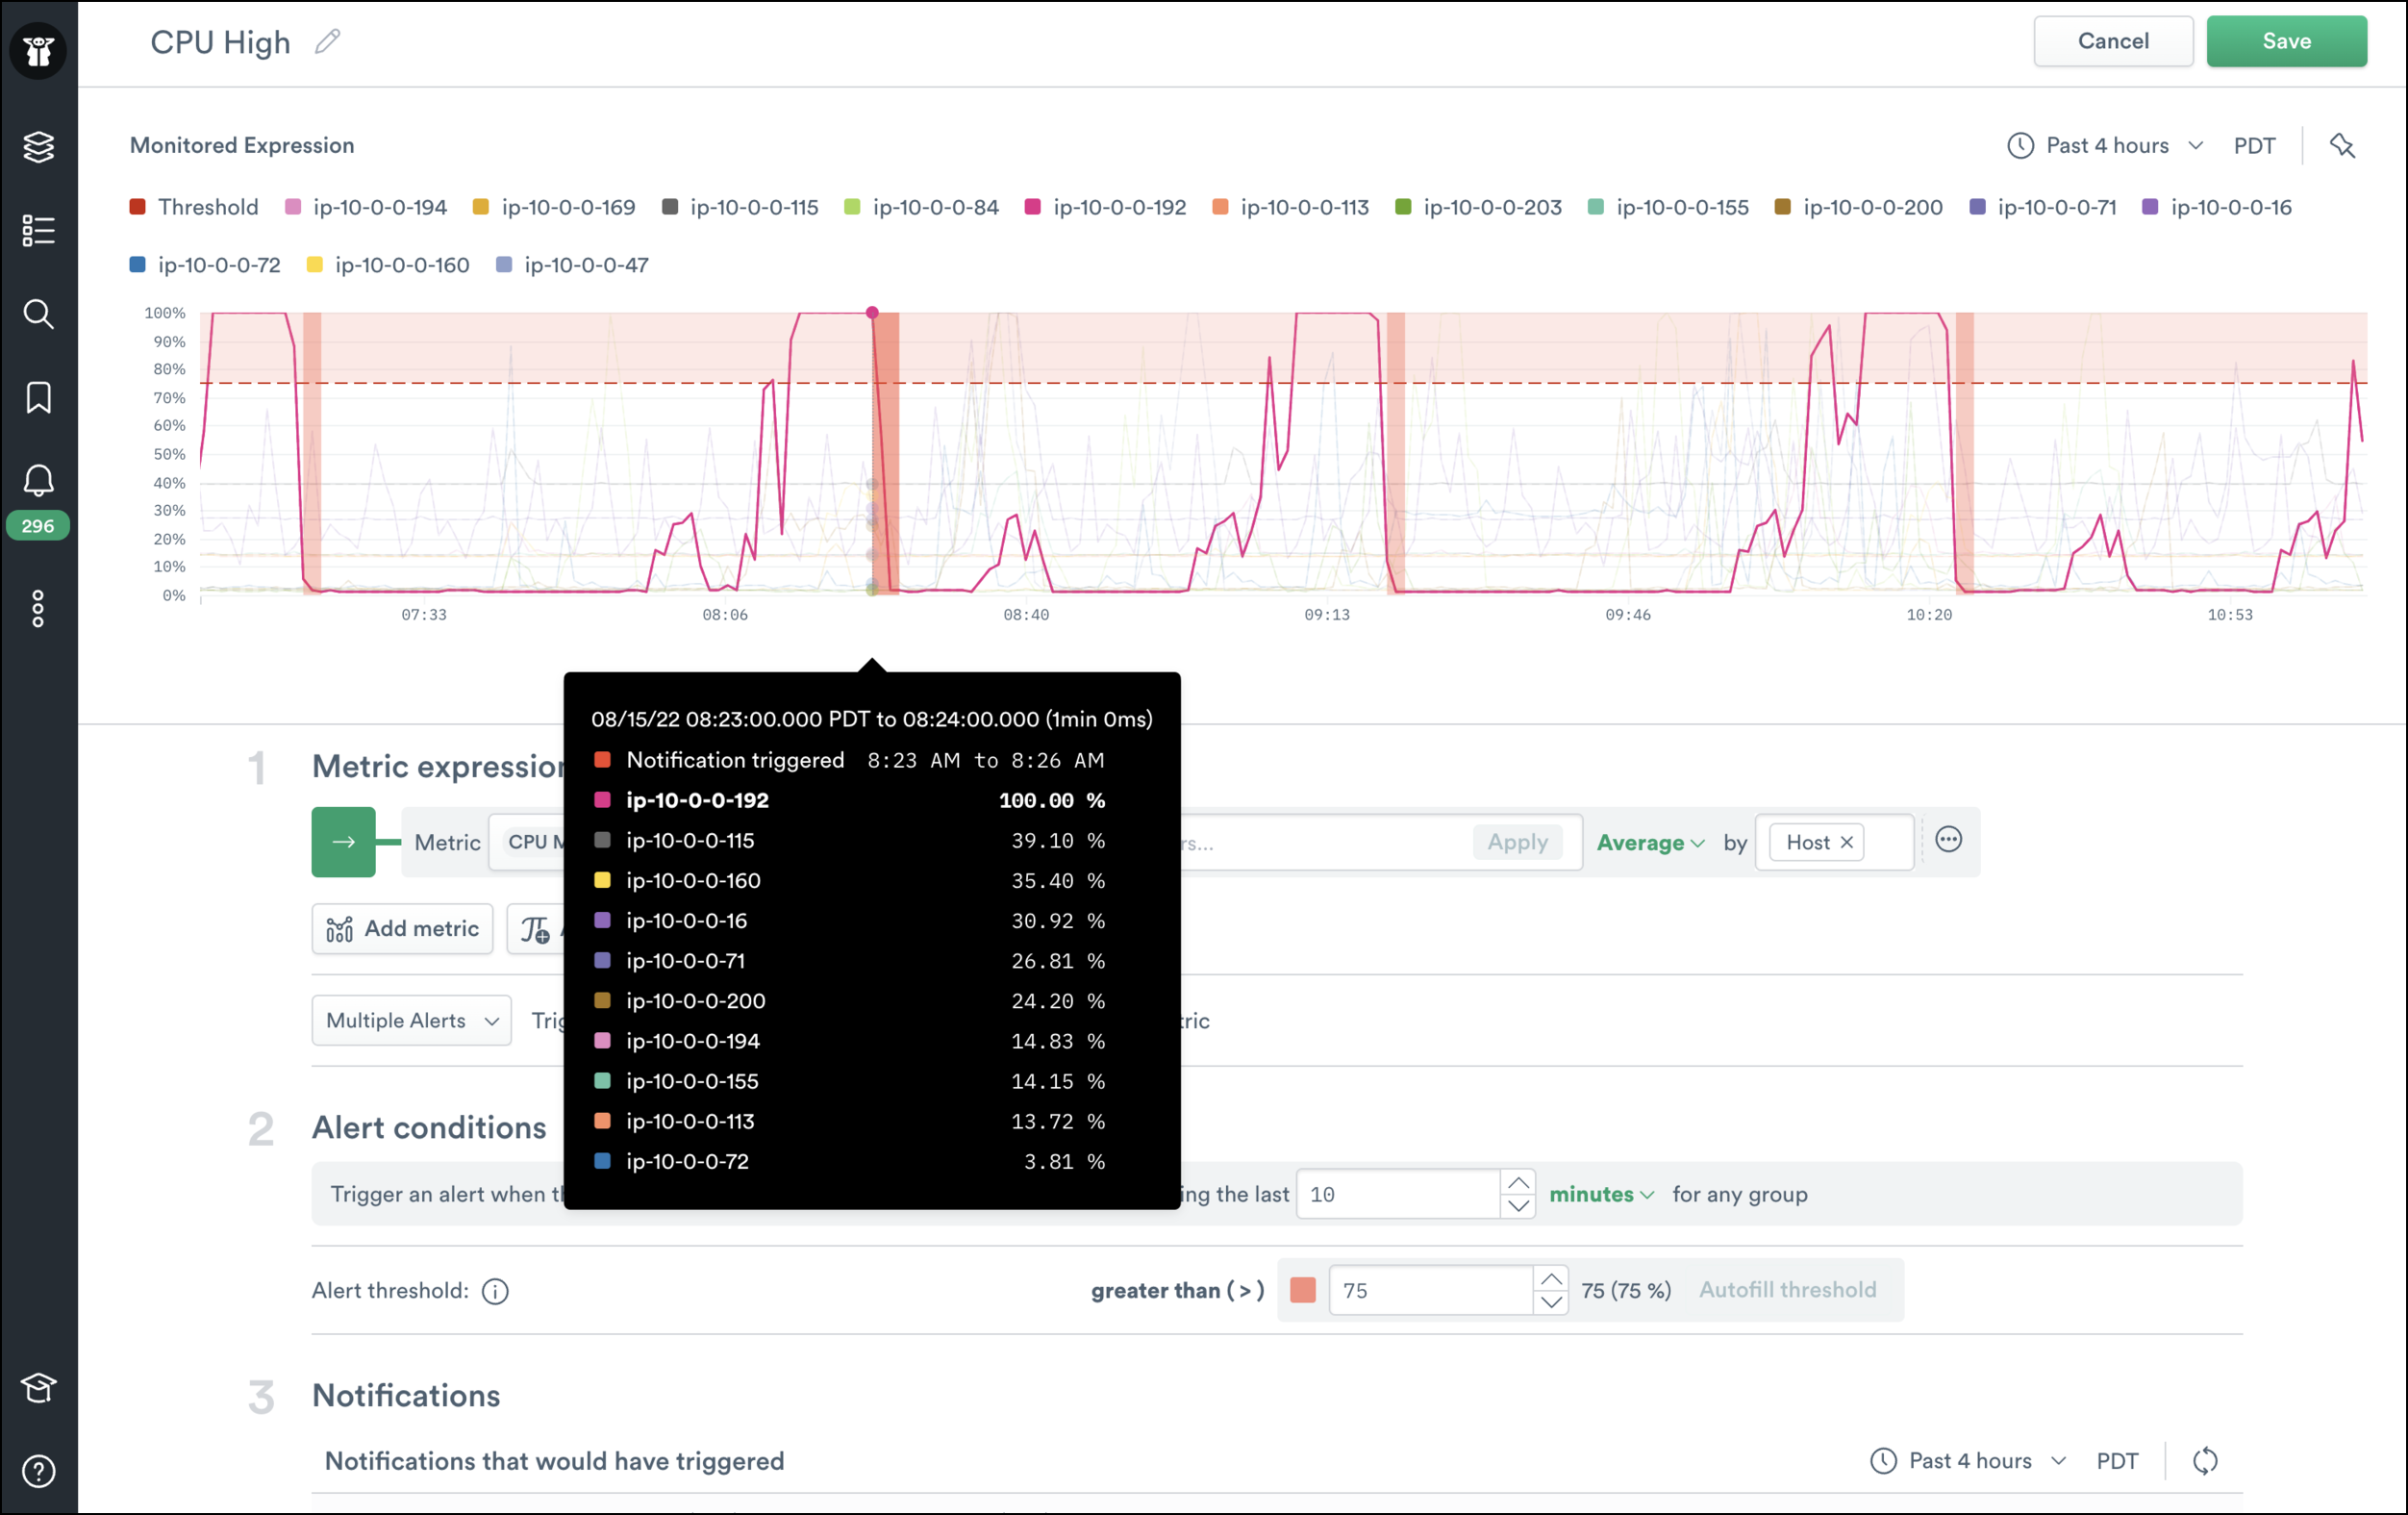
Users can see when and how long alerts would’ve been generated to help them gauge whether it would be a good or noisy alert. Since Observe keeps 13 months of data by default there’s plenty of preview data to sample from.
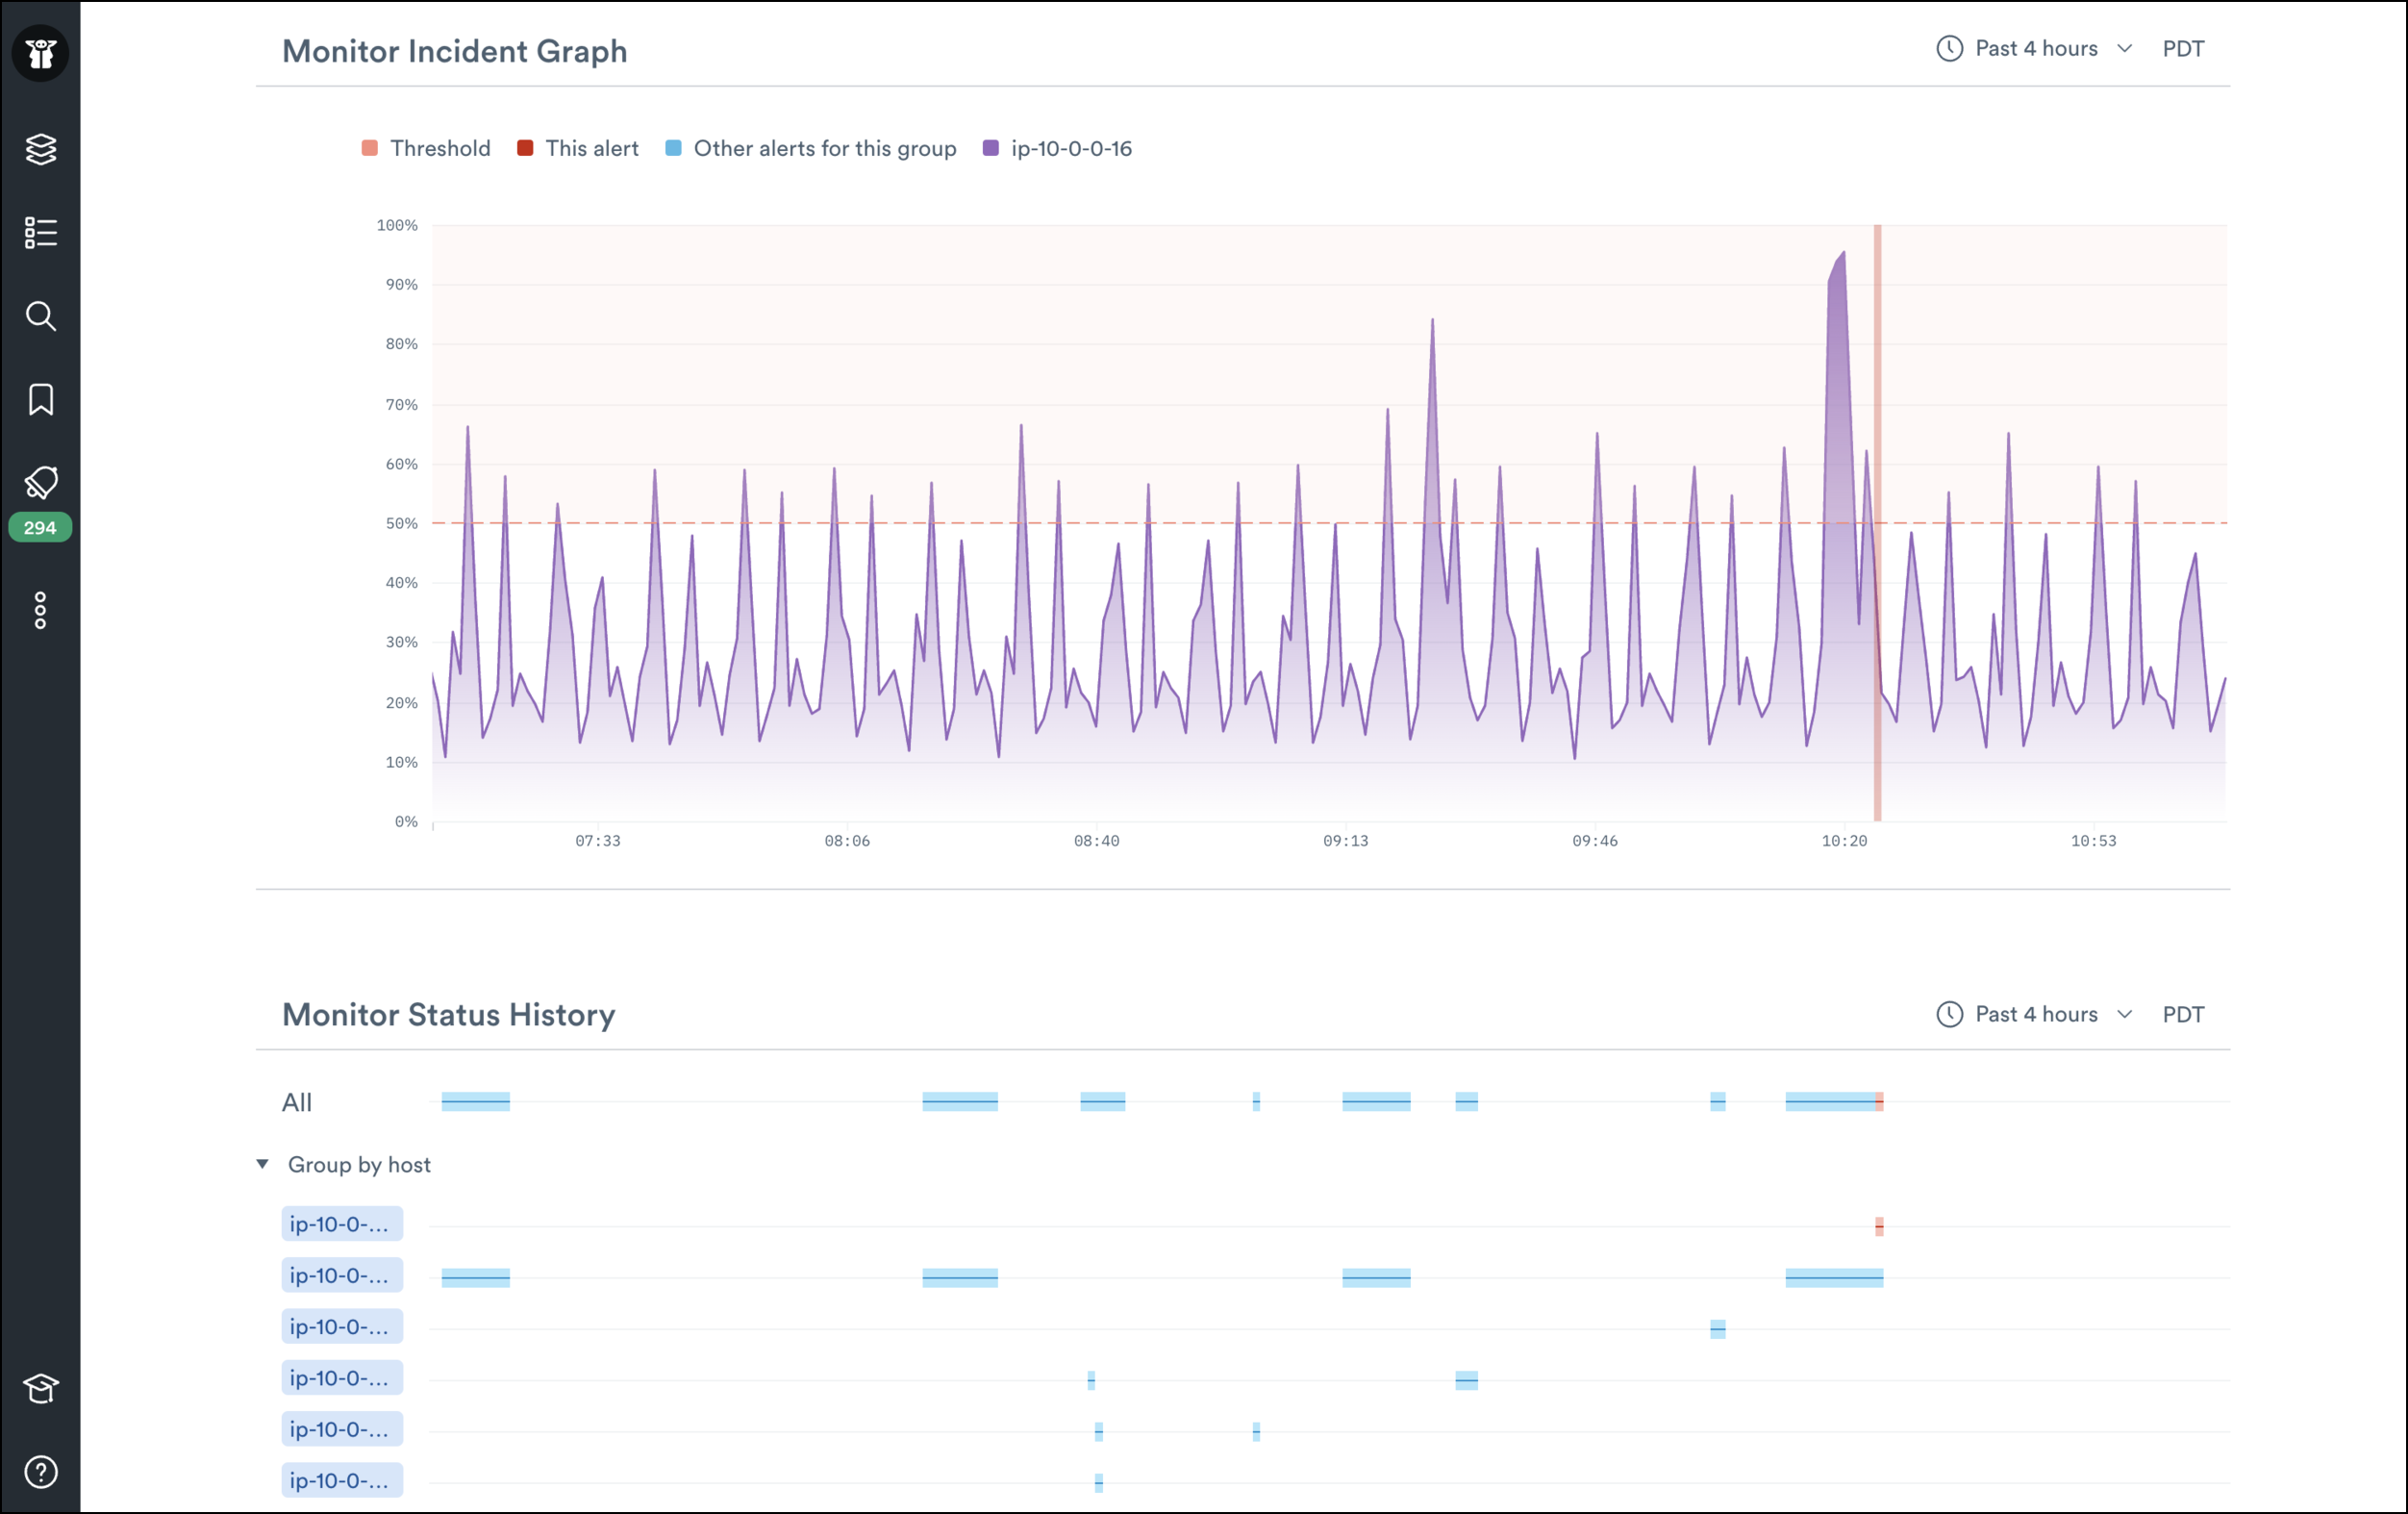
Notification Page
When a user gets paged with an alert, getting them the right context quickly is crucial. Our metric notifications provide users with an incident graph that shows when their metric entered a bad state. We also provide them with a history of when the monitor fired and links to Observe datasets so they can quickly pivot from infrastructure to a user, CI/CD toolchain, and more.
Note: Metric alerting is currently in public preview.
What’s Next
Right now the expression builder is a standalone tool for alerting, but we are currently working on adding it to our dashboard creation and worksheet features. In the meantime, head over to our docs to learn more about how you can use the expression builder to make alerting easier!
If you and your team want to spend less time configuring alerts, and more time building the things that matter to you then request trial access here.