The State of Observability 2022: Key Findings
 By Liam Rogers,August 8, 2022
At Observe we talk about observability every day, but many companies are still learning about how to achieve it and capitalize on its many benefits. It isn’t always a simple process and there are challenges that organizations will encounter in the process of achieving observability. Our State of Observability report examines where organizations are at in their journey, the challenges slowing them down, and the benefits they have achieved. Whether you’re just starting with observability or further along in the process this report will help you determine how your organization stacks up with the broader industry.
In March 2021, we launched our inaugural “State of Observability” report. There have since been many imitations, but don’t be fooled by lesser studies because we’ve returned with the 2022 iteration of the longest-running State of Observability report! We again partnered with CITE Research to survey IT professionals on the topic of observability. We analyzed year-over-year data to see how trends have, or haven’t, changed in the past year. This time we also wanted to dig deeper into the challenges facing users when it comes to achieving observability. Additionally, we looked into new issues such as long-term data retention and cloud-native application troubleshooting.
We’ll dig into a few of the insights here and in future blog posts, but for the full report including more data and analysis, you can download it here.
Adoption and Maturity
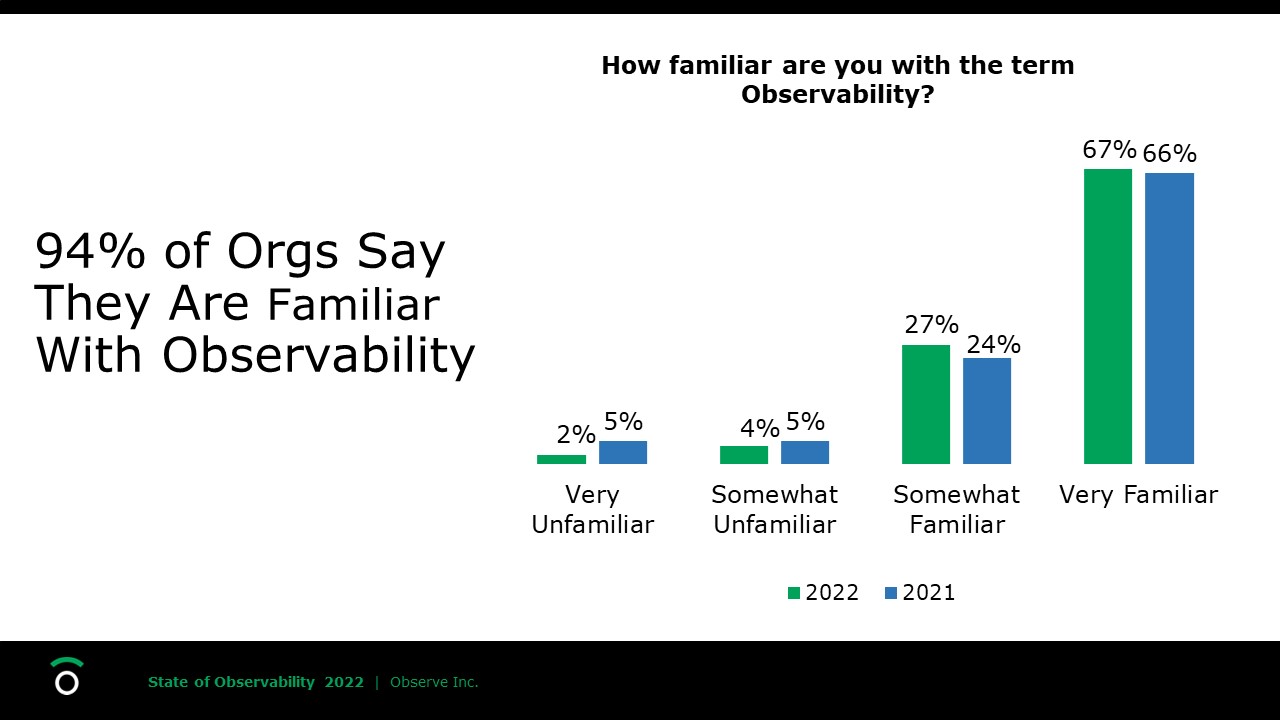
Observability has become more of a household name than it was even a year or two ago and the majority of organizations cite familiarity with the term. The majority of organizations cite the practice of familiarity with observability. However, the number of orgs that say they have teams practicing observability is significantly higher than the number that say they are very familiar with the term itself which indicates there is still a knowledge gap.
There is ongoing confusion around what the term “observability” means and how best to achieve it. Even now, there is no shortage of definitions perpetuated by vendors and users (you can find some handy info on what observability is and isn’t here). Some of the lingering perspectives continue to prop up silos of telemetry data and detract from an organization’s ability to achieve observability. Though many organizations say they are practicing observability it is likely that the interpretation of observability will vary from one organization to another.
As far as maturity goes, only 35% of organizations cite widespread production use of observability in their organization, which indicates that many are still in the earlier stages of implementation.
Measuring Observability’s Impact (and Why You Should)
Organizations believe there are many benefits to gain from observability and the top three are better service reliability, improved customer satisfaction, and faster troubleshooting. However, not all organizations are equipped to measure the impacts of observability and confirm whether or not their usage is meeting their aspirations. According to our report, only 38% of organizations have a way to measure the impact of observability. This number is higher (53% total) for organizations that have made observability a high priority, which demonstrates that organizations that are more invested in observability are more likely to achieve the desired outcomes. For example, organizations that prioritized observability more often saw measurable improvements across the board in categories such as customer satisfaction, service availability, and the frequency of deployments.
If measuring the impact of observability was always simple and easy everyone would do it, but that’s not always the case. Your universe of data should facilitate the process of measuring observability’s impact. Because Observe understands the relationships between your data we make it easier to draw connections between “things” like your customers and application performance, making the benefits of observability much easier to track. For tools that lack the big picture it can be hard to connect the dots to what, if any, benefits are really being obtained.
Tool Sprawl and Why it’s Still a Problem
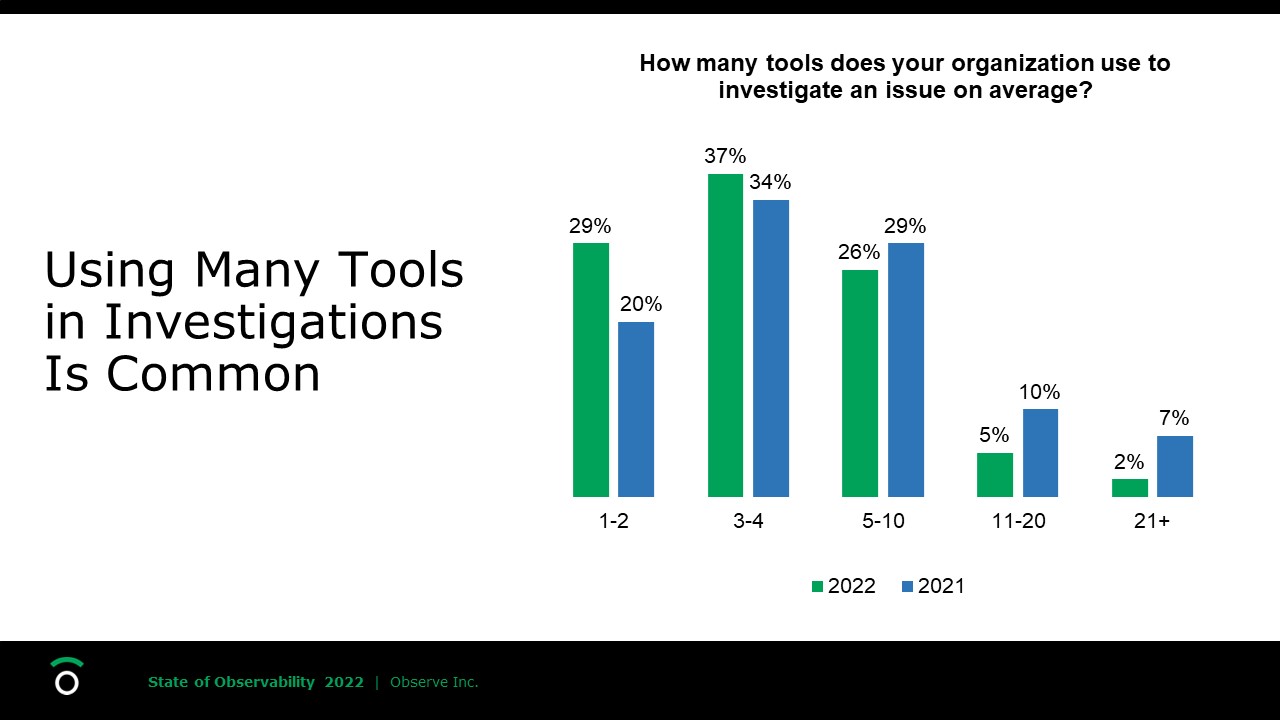
Monitoring tool sprawl, an ominous and undesirable trend, is most often on the mind of the C-suite because of the cost implications, but it impacts SREs and DevOps teams as well. It’s common for many tools to be in use for troubleshooting and 70% of organizations are using three or more tools on average to investigate an incident, that includes 33% using five or more tools.
Although it’s common to use many tools purchased from one or more vendors, the lack of integration between them can hinder investigations. Observe offers a singular place to store, analyze, and visualize the various types of observability data your organization generates so that you don’t have to hunt down data in multiple tools.
Even though it’s common for organizations to have many monitoring tools in place, 81% of organizations are considering adopting new observability tooling in the next year. This indicates that existing tools are not effective in meeting all needs. Undoubtedly tool sprawl and consolidation efforts will continue to be a challenge in the near term and it’s important for organizations to end the cycle sooner rather than later.
Observability’s Big Data Challenge
We’ve said it before and we’ll say it again, observability is a data problem and data needs to be contributing to solutions, not problems. The current trend is that organizations are drawing on a growing arsenal of data collection methods. This means more data is being ingested from more sources, with much of it lacking in structure. Seventy-eight percent of organizations ingest more than 100GB of observability per day. Without context, that data won’t become useful insights and you can’t have observability. Observe is designed to pull relevant information from your telemetry to understand the relationships between your data to make time for insights faster than ever.
However, getting the maximum benefit from that data without blowing the budget is increasingly difficult. According to our report, 46% of organizations cited discarding telemetry data, that they would have otherwise kept, solely because of cost-related concerns. This demonstrates the way cost impacts an organization’s ability to retain data longer. Observe uses 13-month retention by default and users can store data even longer if they want. Since Observe uses usage-based pricing and schema-on-demand, rather than charging based on data ingested and indexed, the flexibility to store more data longer without worrying as much about costs is in your hands.
MTTR: Don’t Stop at “Good Enough”
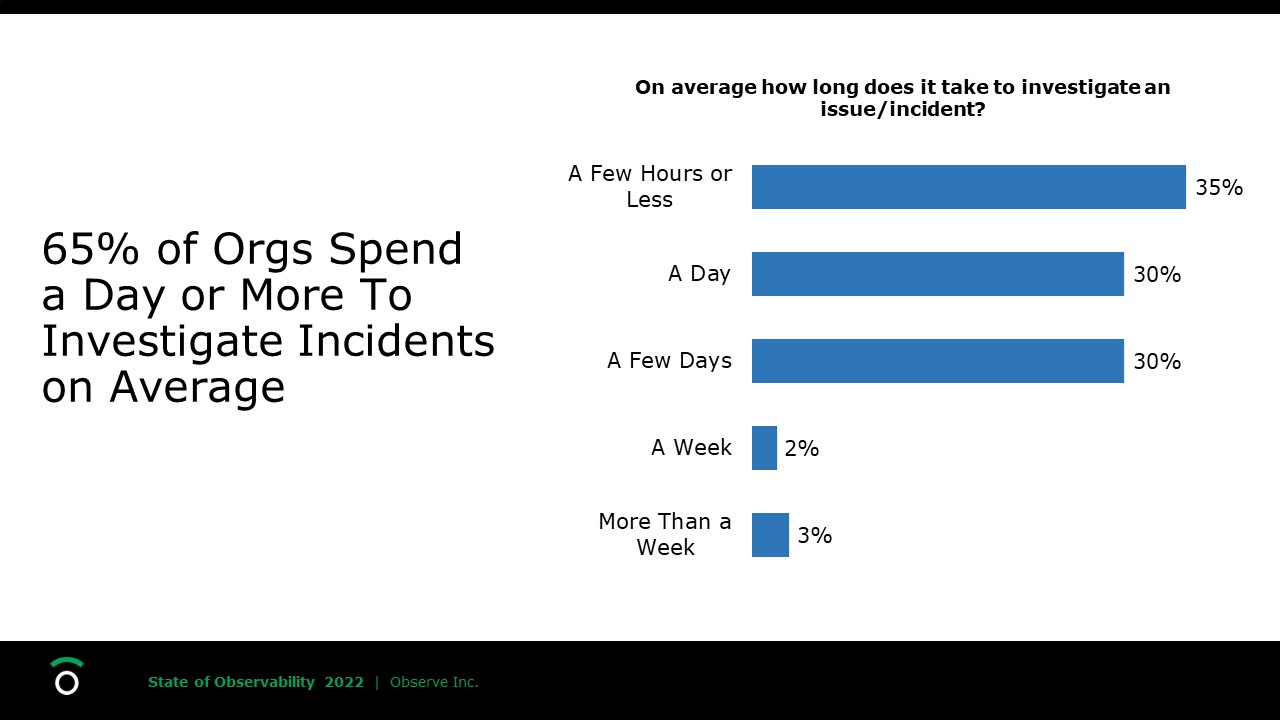
Mean time to resolution/repair/remediation (MTTR) is a metric used to assess the average time to detect and fix an incident. For all the talk about eliminating tool sprawl to bring costs down and reduce data silos, a key driver for better observability should be reducing your MTTR. Thirty percent of organizations cite one day as their average investigation time while another 30% cite a few days, with only 35% able to investigate incidents in a few hours or less. Given the proclivity of the “fail fast” mindset in software development incidents will continue to be commonplace and it’s imperative that organizations are able to recover quickly.
The complexity of modern highly distributed applications has been a major driver for observability. Surprisingly, around half of organizations consider their existing monitoring tools to be effective for troubleshooting cloud-native applications. However, similar numbers also cite that they spend a day to a few days on investigations which tells a different story about effectiveness.
While a day or a few days might not seem like the end of the world depending on the incident and the circumstances, observability and effective tooling should be focused on shrinking those times and providing measurable benefits – anything less is simply aspiring to maintain the status quo. Observe makes data context a priority so that users can achieve observability and reduce MTTR, in addition to saving on cost with usage-based pricing.
If you want to dig deeper into the data, you can find the full State of Observability Report here. And if better MTTR without the data silos and tool sprawl sounds interesting to you feel free to join us for one of our weekly demos to learn more about Observe.