Customer Spotlight: Linedata | Seeing Through the Clouds
 By Observe Team ,May 24, 2021
By centralizing observability data from all of Linedata’s environments and sites in a single platform that all engineers can access, Observe makes it much easier to troubleshoot complex issues across all of its sites and cloud accounts.
Every company faces observability challenges. But Linedata, a global provider of data processing apps for the financial services industry, has it especially hard when it comes to keeping track of what is happening within its systems.
The company’s Platform Management team — responsible for keeping the company’s SaaS application platform running smoothly — must maintain visibility into cloud-native environments at multiple sites spread across the globe. At the same time, Linedata needs to stay competitive by continually releasing new features and squashing bugs as they arise. This means utilizing state-of-the-art CI\CD tooling and generating mountains of data each day.
Observe is a key component of Linedata’s modernization initiative. By allowing the team not just to centralize observability across environments that are otherwise siloed, but also enabling a modular and DevOps-friendly approach to observability. Observe gives Linedata the visibility it needs to manage complex systems efficiently on a global scale.
Without Observe, Linedata’s move to the cloud wouldn’t have gone quite as smoothly. Ephemeral compute instances, containers, and orchestration tools are constantly in a state of flux; without the proper Observability tools all that data becomes white noise and problems get buried under mounds of, seemingly, unrelated data.
Challenges: Siloed teams, siloed data, siloed accounts
With 1,300 employees and offices that are spread across the United States, European Union, and Asia, Linedata is a large company with a sprawling technological footprint. For Linedata’s Platform Management team, the scale of their operations created several challenges.
Lack of consistent observability tooling
With so many sites and business units to support, maintaining across-the-board visibility into what was happening within each system was a real challenge. “We used Nagios for some alerting,” according to Andrey Budzar, Linedata’s Director for AMP Cloud Platform and DevOps said, but “there was very little logging — It was a nightmare.”
Disjointed data
Originally, engineers at each site relied on different tools for visibility. That made it hard to aggregate data across sites. It also forced the company’s central Platform Management team to juggle disparate tools when troubleshooting issues or auditing systems — hardly an efficient strategy.
Multiple accounts
On top of all of this, Linedata’s various engineering teams maintain more than thirty different AWS accounts. This is anyone’s security nightmare without a proper observability tool. Logging in to each of these accounts individually when troubleshooting issues was not an option — a real SLA killer.
Making the move to Observe
These challenges prompted the team to research observability tools that would make it possible to consolidate troubleshooting, security, and compliance data from all of Linedata’s business units and locations into a centralized location. However, the team wasn’t just looking for a tool that could aggregate data, they also wanted a solution that was easy for novices to learn. Lastly, they were looking for a tool that could easily structure and relate data to derive insights quickly — without blowing their entire budget.
In Observe, they found an observability tool that caters to each of these priorities. “We made the call to go with Observe, ‘explained Budzar, because “they are a new kind of observability vendor” that does much more than just aggregate basic monitoring data in one place.
Linking and correlating disparate data sets
 With Observe, Linedata’s Platform Management team was able to evolve its observability practices from simply collecting data from across its fractured estate, to structuring and relating data in ways that bring critical relationships and new insights to the surface.
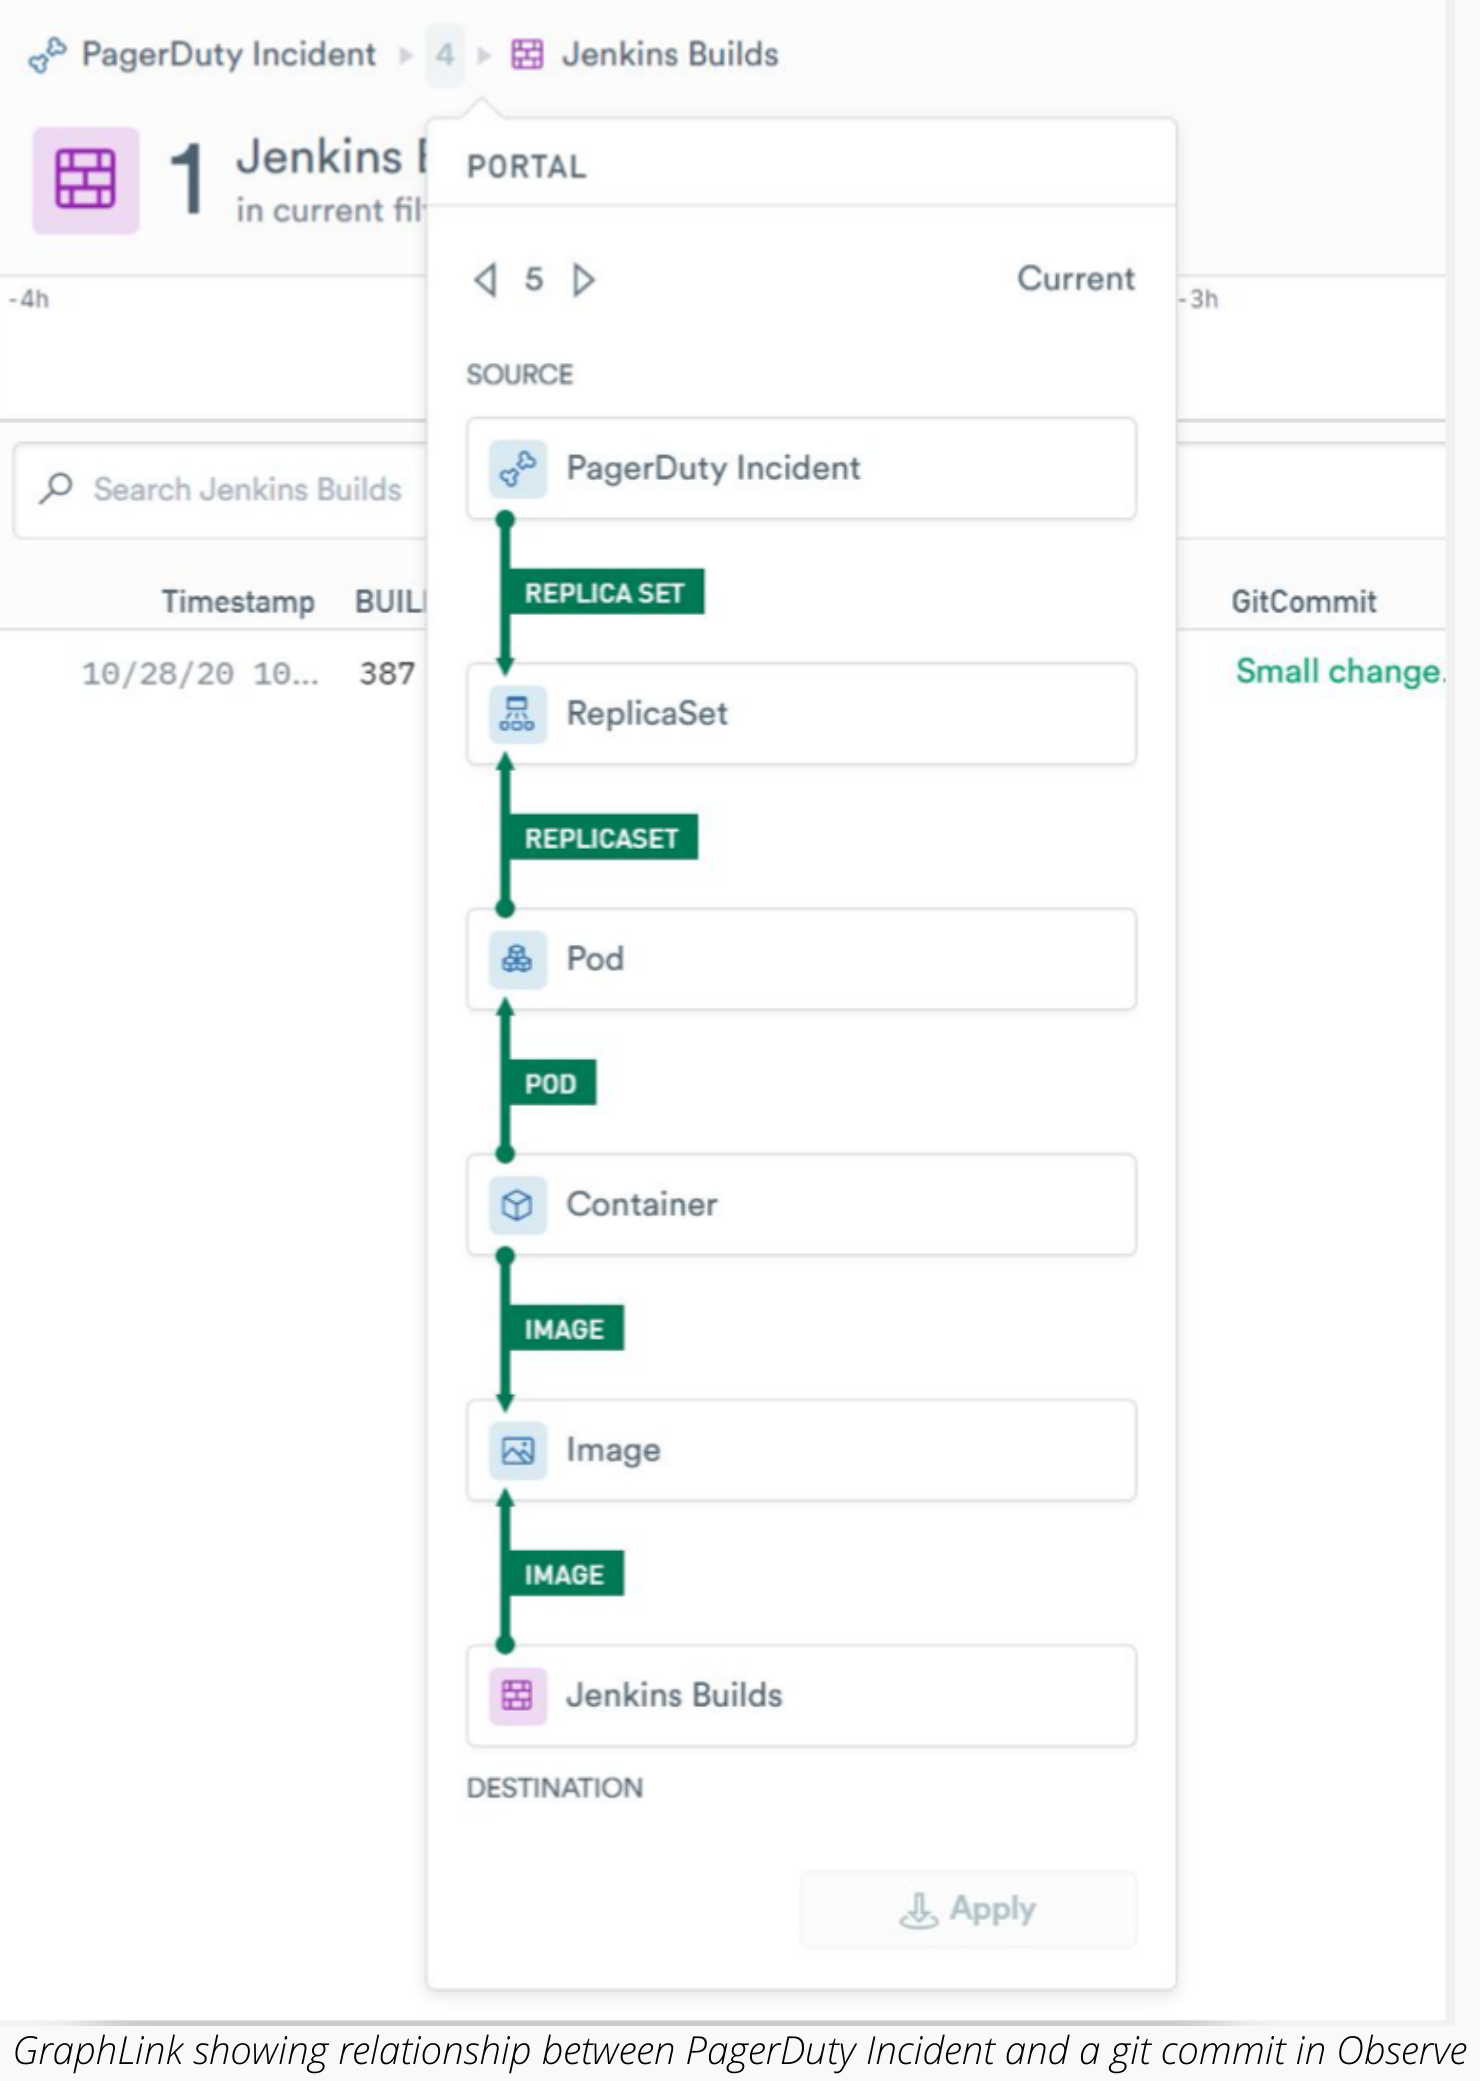
Instead of simply setting up alerts with tools like Nagios, “now we’re starting to curate the data — make sense of it — and form relationships between datasets using Observe’s GraphLink,” Budzar said. “The beauty of this approach is that we get context-rich landing pages — sort of dashboards on steroids — for free.”
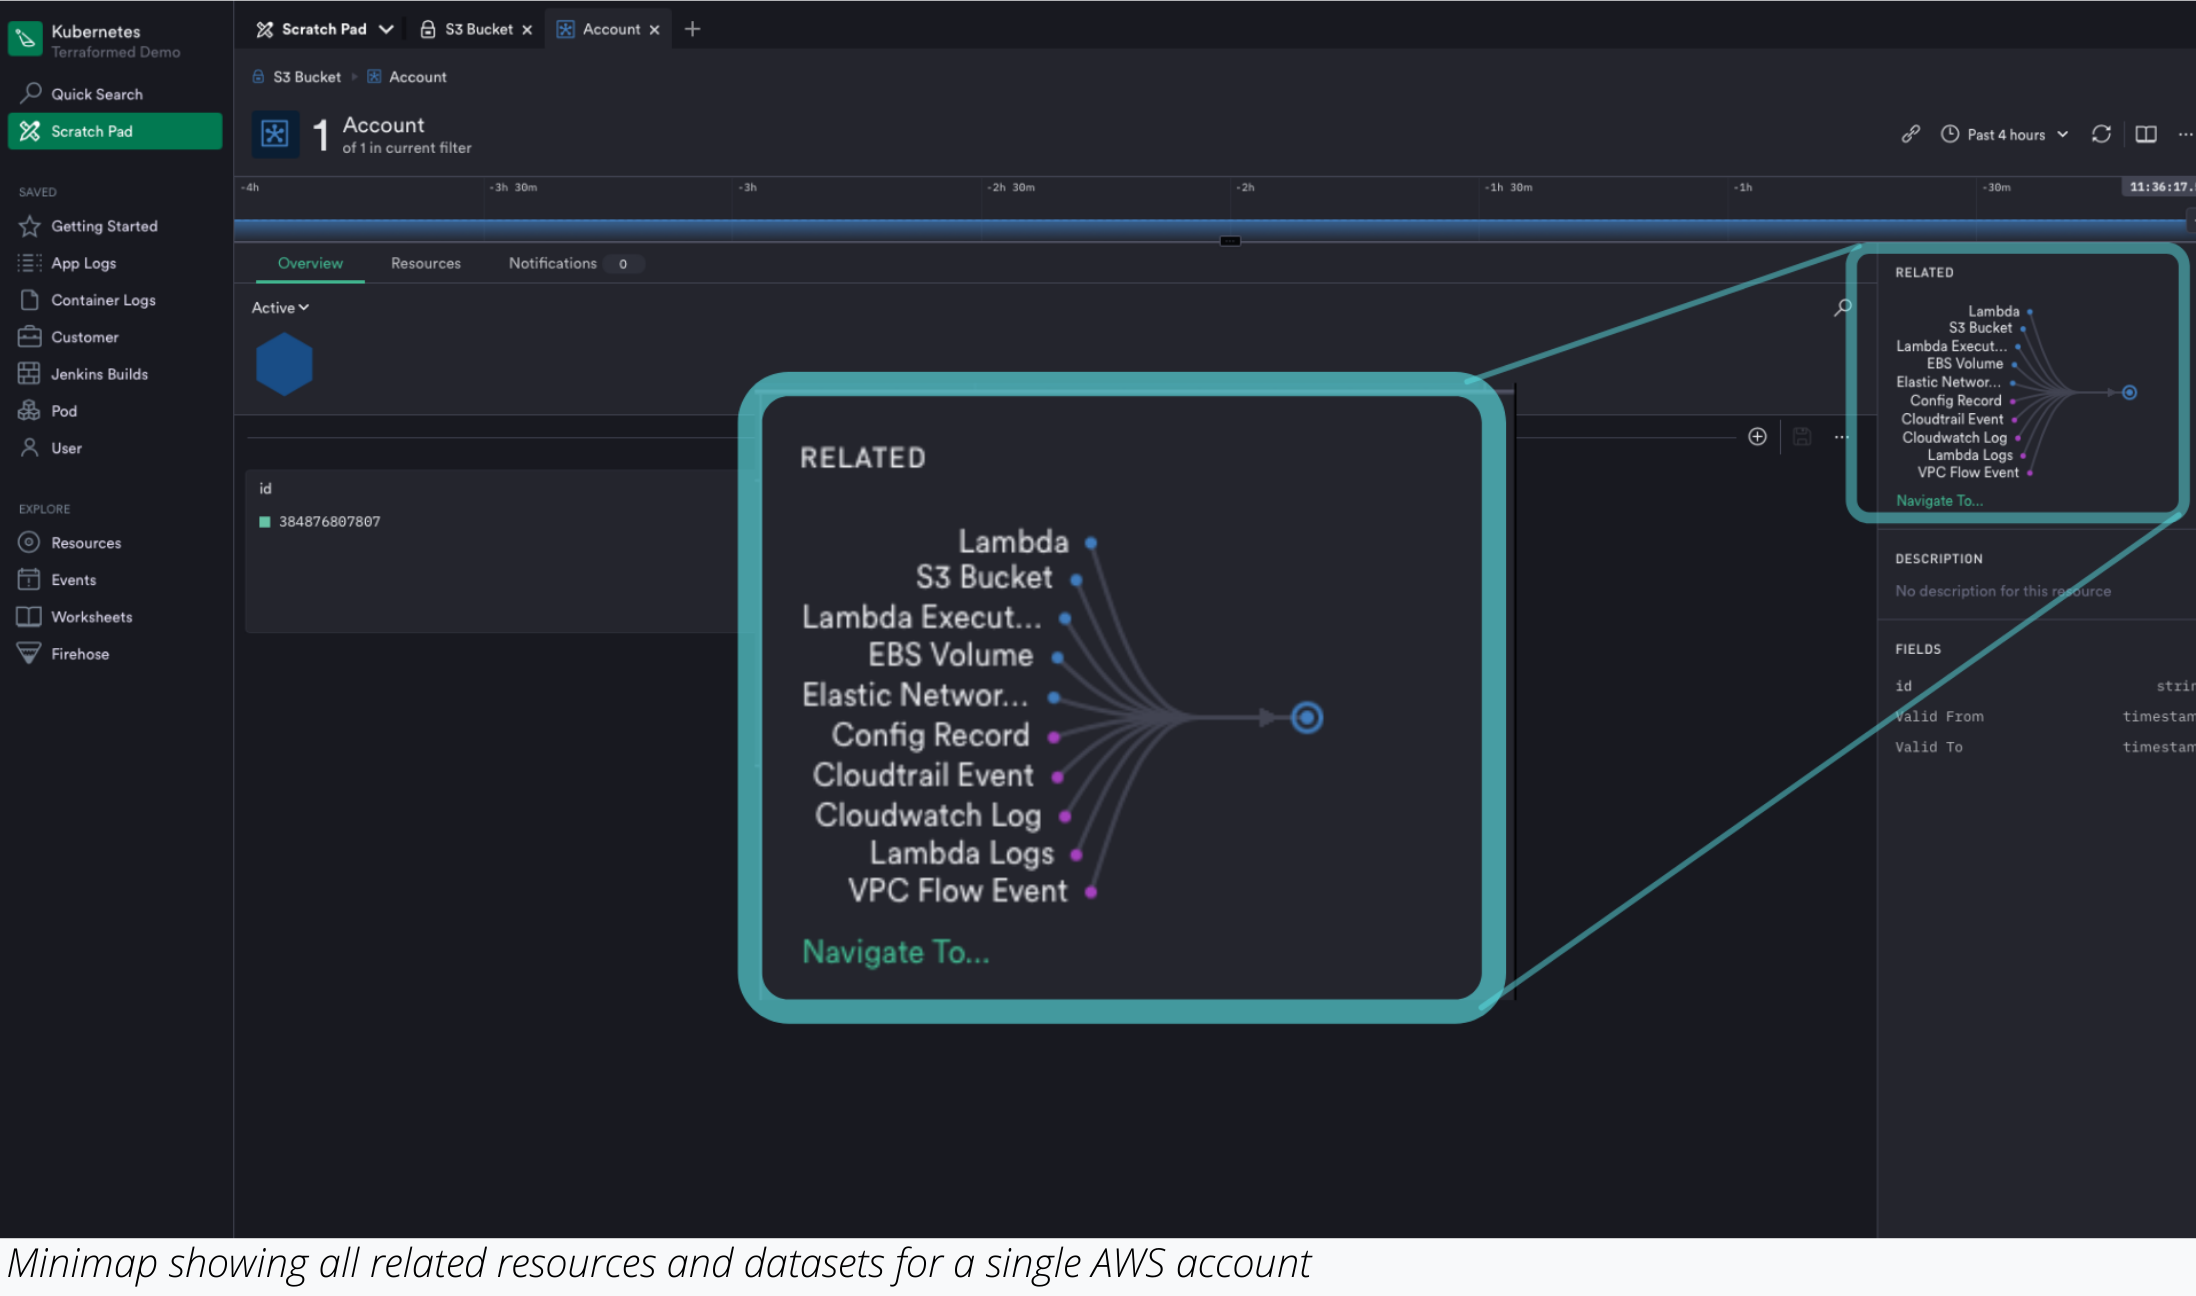
Not only that but Observe’s ability to link resources together allows Budzar’s team to work with large volumes of data efficiently. On other observability platforms that the team evaluated, Budzar said, engineers, would have “20 tabs open, copying and pasting between tabs while trying to look for correlations.” But in Observe, they can quickly build linkages between different data sources — from IAM logs and S3 buckets, to pull requests and audit logs. No more wasted time context switching.
The result is an ability to troubleshoot issues with a degree of speed and clarity that the team simply couldn’t achieve using other tools. “Observe has given us a level of visibility we never had before,” Budzar said. But the benefits don’t stop with Budzar’s team, their auditors love it too. Having data all in one place with clear insights and linkages between users, applications and infrastructure are what auditors dream of — assuming they dream about their job.
Observability across multi-account environments
By centralizing observability data from all of Linedata’s environments and sites in a single platform that all engineers can access, Observe makes it much easier to troubleshoot complex issues across all of its sites and cloud accounts.
Historically, engineers needed to switch between multiple accounts when troubleshooting issues. But with Observe, they can do it all from a single tool. “For example,” Buzdar explained, “when an engineer gets an IAM error for an S3 bucket, they just log into Observe and can trace the error to the access control policy, and even find the person who made the change that caused it.”
Thanks to Observe, Linedata can keep expanding its cloud environments without compromising on observability.
Conclusion: Beyond centralization
Just as DevOps has brought sweeping changes to the way people create software, observability promises to do the same in the way people gain insights into their increasingly complex environments. Observability in 2021 is a must, but there’s a problem. Modern observability tools extol the virtues of the “3 pillars” architecture — which unnecessarily segregate related data into silos — making it harder to draw correlations from data.
The good news is, Observe shatters these silos and assembles meaningful structures that the user understands intuitively. This helps teams gain an unprecedented level of visibility into all of their systems. More importantly, by making it easy to structure and relate disparate data sources, Observe unveils relationships that help engineers pinpoint root causes and remediate complex issues an order of magnitude faster than other observability products.
No matter where you are on your observability journey, or how complex your infrastructure may be, Observe helps you know what you need when you need to know it.
Customer Video