Observability With Transparent, Usage-Based Pricing
 By Jeremy Burton,May 10, 2021
The customer should have all the data they need to manage their usage. An observability tool that didn’t provide this level of observability — in terms of usage — would be very odd in my opinion.
Nothing New Under the Sun
If you’ve spent any time in the world of infrastructure monitoring, log analytics, or APM in the past decade, you will have experienced almost every pricing model known to humankind. Turn the clock back a few years, and you’ll see that most companies charged by the volume of data ingested, or by the number of physical hosts monitored. In a time when application functionality changed only a couple of times a year and was largely sedentary once they rolled into production, one could argue a strong case that this all made sense and that it was “fair”.
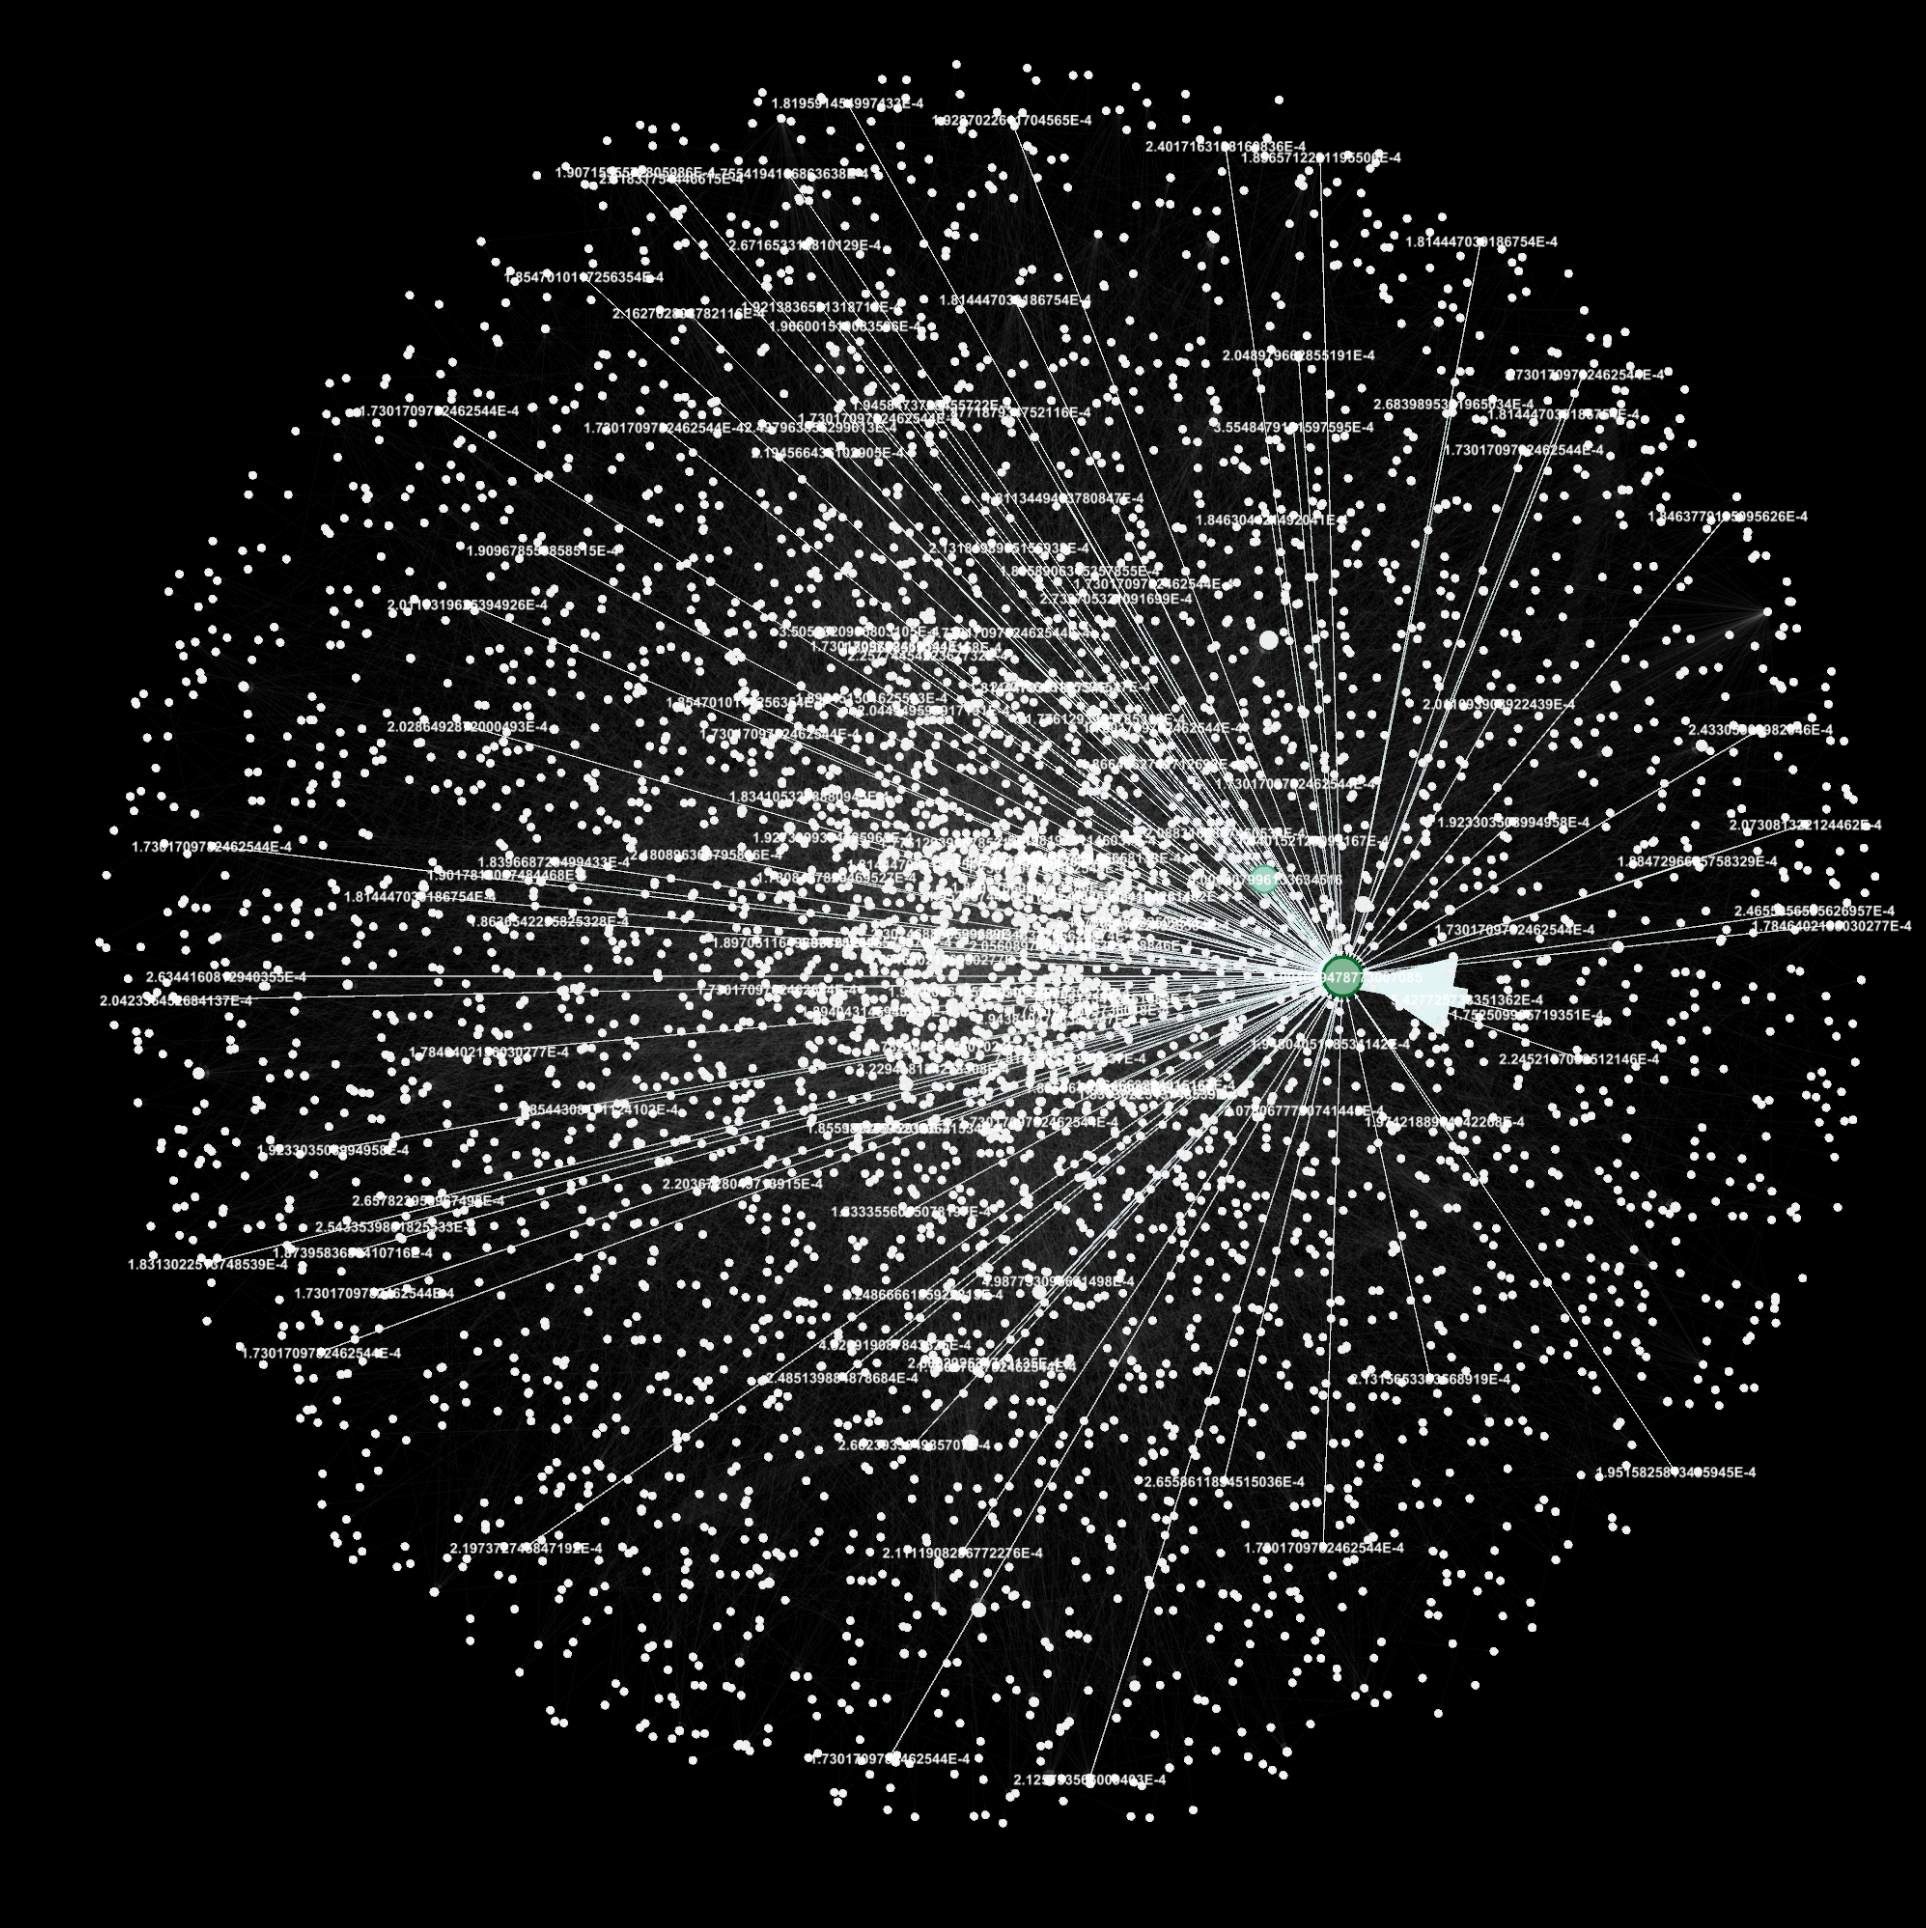
Does your microservice architecture look like a ‘Death Star’ yet?
The world is vastly different today; modern applications can change multiple times a day. They are a sprawling collection of microservices, telemetry data, and once in production, the applications are hardly static. They are in a state of constant flux.
Modern infrastructure elements such as Kubernetes allow for application code — running in containers — to move around and execute on numerous hosts.
These two factors — the volume of code changes pushed into production, and the dynamic nature of applications in production — are forcing legacy vendors to re-think both architecture and pricing models. A difficult task because legacy vendors also have a legacy business model. Any pricing change is a risk to them.
Has the ability to run in the cloud, or the ability to deliver via SaaS changed anything? Not really. Most vendors have simply amortized the cost of their current agreements over a 12 or 24-month period. Every vendor knows that magically, around 27 months or so, they start making more money off the subscription revenue than they would if they had sold their product upfront. To make matters worse; the value of these products is a diminishing return due to the sheer size of current data volumes. The more data you ingest, the less value you get in return. In telemetry data, there’s simply a lot of junk. This has given rise to a new set of vendors that pre-process information before it gets sent to be analyzed.
Pricing Re-Imagined

At a time when cloud storage is essentially free, and compute power to process stored data can be applied on the fly, this all seems insane. What if you could start over — begin the stereotypical greenfield — and do this in a way that was most fair for the customer?
First, you’d probably want users to be able to ingest and store all their data at the same cost of storing it in S3. They would then be able to ingest everything and not have to worry about filtering out data, sampling data, or adding unnecessary complexity in the data path.
Next, when data is used to troubleshoot or solve problems, it would make sense to charge for that. This is no different from a gas or electrical utility. When I use electricity I don’t mind being charged because I’m getting value. But, don’t charge me when I’m not using it. I don’t like paying my electricity bill as it is; it seems like a lot of money and I don’t get much detail except for a chart showing me how I’ve been ripped off each month. I know I have to pay for electricity, but I do it begrudgingly because I don’t know where the money is going and what is being used in my house. My bill should go down in the summer, but it doesn’t. WTF?!
What I want is a monthly bill that will show me which appliances are consuming the most electricity. It could be an old TV, PC, or even a swimming pool heater that runs through the winter — maybe even old light bulbs that haven’t been upgraded to LEDs. At the moment, there’s no transparency. This causes me to feel helpless when it comes to managing my bill and ultimately leads me to hate the utility company.
Paying for usage is great, but why not provide me with enough detail to show what key factors are driving my bill. That way I can make an informed decision in regard to my usage if I so wish.
The naysayers to usage-based pricing argue that “It’s not predictable, so I can’t plan for it”, or “I don’t want to worry whether I can afford to troubleshoot the problem I’m seeing.” In practice, that’s not how people operate. People don’t moderate their usage of electrical appliances or make decisions whether they should put gas in their cars — those fortunate enough at least. The cost of performing everyday tasks is so minimal it doesn’t bear thinking about, and tends to normalize over the course of the year.
What’s missing is good data — broken down on a monthly or annual basis — to educate the consumer on where they could save. Suggestions such as, replace those old TVs, turning off the pool pump in the winter, or even charging the Tesla at night when electricity is less expensive. This type of data is much more valuable because it can result in a permanent reduction in usage, in turn costing the customer less money. This leads to happier customers, which is generally a good thing!
A Taste of Things to Come
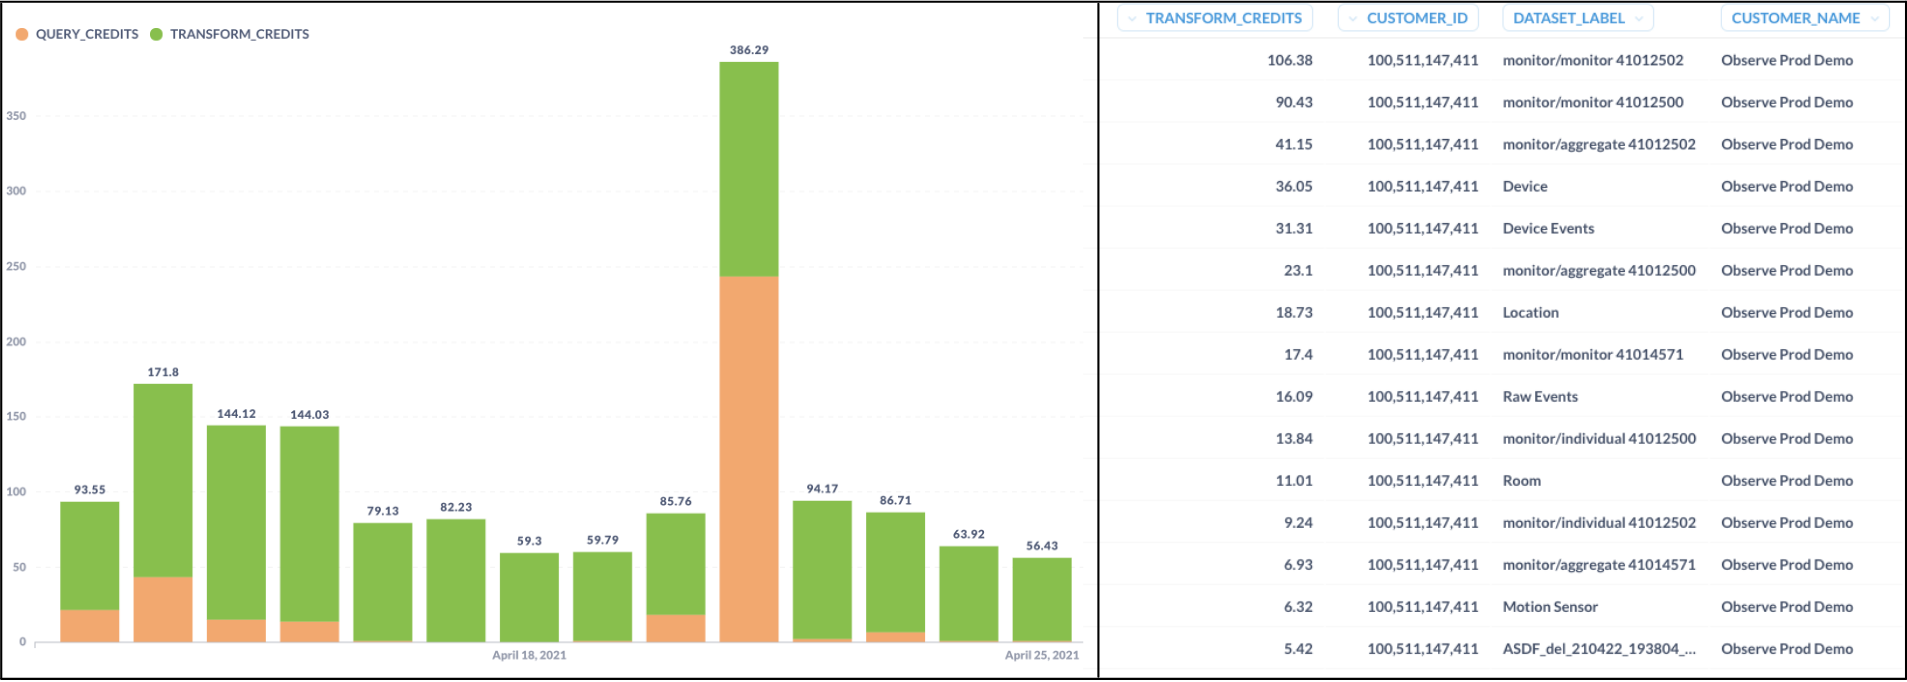
Left: Customer credit usage over time Right: Credit usage by dataset [detailed]
At Observe, we don’t believe in the traditional SaaS subscription model. You shouldn’t pay for something you don’t use or don’t get any value from. We believe that metering usage — and separating usage from ingesting and storing data — is the right approach. We believe in full transparency behind that metered usage. What queries are driving the bill? Which teams, users, and kinds of tasks are consuming the most? This might be legitimate activity — like when investigating a serious customer issue — or it could be something done in error. Within the next couple of months, you can expect to see detailed usage reports by query, transform, and even datasets to help you visualize your costs. We won’t stop there, but it’s a good start to enabling SRE’s and DevOps teams to better manage their expenditures.
The bottom line is, the customer should have all the data they need to manage their usage. An observability tool that didn’t provide this level of observability — in terms of usage — would be very odd in my opinion.