Kubernetes Observability For Humans
 By Knox Lively,September 13, 2021
When it comes to observing distributed and ephemeral systems, it requires a paradigm shift in the way you think about collecting logs, metrics, traces, and even how you alert on important events.
I know what you’re thinking — why does the world need another guide to observability for Kubernetes? In short, there’s a better way now. But first, some history on monitoring Kubernetes and its challenges.
As the flagship project of the Cloud Native Computing Foundation (CNCF) project, Kubernetes has become the world’s most popular container orchestration tool enabling developers to easily build, deploy, and manage containerized applications. However, achieving observability is far from straightforward in a world where container-based workloads are becoming the norm.
Challenges To Kubernetes Observability
At the heart of the challenges to Kubernetes monitoring and observability lies within its architecture. Though it was designed to make building, managing, and deploying container-based microservices easier, Kubernetes is a complex and multi-layered, ever-changing array of services and resources. A single line edit to a configuration file can have you and your team drowning in tsunamis of new data.
To make matters worse, most traditional monitoring solutions have a much simpler architecture in which they assume your infrastructure is more or less permanent. But trying to monitor your Kubernetes infrastructure with traditional monitoring tools is the definition of cat herding as dashboards and pretty visualizations can only tell you so much.
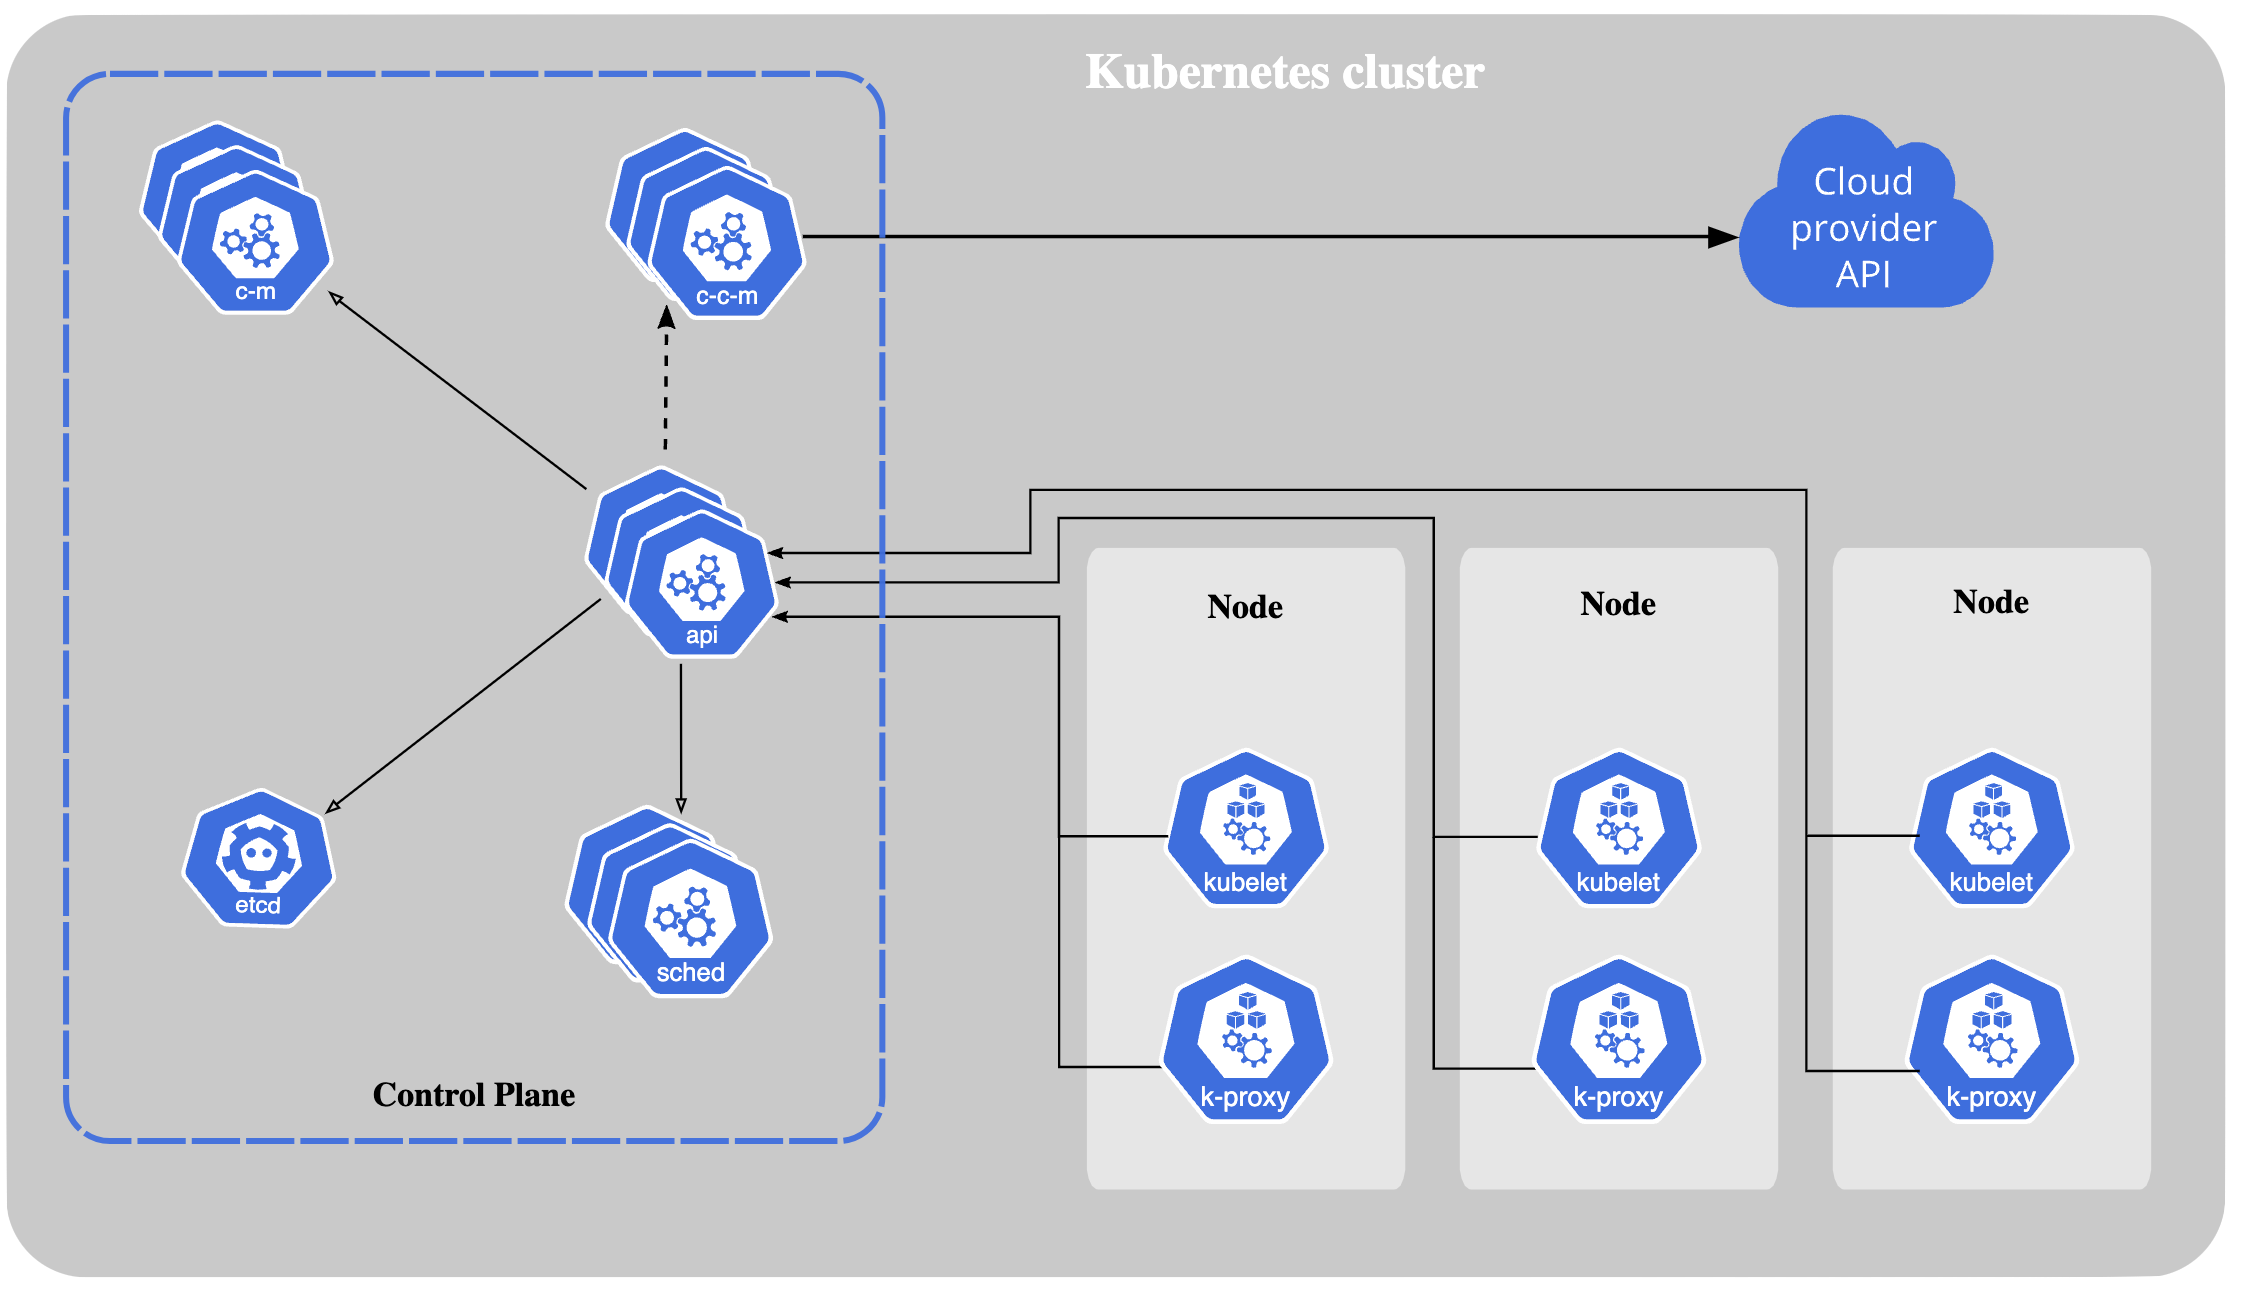
Concerning logging, Kubernetes manages and stores container logs at the Node level, as one would expect. However, they’re quickly rotated as Nodes have finite disk space. A handy feature until you find yourself troubleshooting production issues at 3 AM. In addition, the Kubernetes command-line tool — kubectl — only queries logs on demand for a small subset of targets. Which makes “grepping” through logs an impossible task. This headache alone leads most to invest in third-party tools or solutions, such as an ELK (Elasticsearch, Logstash, and Kibana), to meet their Kubernetes logging needs.
When it comes to metrics, this data is readily available via the Kubernetes API. However, the data model is so rich you’ll spend countless hours devising and implementing a tagging scheme to make sense of the data. On top of this, it’s up to you to design or employ tools like Prometheus to store, correlate, and analyze all of this data!
Logging and metrics aren’t even half of the different types of data your cluster emits. But, let’s say that you slogged the different data sources and tools to collect this data using the more traditional “3 Pillars” approach to observability. You’ve got all your data, but you now work for your data and not the other way around — because it’s still siloed!
Now the burden is upon you to find context, or rather show how your data sources are related, which will result in increased costs and a higher MTTR.
What Should You Monitor In Kubernetes?
Now that we understand some of the many challenges of observing a Kubernetes cluster, where do we start on our journey to observing Kubernetes? Let’s begin by identifying the types of data you should consider collecting, and later we’ll cover how to correlate, analyze, and optimize all of this data.
Logs
Arguably, the first and most important place to start is with logs. Logs are the bread and butter of observability for any environment. Kubernetes has a wide variety and sources of logs, making log management and log aggregation more of a headache than when it comes to more traditional infrastructure — especially when you rely solely on a hard-to-learn query language.
Types of Logs in Kubernetes:
- Container Logs
- Node Logs
- Audit Logs
- Event Logs
- Ingress Logs
- API Server Logs
A crucial part of your observability playbook for Kubernetes should begin with capturing as many — if not all — of these types of logs available to you.
Metrics
Metrics monitoring is a bit more straightforward, as many of the same metrics found in more traditional infrastructure can be found in Kubernetes. However, there are quite a few Kubernetes-specific metrics you should be aware of. Furthermore, collecting metrics in Kubernetes is a bit more difficult as at the moment there is no native solution for metrics.
There are management platforms for Kubernetes such as Amazon Elastic Kubernetes Service that can provide you with rich and integrated metrics, but they will leave you short on all other observability telemetry.
Your other option is to directly query the Kubernetes API — which will require yet another 3rd party tool, or a significant in-house development effort to create tooling.
However you chose to collect metrics, you should be aware of the various types of metrics.
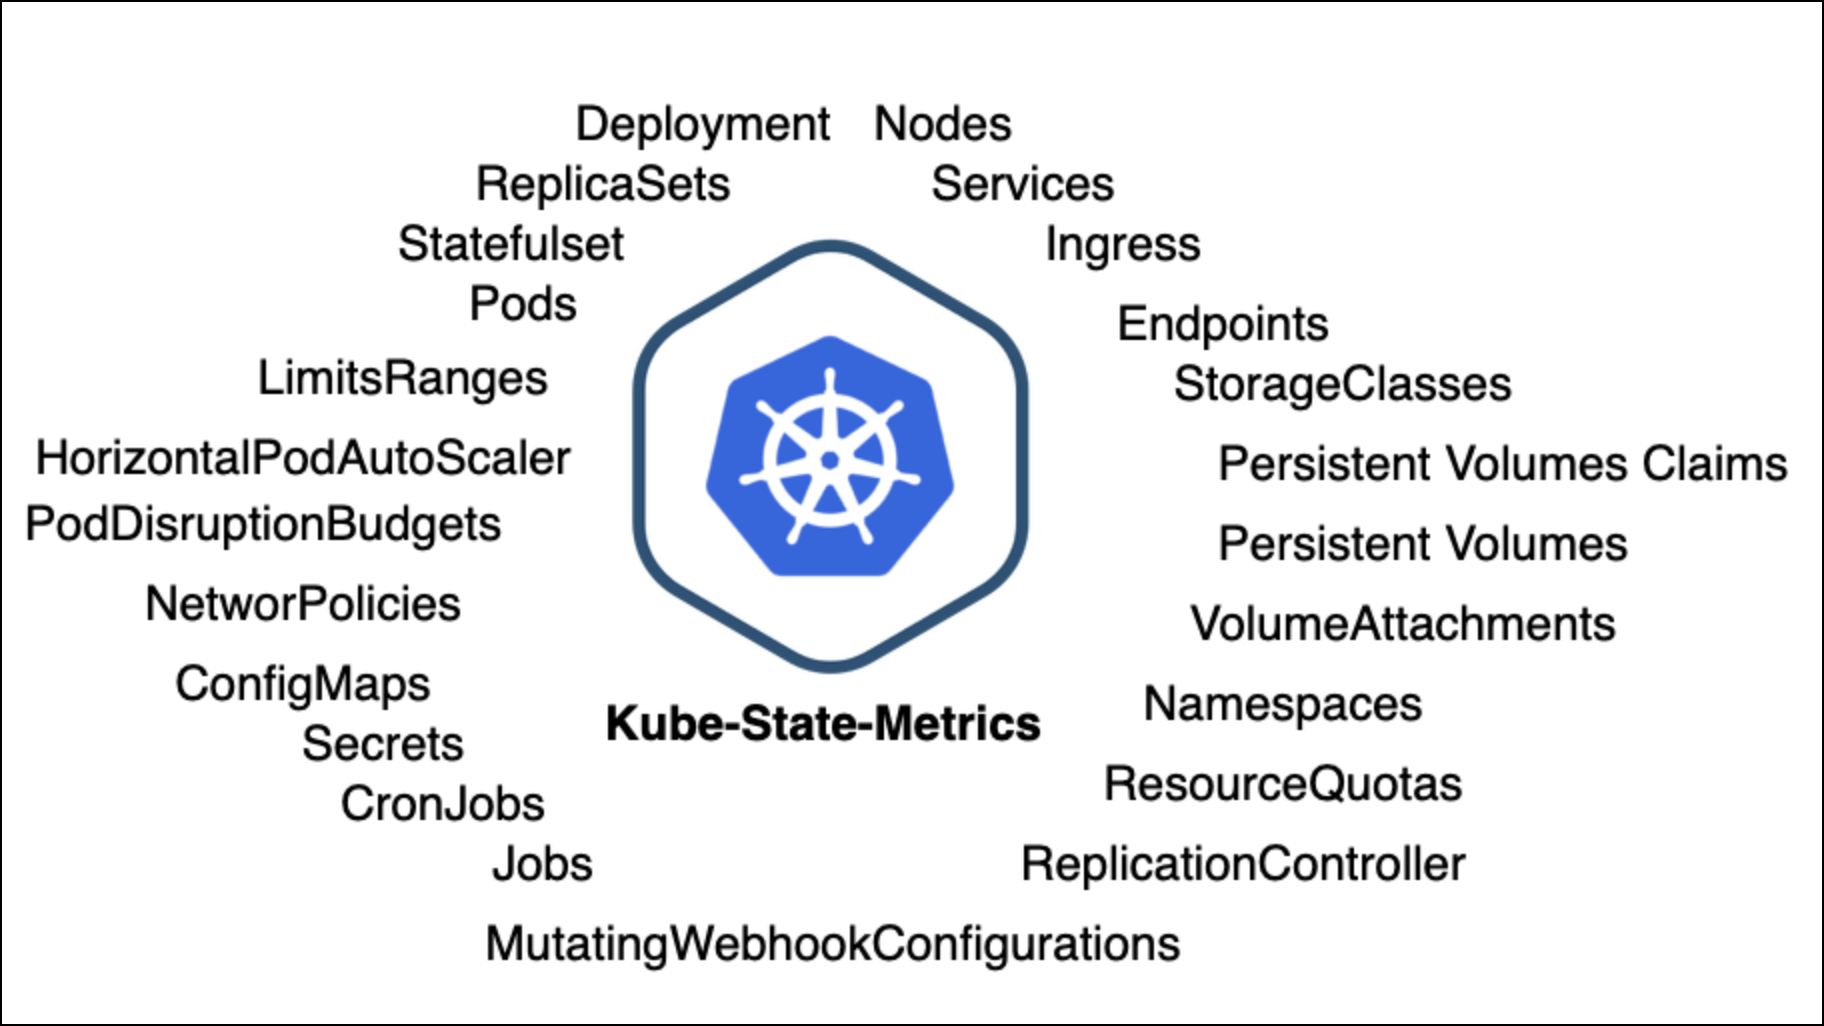
Cluster & Node Metrics
The first metrics you should concern yourself with are resource-usage metrics, as they’re vital to understanding the overall health of the cluster. This will help ensure you have enough physical resources to handle your containerized workloads, see which applications run on which Nodes, and ensure the Nodes are working properly.
- Memory, CPU, and Network Usage
- Number of Nodes Available
- Number of Running Pods (per Node)
Kubernetes Metrics
Moving on from the cluster level to the individual Pod level, Kubernetes metrics allow you to gauge Pod health at a glance.
- Current Deployment (and Daemonset)
- Missing and Failed Pods
- Running vs Desired Pods
- Pod Restarts
- Available and Unavailable Pods
- Pods in the CrashLoopBackOff state
Container Metrics
These metrics are what users are most familiar with, as they provide detailed information about resource utilization and are similar to metrics you’d find in a more traditional environment.
- Container CPU
- Container memory utilization
- Network usage
Application Metrics:
Finally, any fully observable environment must include application metrics. Each organization has to decide which of these helps them best gauge performance and reliability relative to the business scope and objectives of each of their products and services.
Here are a few of the most important performance-related metrics that organizations should track.
- Availability
- Error Rates
- Application Performance Index (Apdex Score)
- Average Response Time
- Request Rate
- Latency
Traces
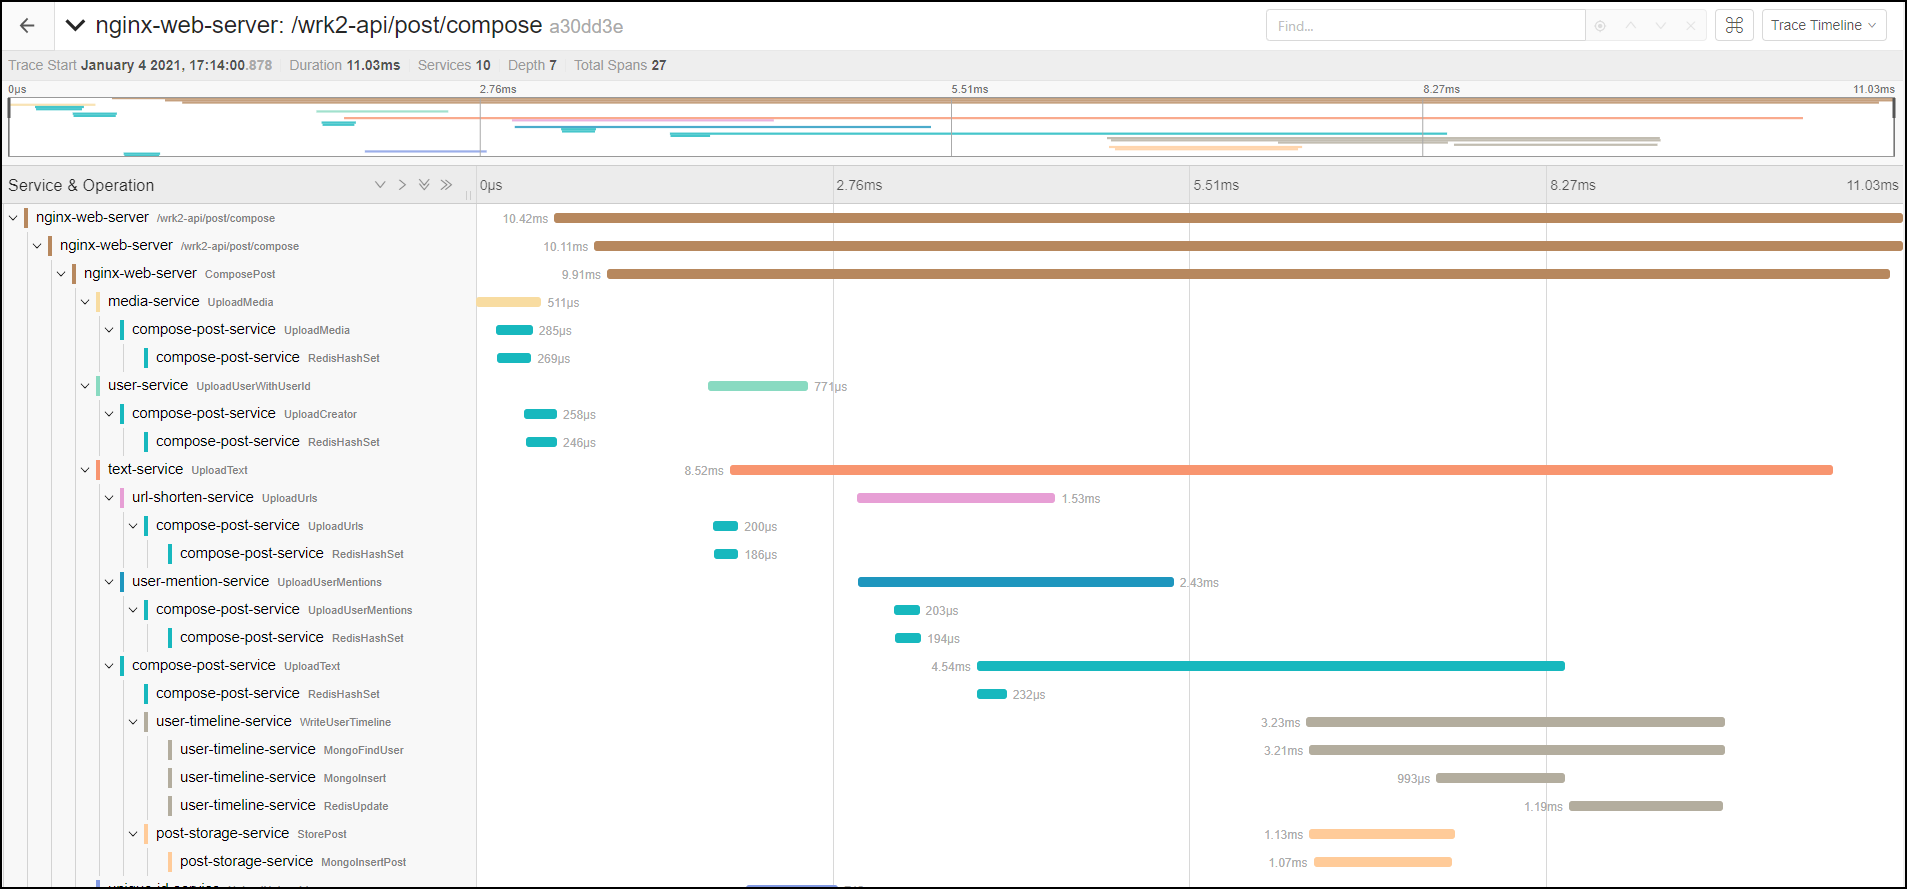
After you’ve identified which various logs and metrics you’d like to collect, you may also consider collecting traces. Traces allow you to map interactions between different services and resources to identify the root cause of a failure or event.
Traces are relatively easy to collect for Kubernetes system components, though it does require some configuration and a 3rd party tool or two. Collection can be done with a tool like the OpenTelemetry Collector, or Jaeger, to route them to an appropriate tracing backend for storage, processing, and analysis.
In terms of getting traces from applications, that will require some instrumentation on your part. You can achieve application-level tracing by implementing a distributed tracing library — such as OpenTracing — directly into your application’s code, or by using a service mesh. Both require significant development and implementation time, and their value may not prove worth the effort.
State
As mentioned earlier, Kubernetes provides information about its state — essentially any change to any resource type — via the API logs. Though, without special tooling, reconstructing your cluster’s state from these logs may prove very difficult. The value of knowing your cluster’s state is greatly magnified when used in conjunction with logs, metrics, and other observability data. Together, they can give you a complete picture of the present and past, as well as insights into the future state of your cluster.
Events
Kubernetes’ components continually emit Events, which are essentially small messages that let you know what happens inside each moving part. Most people’s experience with Kubernetes events is from issuing the kubectl describe <pod> command, which outputs recent event details related to a specific pod including its name, namespace, node, and other pod-specific information.
It must be noted that events in Kubernetes are just that, they do not trigger any behavior or condition. They are simply the output from components “talking” and are intended to be used solely for diagnostic purposes.
Events coupled with logs, metrics, traces, and other sources of data can be invaluable. They allow you to link events to resources and establish a detailed timeline of exactly when changes occurred in your cluster, and the effects they may have had. You should strongly consider adding them to your observability solution.
Other Data
In addition to logs, metrics, traces, events, and so on Kubernetes is rich with other types of data — metadata for one — that should be evaluated when it comes to Kubernetes observability because the more data you have, the more opportunity there is to create context.
Lastly, teams should think beyond the data sources mentioned earlier. Data generated by CI/CD pipelines, customer service software, and other applications outside your environment(s) can greatly enhance your ability to see trends, troubleshoot, and more.
What Tooling Do You Need For Kubernetes Observability?
Build Your Own
Traditionally, observability for Kubernetes has been achieved in one of two ways. The first way involves employing and managing a magnitude of 3rd-party and open-source tools to build your own Kubernetes Solution. To illustrate you would need a way to collect logs, metrics, traces, and any other Kubernetes-related data you find valuable, as well as a tool to store, visualize, and ultimately query that data. Here is a list of commonly used tools for each piece of a typical Kubernetes observability pipeline.
Data Collection:
- OpenTelemetry (metrics, traces, and logs)
- FluentD (logs)
- Prometheus (metrics)
- Hipster (metrics)
- Jaeger (traces)
Storage (time-series databases):
- Prometheus
- InfluxDB
- Cassandra
Visualization:
- Kubernetes Dashboard
- Grafana
Query/Analysis:
- PromQL (included in Prometheus)
- Elasticsearch
As you can see, if you were to build your own solution you would need to implement at least four separate tools to collect, store, and analyze all the various types of observability data a Kubernetes cluster can generate. Needless to say, this effort is mired with costs, both in time and money. Once completed, your observability data is still siloed and very difficult to correlate, leaving your DevOps Engineers and SREs to the arduous task of tasking, indexing, or creating labels before analysis can even occur.
Note: So far we’ve only focused on monitoring the infrastructure on which Kubernetes runs, you’ll also likely want an APM — or similar tooling — to help you learn about the overall health of your app in addition.
Using a Managed Service
The other solution requires running Kubernetes on a managed platform, such as Amazon Elastic Kubernetes Service (EKS). While this may seem like a complete observability strategy since you get monitoring out of the box, it still leaves out a ton of functionality — like alerting — and loads of important observability data. Moreover, their native Kubernetes monitoring tools won’t give you insight into your applications’ performance, application performance over time, or even the overall environment state. Though convenient, these platforms are hardly a solution for full observability.
Now there’s a third, and better, way.
Kubernetes Observability, Meet Observe
Observe is a SaaS-based platform designed to thrive with cloud-native technologies like Kubernetes. Rather than assuming that Kubernetes environments can be observed in the same way as other, more traditional environments, Observe takes a dynamic and holistic approach to Kubernetes observability.
Click, Click, Observe
With Observe’s Kubernetes App users get unparalleled insights into their Kubernetes clusters, Docker containers, and underlying infrastructure metrics — and installation is as simple as a couple of clicks. From there, Observe does the dirty work. It automatically collects logs, metrics, events, and state changes from all layers and components of your cluster using open-source collectors. It then uses that data to track the overall state of your environment continuously.
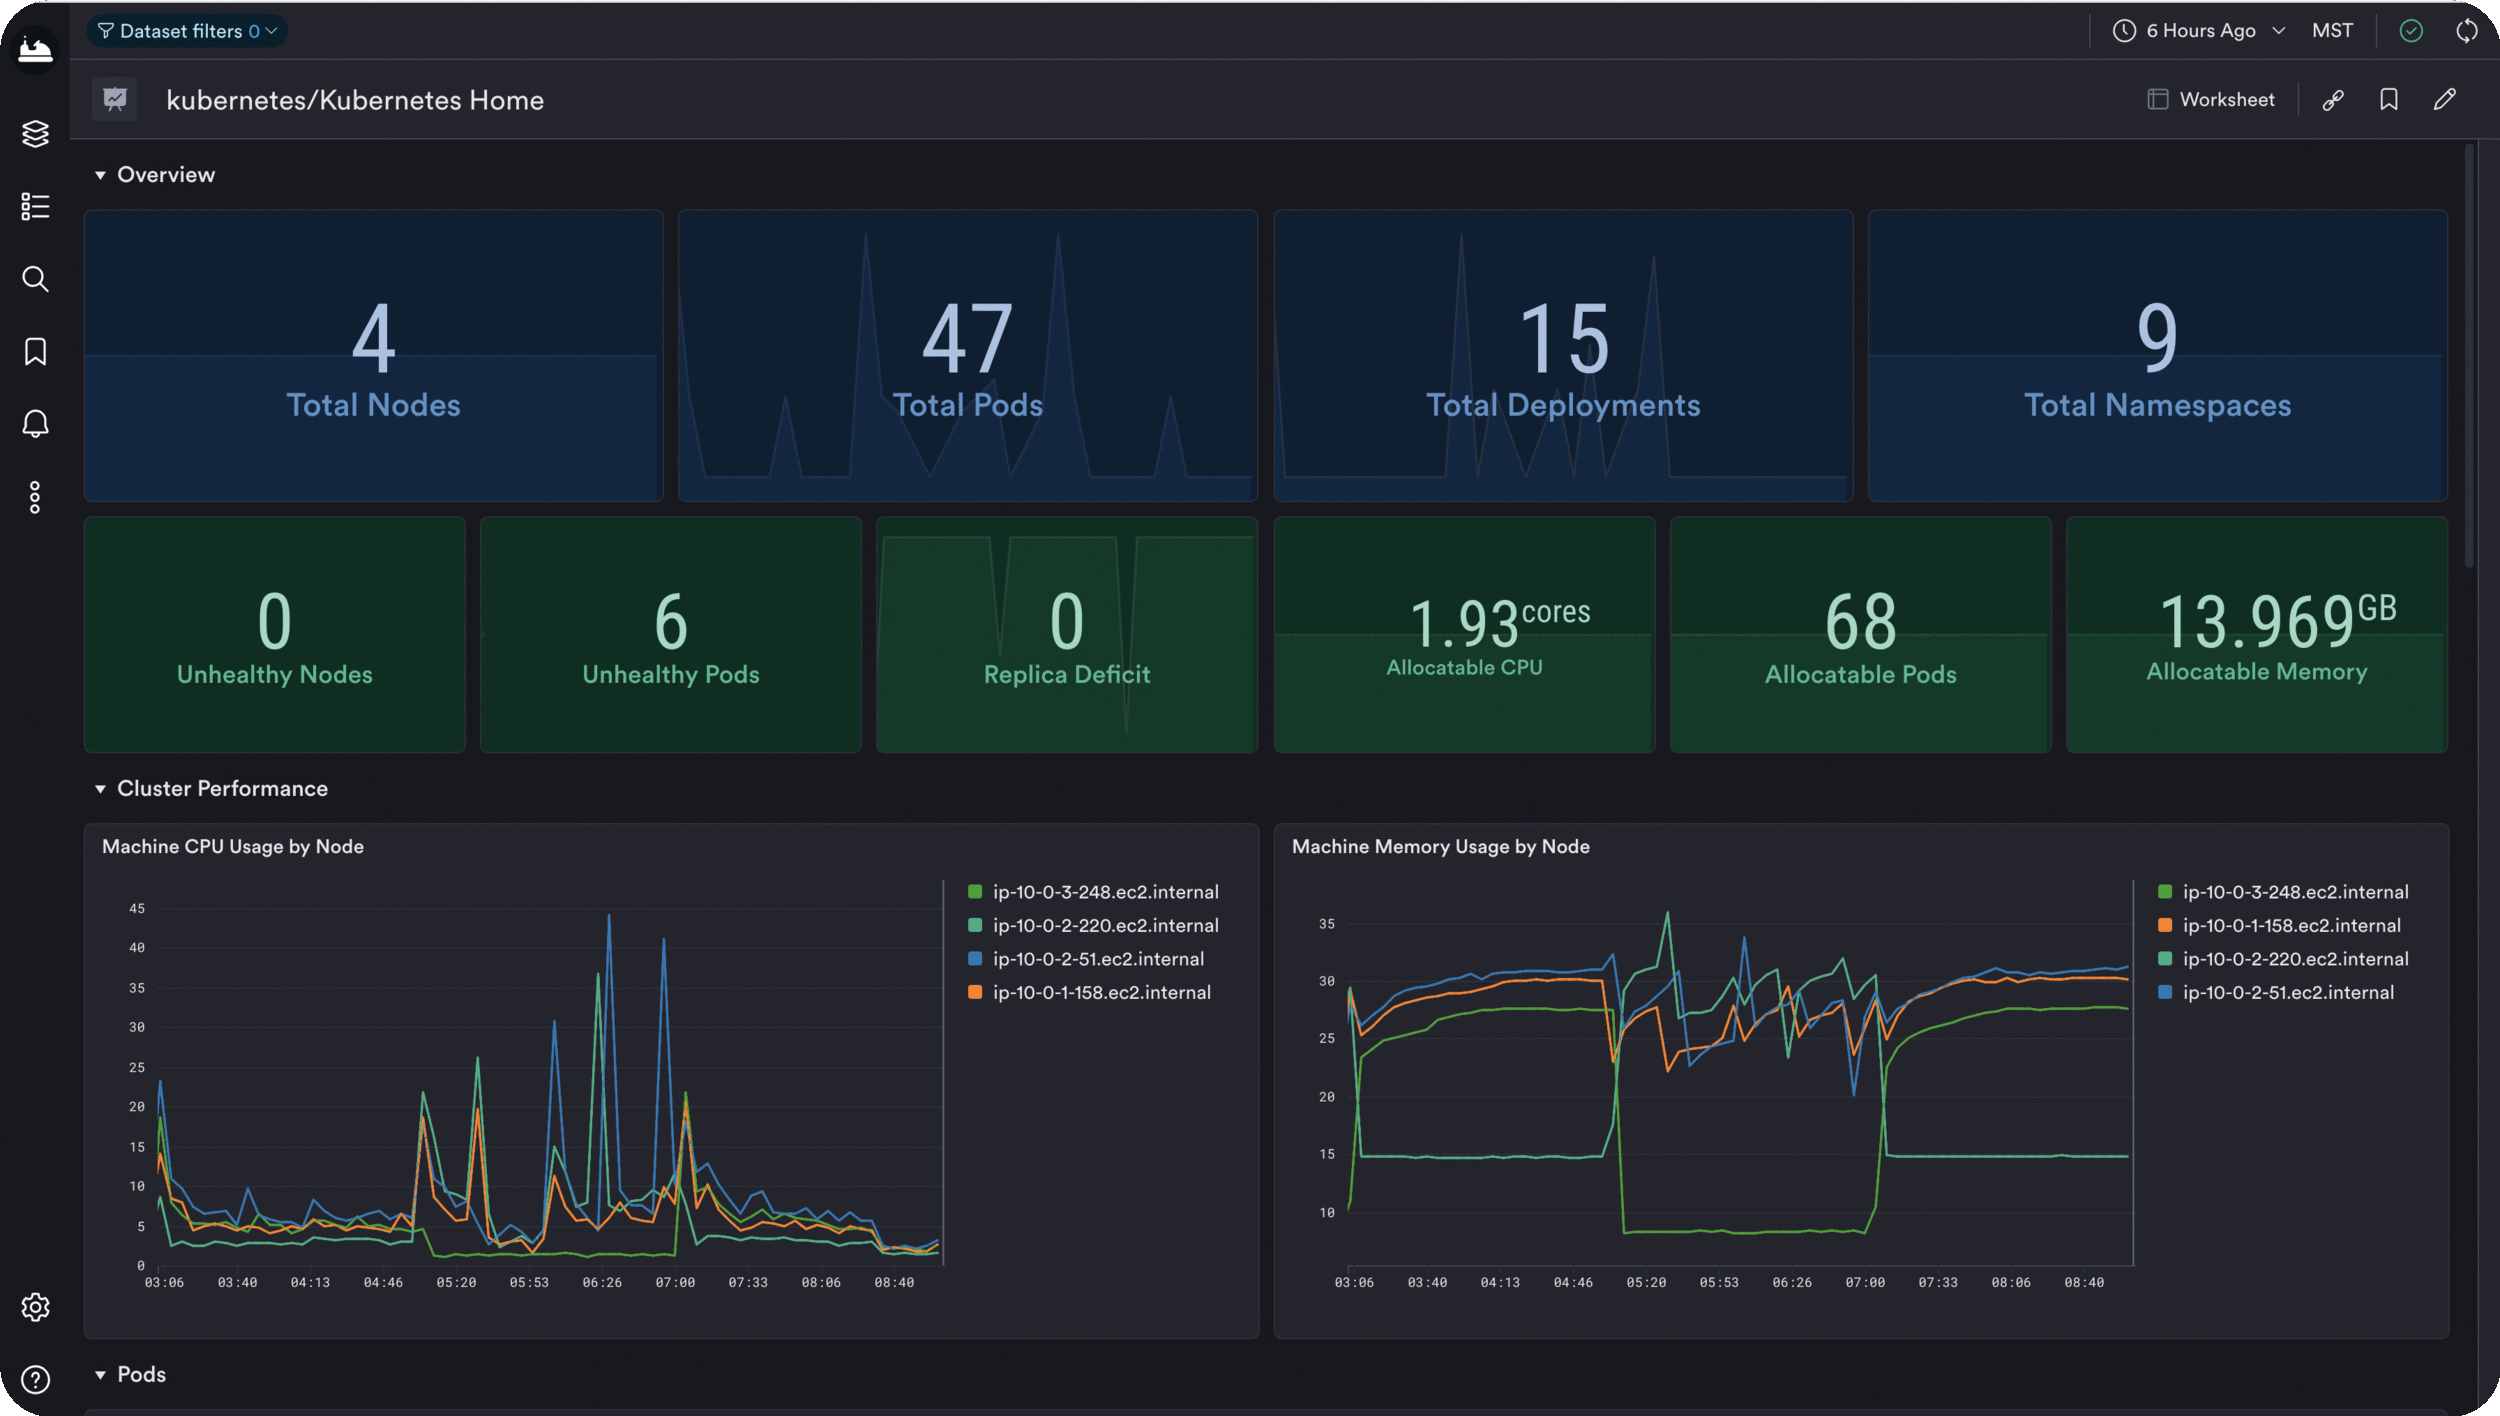
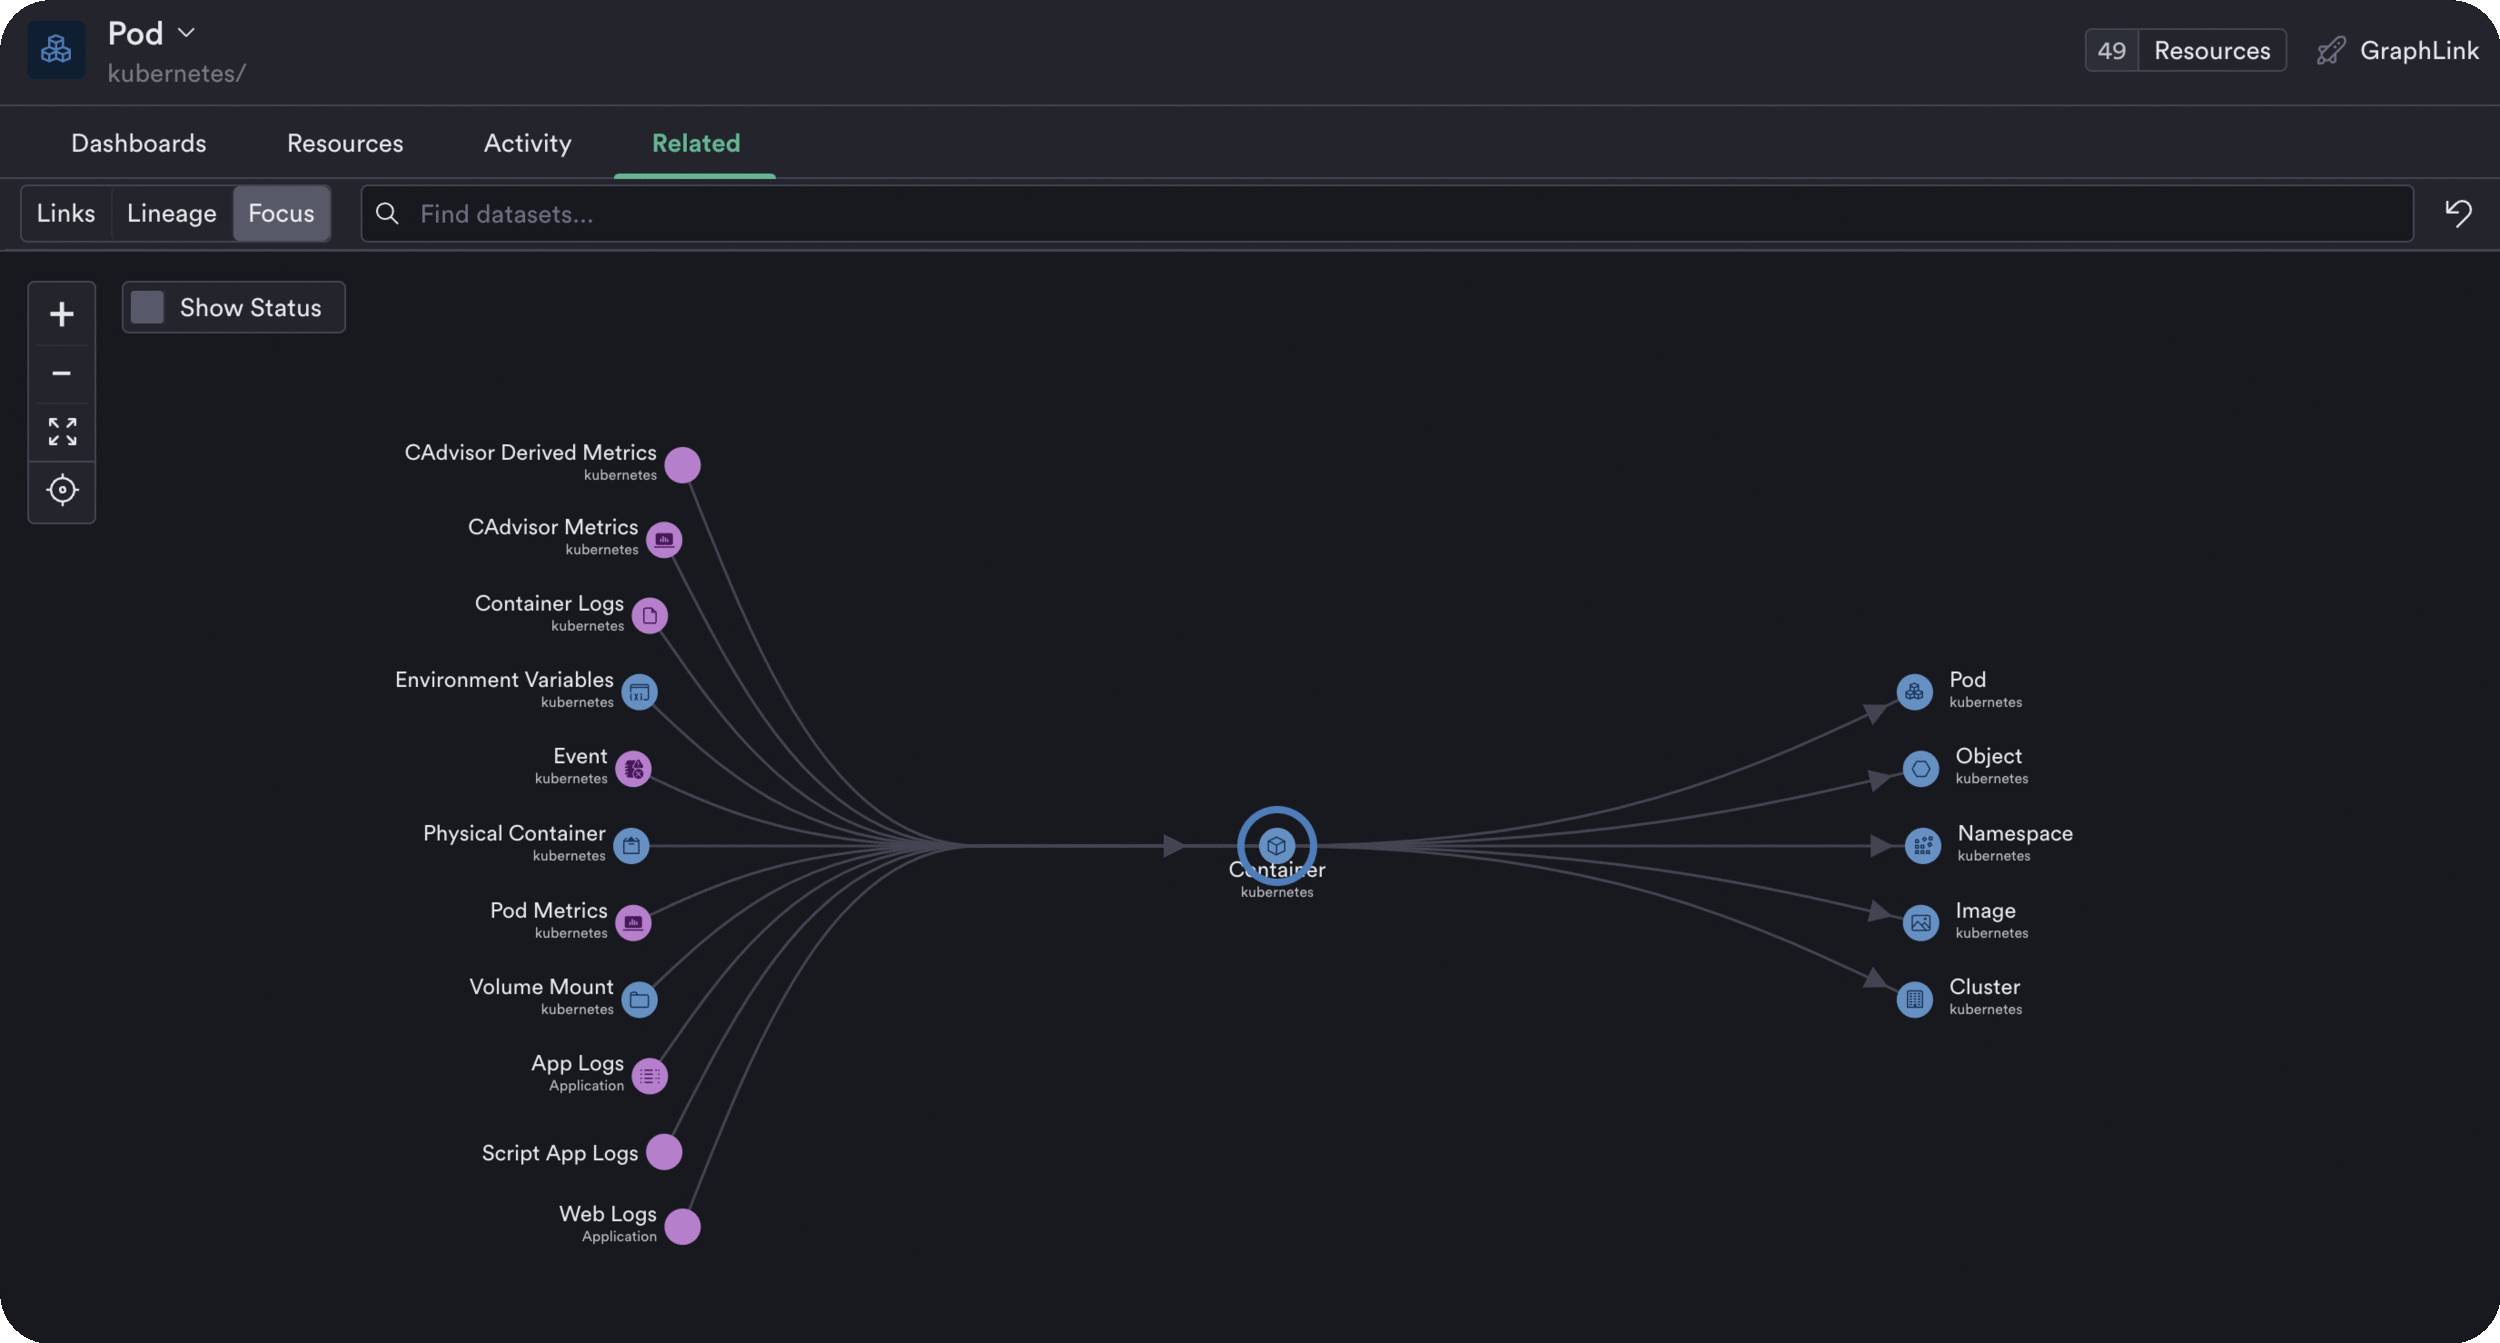
Finally, put to rest the question, “Is my cluster healthy?” Kubernetes doesn’t make it easy to know when things go wrong. But with Observe, you can easily visualize all things Kubernetes from its availability, performance, and dependencies (via Dataset Graph) all the way to the health of the infrastructure it runs on — whether that’s AWS, GCP, or even Azure. You can also easily create alerts on metrics or for virtually any condition related to your Kubernetes cluster. Get notifications on failed deployments, Pods stuck in a restart loop, or even alert on the status of the Kubernetes API Server.
Context That Matters
Observe naturally understands how to provide context by using foreign key relationships found in your data to give you the crucial information where, and when you need it. Pod crashed at 2 am? Observe can show you what caused it — even if it was related to a service outside your Kubernetes cluster.
And thanks to Observe’s innate ability to correlate data from any source, in any format, you can send data from applications and services that you might not normally consider. Data from GitHub, Customer Support Tickets, and Build logs — you name it — can be sent to Observe to bring even more context to your environment and get a complete picture of its health.
Time Travel
Observe maintains a complete changelog of all events in your cluster, you can easily reconstruct the state of your environment from any point in time. There’s no need to wade through historical log data manually to understand the past. Observe keeps track of the past for you, while at the same time providing real-time visibility into the present.
Usage-Based Pricing
Because Observe’s architecture separates storage and compute, this means that all your K8s telemetry can be ingested and stored for around the same cost as Amazon S3. No need to make hard decisions when it comes to which data to keep, simply collect everything for as long as you want and analyze it when you’re ready.
A Fresh Perspective
Distributed systems and software like Kubernetes are here to stay. You can expect them to only grow in complexity and become even more abstracted from traditional on-premise, or cloud-based computing environments.
When it comes to observing distributed and ephemeral systems like Kubertnes, it requires a paradigm shift in the way you think about collecting logs, metrics, traces, and even how you alert on important events. Otherwise, you’ll end up chasing your tail and creating unnecessary work for you and your team. Rather than spending countless hours trying to automate your current monitoring tools, and creating tags to organize your — siloed — data, you need a tool that can automatically gather the data you have today, in any format, and begin to make sense of it now.
If you and your team want to make Kubernetes observability as simple as a few clicks, want to drastically reduce your MTTR, and stop making hard decisions when it comes to which data to keep then click here to see how Observe can help today!