

What's New: GCP App!

Besides observing individual GCP services, the real power of the Observe GCP App is that it allows users to combine their GCP data with other data in Observe to provide new and exciting insights from their existing observability data.
Introducing the Google Cloud Platform (GCP) App
Earlier this summer we introduced Observe Apps to provide users with an easier and more intuitive way to import, manage, and explore their observability data from popular third-party services like AWS, Kubernetes, Jenkins, and more. This week we’re excited to announce our latest app, GCP!
Like our other Apps, the Observe GCP App comes loaded with various Datasets, Dashboards, and Monitors out-of-the-box to make observing GCP environments painless. This means that users don’t need to spend valuable time curating, indexing, or parsing data before they ever get any value from it.
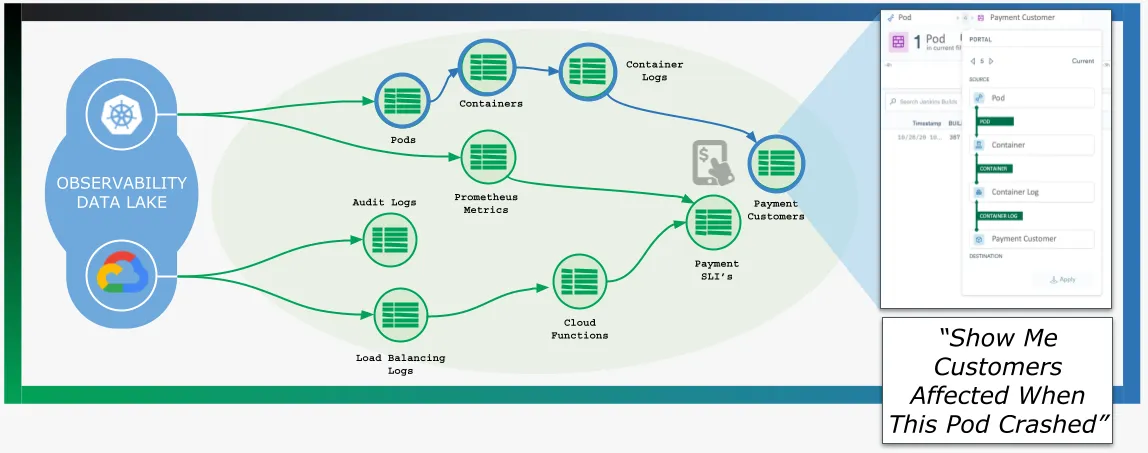
Besides observing individual GCP services, the real power of this App is that it allows users to combine their GCP data with other data in Observe to provide new and exciting insights from their existing observability data. This means less time troubleshooting and more time building applications and services for your customers.
Let’s take a closer look at what’s included in the Observe GCP App, what you can do with it, and how to get it!
Datasets
To the uninitiated, Datasets are essentially an Observe curated “schema” of related data, that we often refer to as the “things” users want to ask questions about. Things like Pods, Servers, or Customers are easier to investigate than digging through rows of machine data. Let’s see what kinds of “things” the Observe GCP App comes with.
Once your GCP project has been configured to send data to Observe, the following GCP-related Datasets automatically appear in Observe without further configuration:
- Asset Inventory – Metadata of all GCP resources found within the configured project.
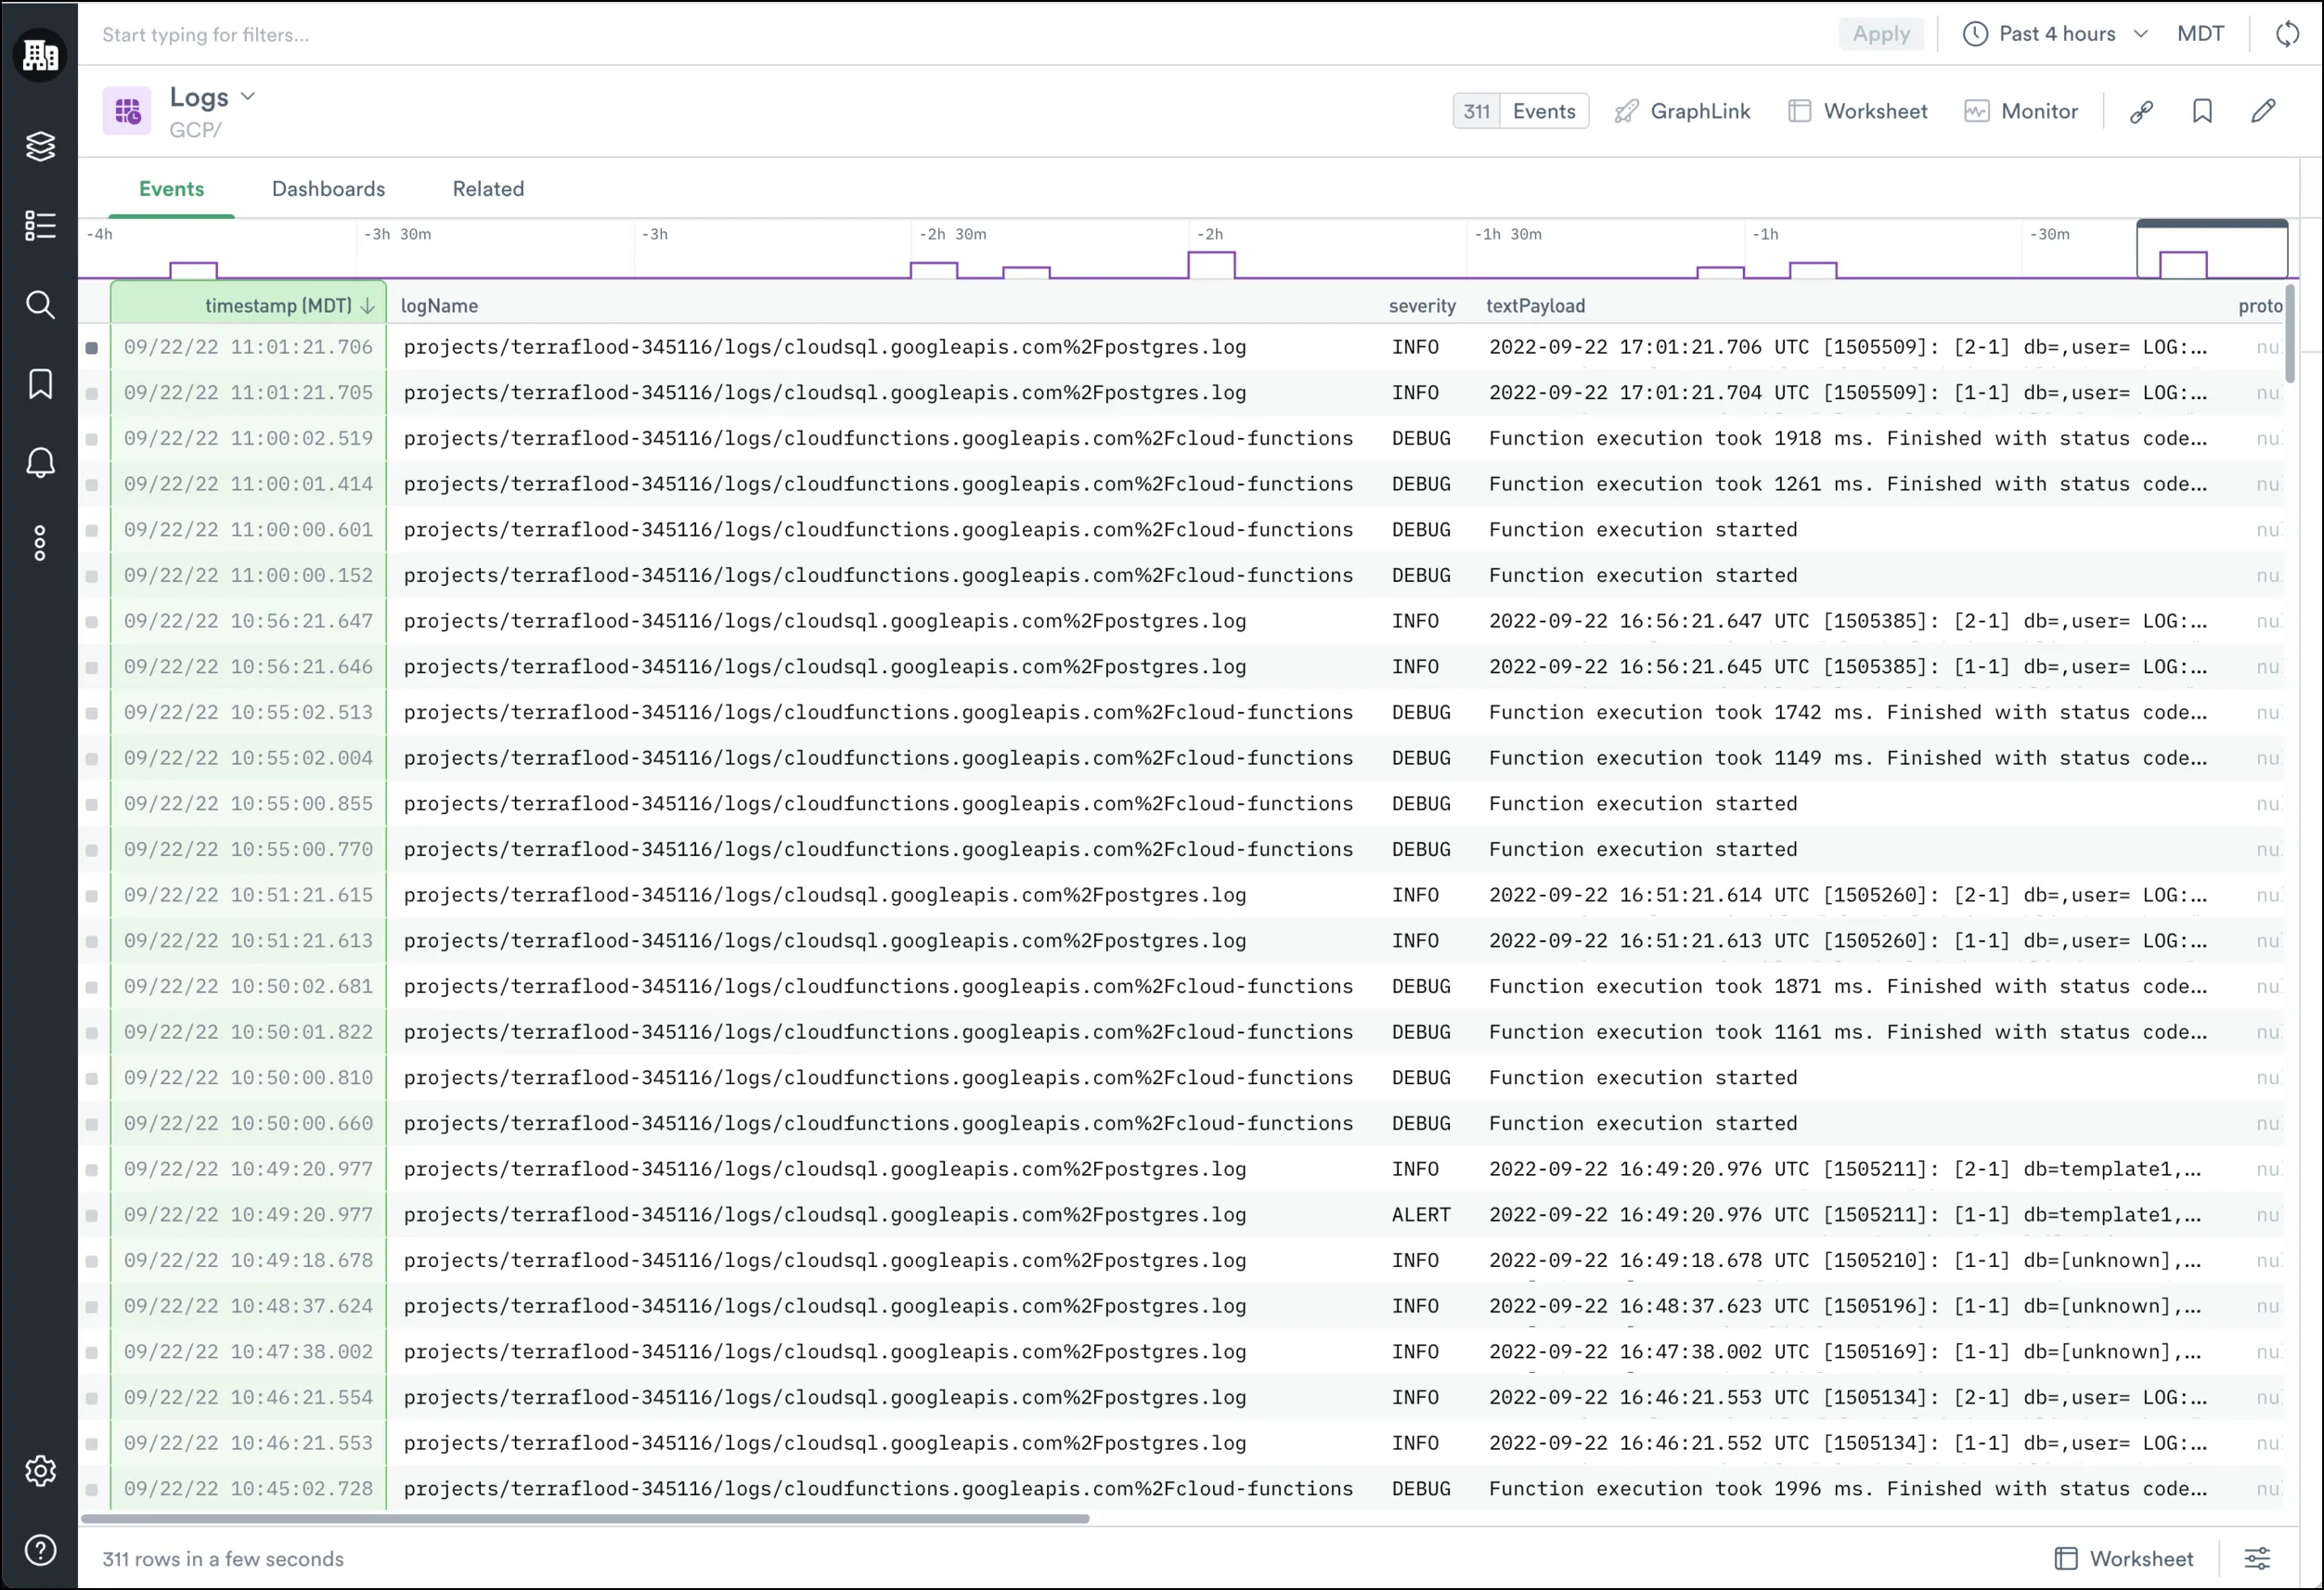
- Logs – This dataset contains all logging data collected from GCP and is used as input to many other datasets.
- Metrics – Raw metrics for all services enabled in GCP (if enabled in Observe)
These Datasets form the backbone of all observability data discovered by the Observe GCP App and can be used to derive your own custom Datasets in addition to the ones provided by Observe. Once you configure these Datasets, you can add the following additional GCP-specific services to Observe by enabling them in the Observe GCP App interface:
- Cloud Storage – Logs, Metrics, and a “Buckets” Resources Dataset that contains all Buckets found in an environment.
- Cloud SQL – Logs, Metrics, Command History, and a “CloudSQL” Resources Dataset that contains all CloudSQL instances found in an environment.
- Cloud Functions – Logs, Metrics, and a “Functions” Resources Dataset that contains all Compute instances found in an environment.
- Compute – Logs, Metrics, and a “Compute” Resources Dataset that contains all Compute instances found in an environment.
Additionally, configure your GCP services to send the Audit Logs to provide richer context and support for troubleshooting services in GCP.
Note: More services like Big Query, GKE, Pub/Sub, and much more, are on the way. Please check out the Observe integrations page in our docs for the latest Apps and Integrations.
Dashboards
At the moment, the Observe GCP App comes with six Dashboards that function as a starting point for you to quickly see trends, start investigations, or simply monitor your services in GCP.
Unlike other dashboards, these go beyond the typical high-level and isolated summaries your C-Suite likes to see. Our Dashboards give you direct links to the displayed data, and with tools like GraphLink and Dataset Graph you can explore how that data is related to other – seemingly disparate – data sources in your environment.
Here are the Dashboards currently provided by the Observe GCP App:
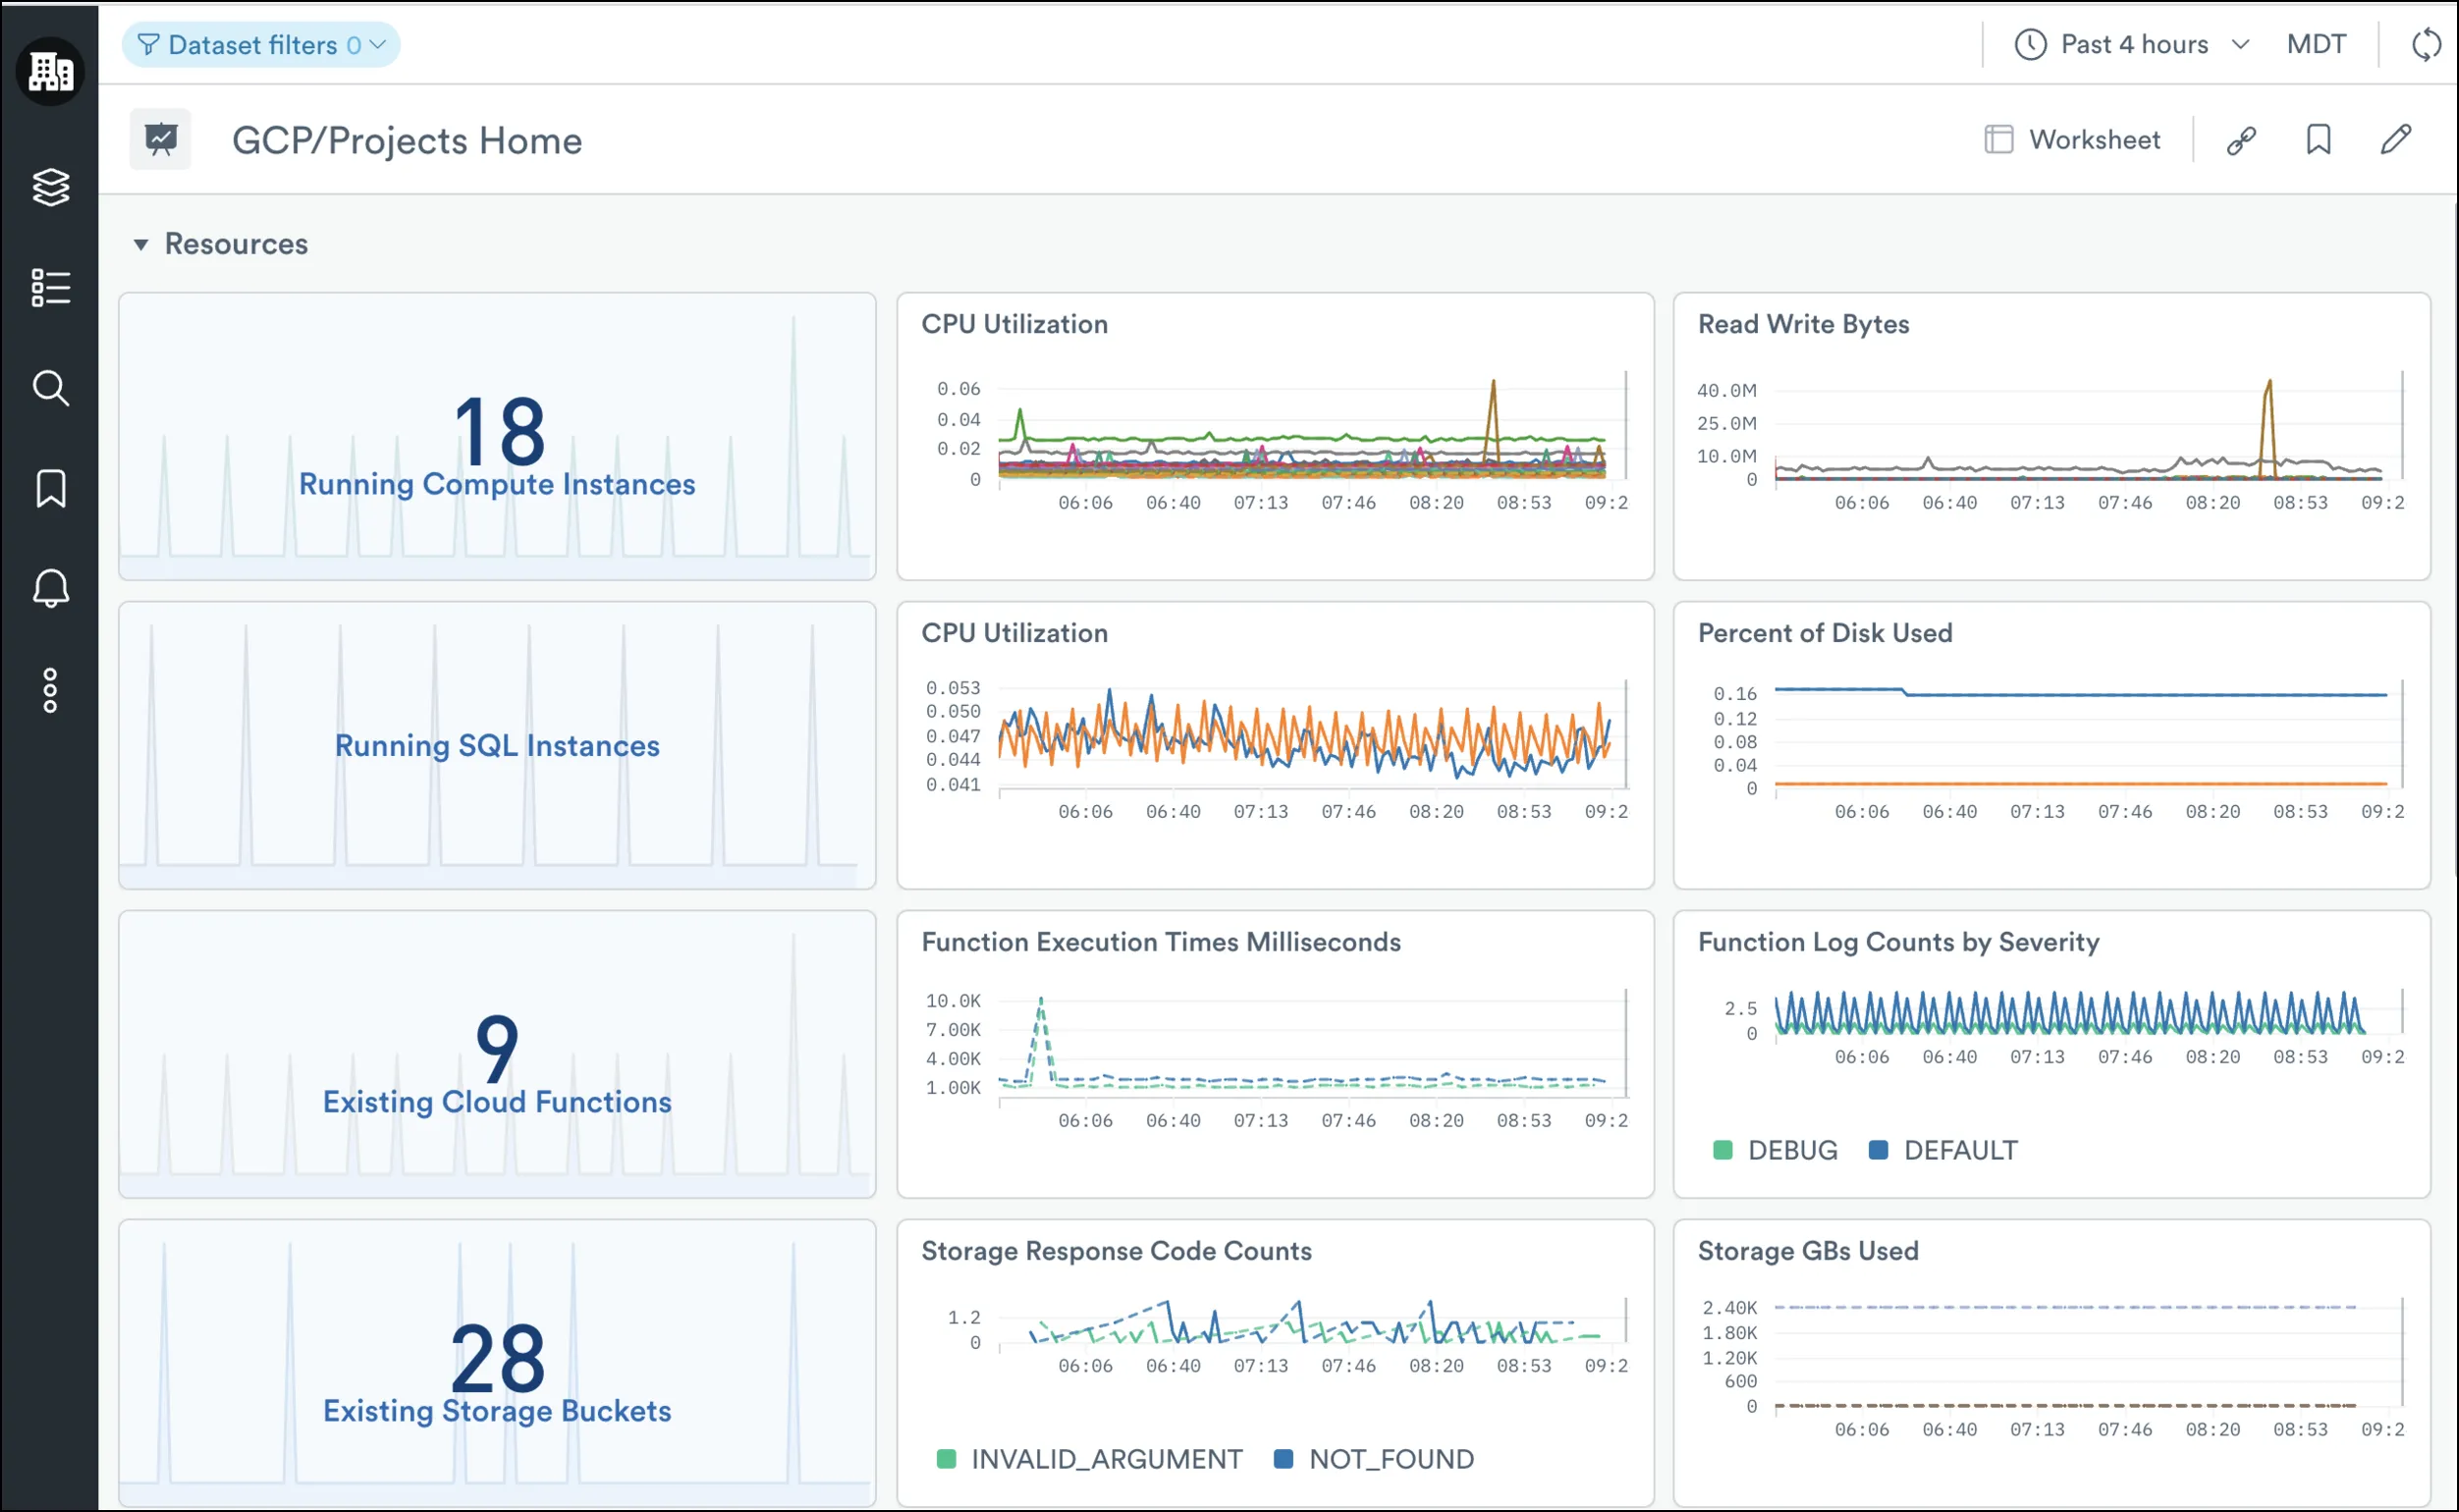
- Projects Home – An overview of all assets, services, and metrics from a given project.
- Cloud Functions – An overview of the health and activity of your Cloud Functions.
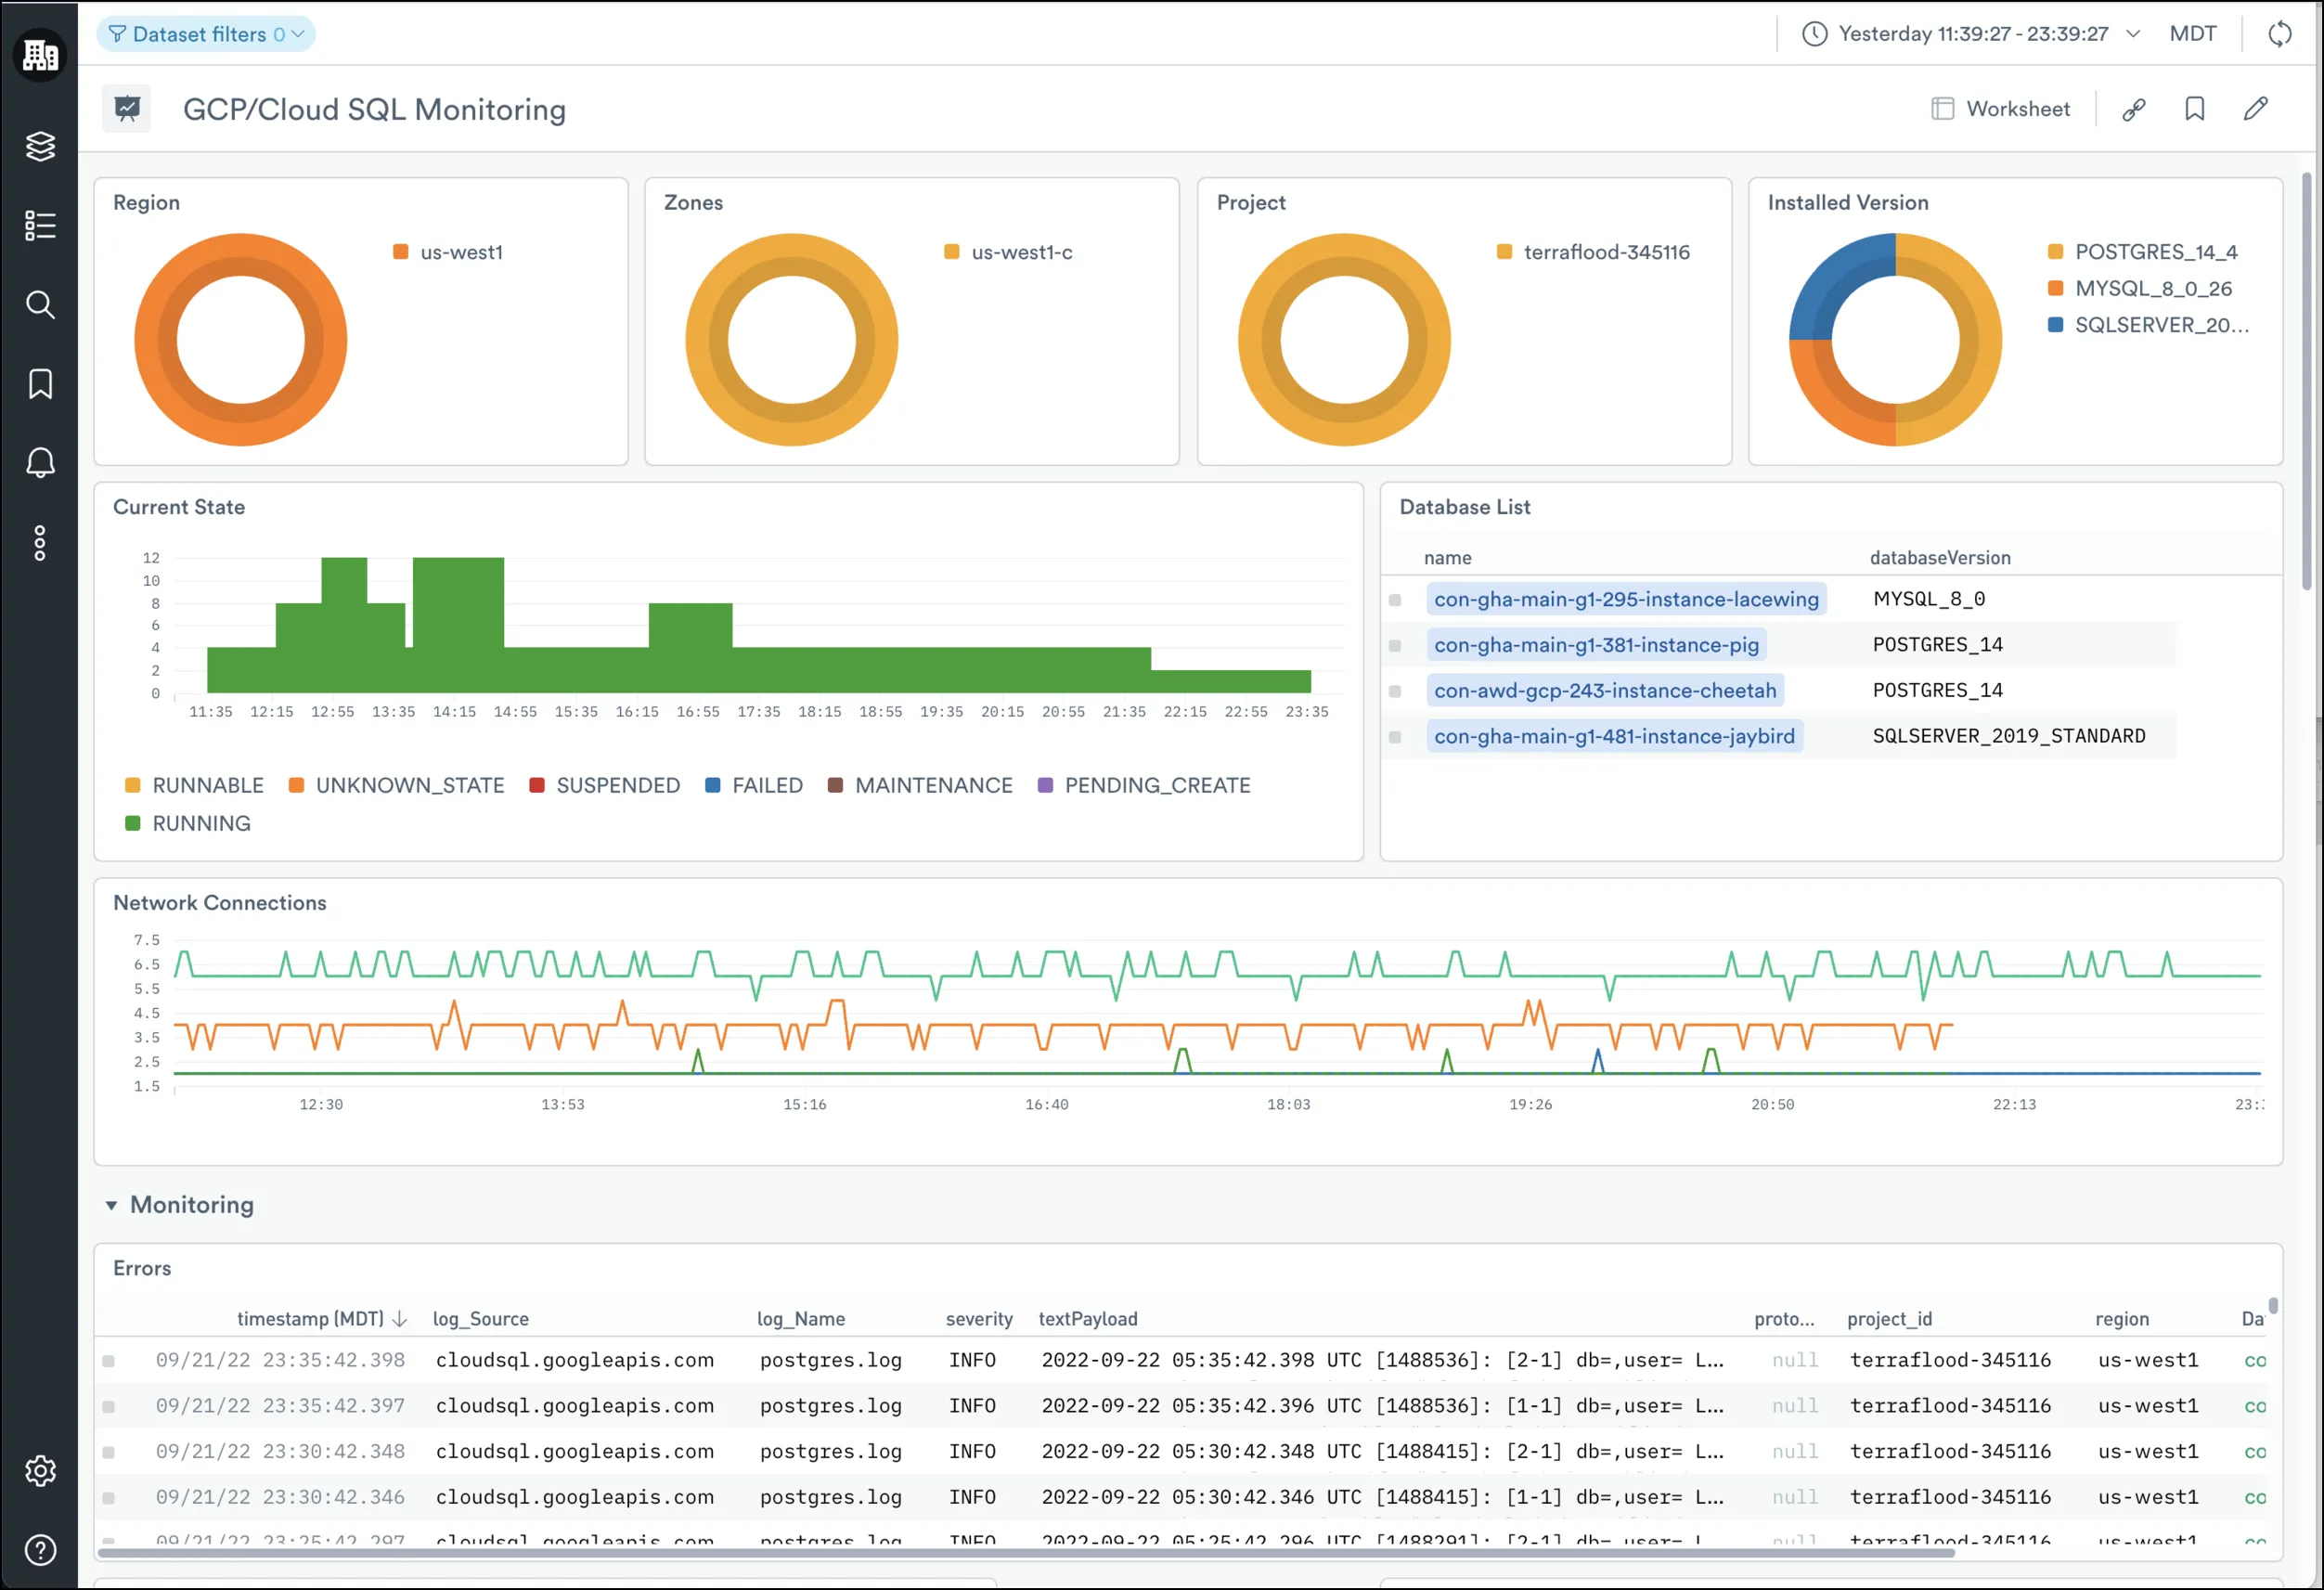
- Cloud SQL Monitoring – An overview of the health and activity of your Cloud SQL instances.
- Compute Monitoring – An overview of the health and activity of your Compute Instances.
- Load Balancing Monitoring – An overview of the health and activity of your Cloud Load Balancers.
- Storage Monitoring – An overview of the health and activity of your Cloud Storage Buckets.
Monitors
Monitors in Observe function as you expect, they enable you to receive alerts on critical events in your environment. However, our Monitors don’t need metrics to alert from, they can also alert directly from a Dataset which allows for much more flexibility as users may want to generate alerts from things other than metrics.
The Observe GCP App provides you with a host of Monitors to get you up and running with useful alerts from the critical GCP infrastructure. These Monitors can also be used as templates to help users quickly design and customize their own custom Monitors as we know each environment is different.
Here are a few of the Monitors provided by the Observe GCP App:
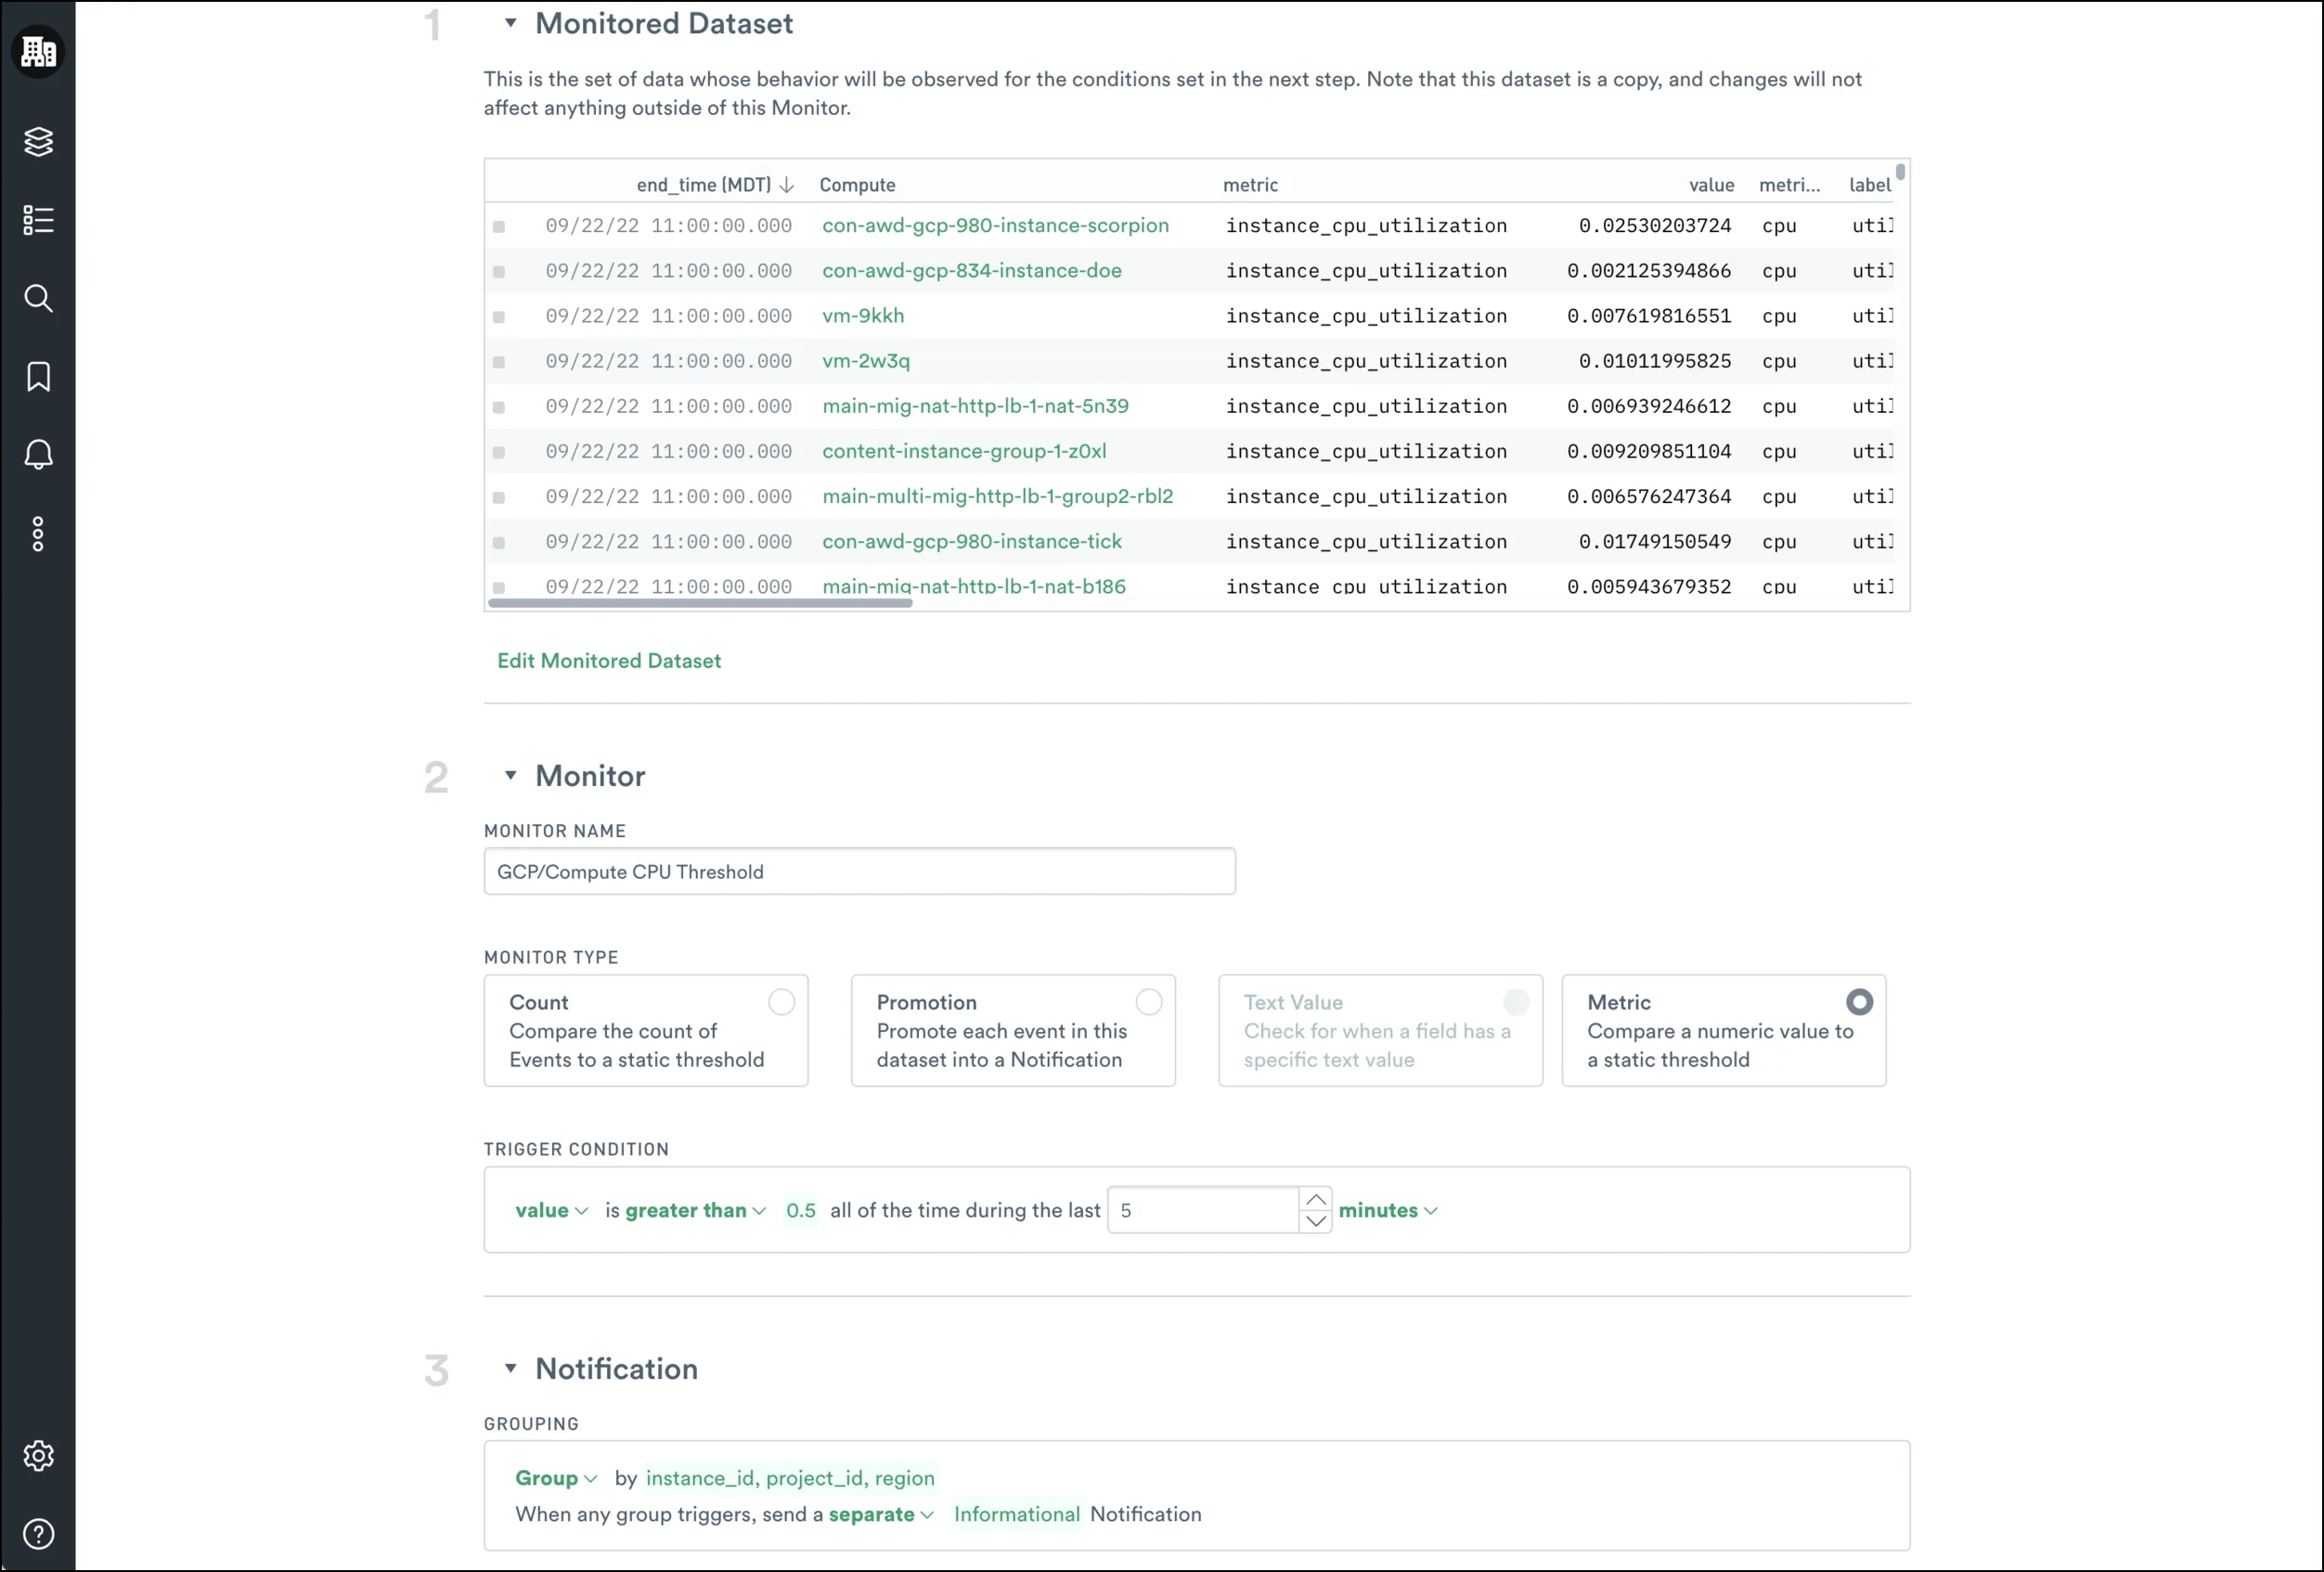
- Compute CPU Threshold – Alert on CPU usage above a certain threshold.
- Cloud SQL Disk Quota Used – Alert on a percent of disk quota used above a certain threshold.
- Load Balancing High 4xx rate for an LB backend– 4xx responses were greater than 1% of the total responses for an LB backend.
- And more…
What Else Can I Do With the GCP App?
As mentioned earlier, Observe Apps aren’t so much about observing the particular service the App was built for, but rather making everything from collecting, analyzing, and correlation of that data to other observability data easier. Once in Observe, the opportunities to gain new insights from your data, old or new, are virtually limitless. Let’s look at just a few ways this data can be used outside of observing individual GCP services.
- Link Cloud SQL logs and metrics to your Customer Tickets with GraphLink to see when a database issue occurred, and how it affected your customers.
- Combine Audit Logs with Observe’s natural ability to show how resources change over time to get a complete picture of what’s changed in your environment, who changed it, and when it changed.
- Couple Load Balancing logs with Kubernetes Pods, or Compute instances, to get a detailed view of where network traffic originates from and where it is heading in your environment.
- Link CI/CD Build logs to Cloud Functions to get enhanced visibility into failed deployments to your serverless infrastructure.
- Get a detailed audit trail of changes made to Cloud Storage buckets in any region.
Getting Started With the GCP App
You can find instructions on how to install the Observe GCP app by visiting the GCP Integrations page in our docs. In addition, you’ll find a much more detailed guide on how the Observe GCP App works and its many applications.
Beyond Monitoring
If you want to simply monitor your GCP environment, Google Cloud has native tools for that – but you can’t call that observability. You don’t need another tool to manage, and at the end of the day, your data is still siloed.
Observe tears down data silos by showing relationships between virtually any type of data, structured, or unstructured, from virtually any source. With Observe you can see how your GCP data is related to other cloud providers, CI\CD events, or the performance of your app. And because Observe tracks the state of everything in your environment you’ll be able to discover how these relationships changed, and when to make troubleshooting a cinch.
If you want to see how the new Observe GCP App can make observing your GCP environment(s) easier, then click here to request trial access today!
