Observe Direct: Spring 2022 Announcements, Funding, and Features
 By Liam Rogers,May 11, 2022
Observe is excited to share an update on our momentum. We hope you were able to join us for Observe Direct (a quick 10-minute video) to hear from our founders and members of our team. Observe has new funding from Sutter Hill and Madrona as well as new investor Capital One. There has been significant growth in customer count, the amount of data customers are pulling into Observe to query, and our own company headcount. Observe has also grown with multiple new integrations and product features. We’ve improved our dashboards, metrics, and alerting experiences and unveiled our new app installation interface.
Business Update
As Observe grows closer to completing our second full year of selling – after we emerged from stealth in Q4 2020 – we’ve had strong growth across the board. We’re nearing our 50th customer and are in the tens of petabytes of data ingested. Not to mention customers are performing a cumulative 25 million Snowflake queries a day: that’s a lot of observing!
Since our launch, Observe has raised approximately $70m in Series A2 funding. This includes additional investment from Sutter Hill Ventures (SHV) and Madrona Ventures as well as new investor Capital One. This brings total funding raised to date to over $114.5m.
The team has also grown significantly as we’ve doubled our headcount in the past year to nearly one hundred employees and we’re still growing. If building the future of observability sounds like fun to you please get in touch!
Product Updates
Observability continues to be a popular term and having an observability platform that can mitigate complexity in distributed systems to dramatically reduce MTTR is more important than ever. While we continue to make Observe the ultimate observability experience, we’ve also gotten great feedback from customers. The following new feature updates to Observe include maximizing what makes it great (like how we relate data) along with providing the expected user experience.
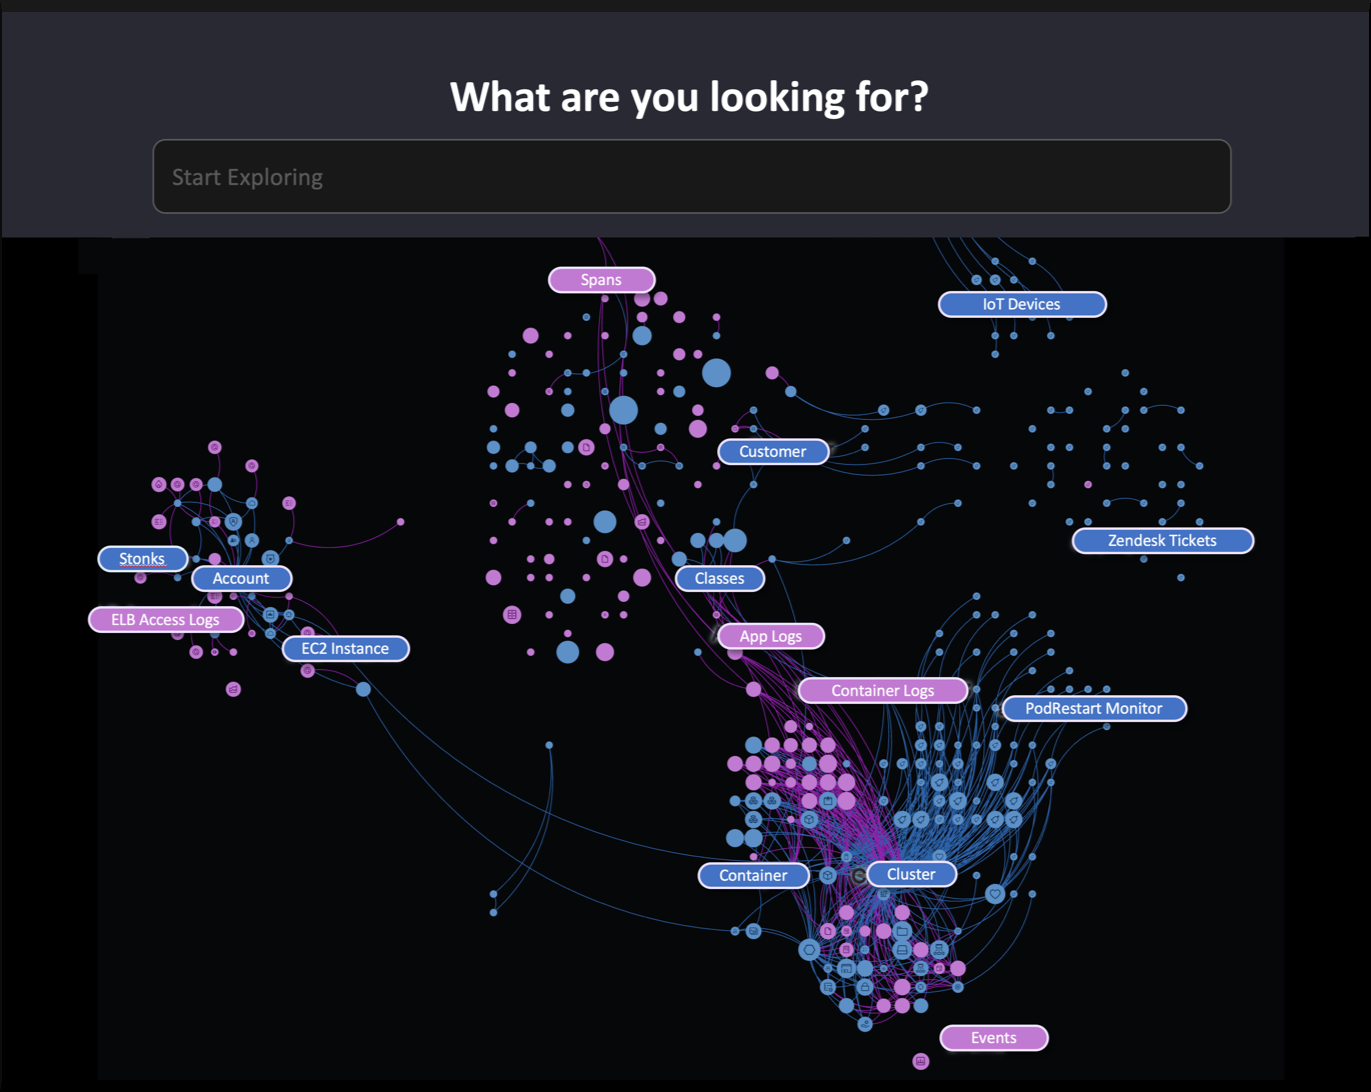
Universe Maps, Understand Your World
Observability isn’t just about asking questions in the form of queries, it’s also important to be able to freely explore your systems to glean useful information. Universe Maps take advantage of our ability to understand the relationships in your data and present them in a way that humans can intuitively understand. When Observe transforms data and turns your telemetry into “things” it essentially creates your own private data universe. Universe Maps are embedded into every dashboard and are the gateway to exploring your world of data. Coupled with features such as Dataset Graph, the experience of intuitively navigating your systems and data in Observe has never been easier.
Metrics and Alerts For Humans
Metrics and alerting aren’t new to Observe, but now they’re even better! Metrics can be hard to implement, too general and they might not be useful, too specific and it’s too much work to set up. We’ve also simplified the process of working with metrics by building a flexible metric expression builder.
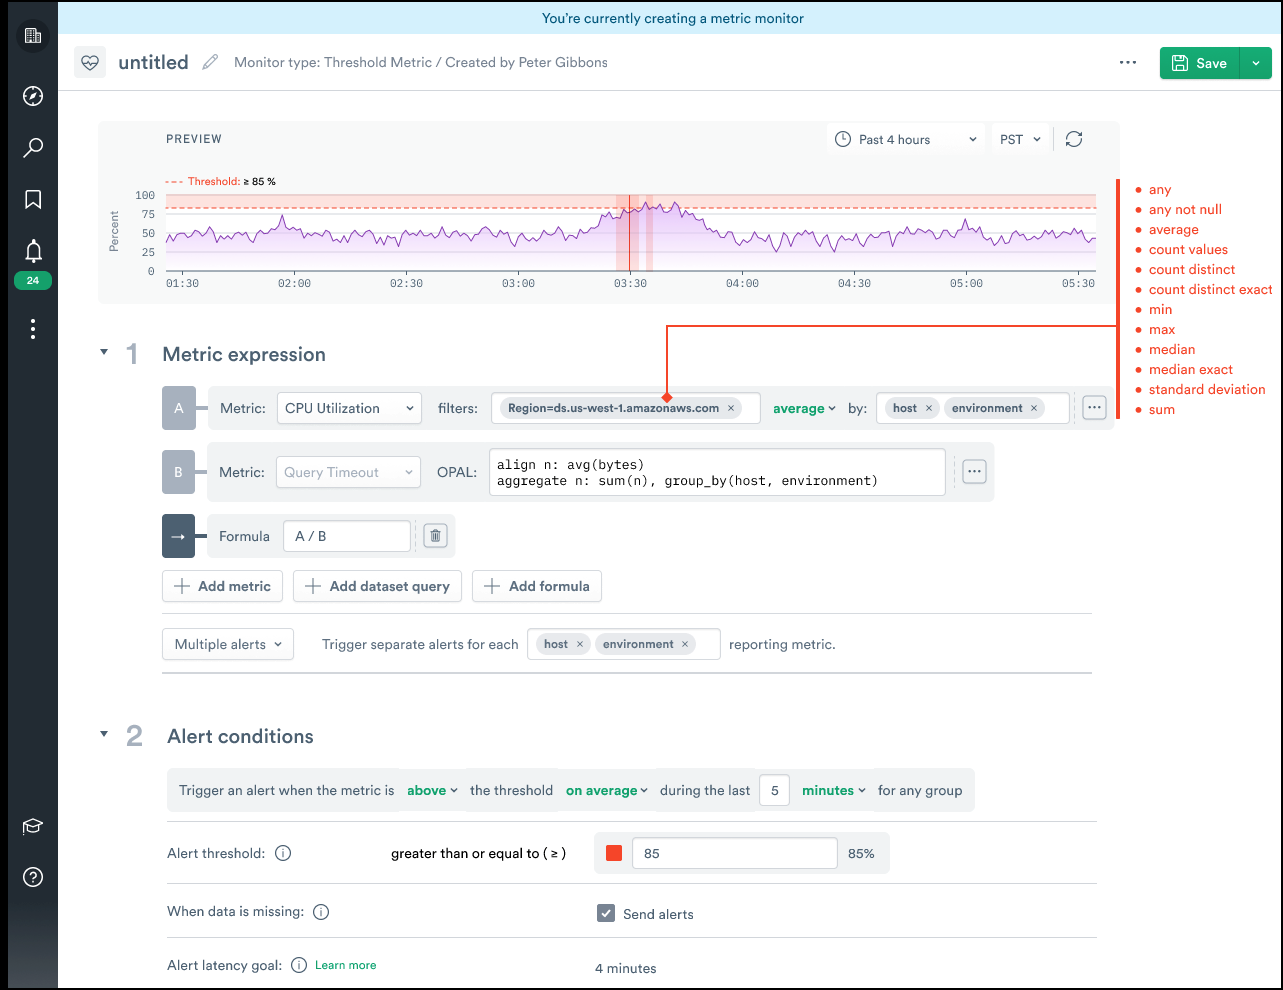
With the metric expression builder, you can add and customize formulas in the GUI (or with custom OPAL expressions if you want to) to do things like combining multiple metrics in a single graph, etc. You’ll then be able to set your ideal alerting conditions based on those metrics. This experience will only make it easier to ensure you’re getting alerted on the things that really matter. It also means you aren’t restricted to grouping or filtering based on predefined tags and can instead use any related field such as “pods” or “users.”
Dashboards With Actual Insights
Dashboards are a part of your everyday life and the pulse oximeter letting you know if your systems are healthy or not. However, a dashboard is only as good as the data behind it: if you can’t drill down into an issue quickly then you’re not getting much value from that dashboard.
To help customers hit the ground running we’ve added even more out-of-the-box functionality including dashboards based on our plethora of integrations. You’ll automatically see dashboards with relevant metrics and they’re fully configurable so you’ll see selections from your worksheets that can be dragged onto an interactive table. Dashboards are also backed by our GraphLink feature so not only can you customize your dashboards to your heart’s content, but you’ll be able to easily dig into the datasets behind them and use them to jump into even more detailed views of your data. Dashboards are just another starting point for exploring your data universe.
Observe Apps, The Integrations You Need
Our engineering team has been hard at work building all the integrations customers expect to make onboarding data from their favorite services a frictionless experience. This includes newer integrations like those for Fargate-backed EKS, ECS clusters, and Linux Host Monitoring – we’ve also been trialing new GCP integrations. Offering a breadth of integrations for critical services will continue to be a focus, but we’ve also been developing an AppStore-like experience with an intuitive UI for installing both curated and custom integrations.
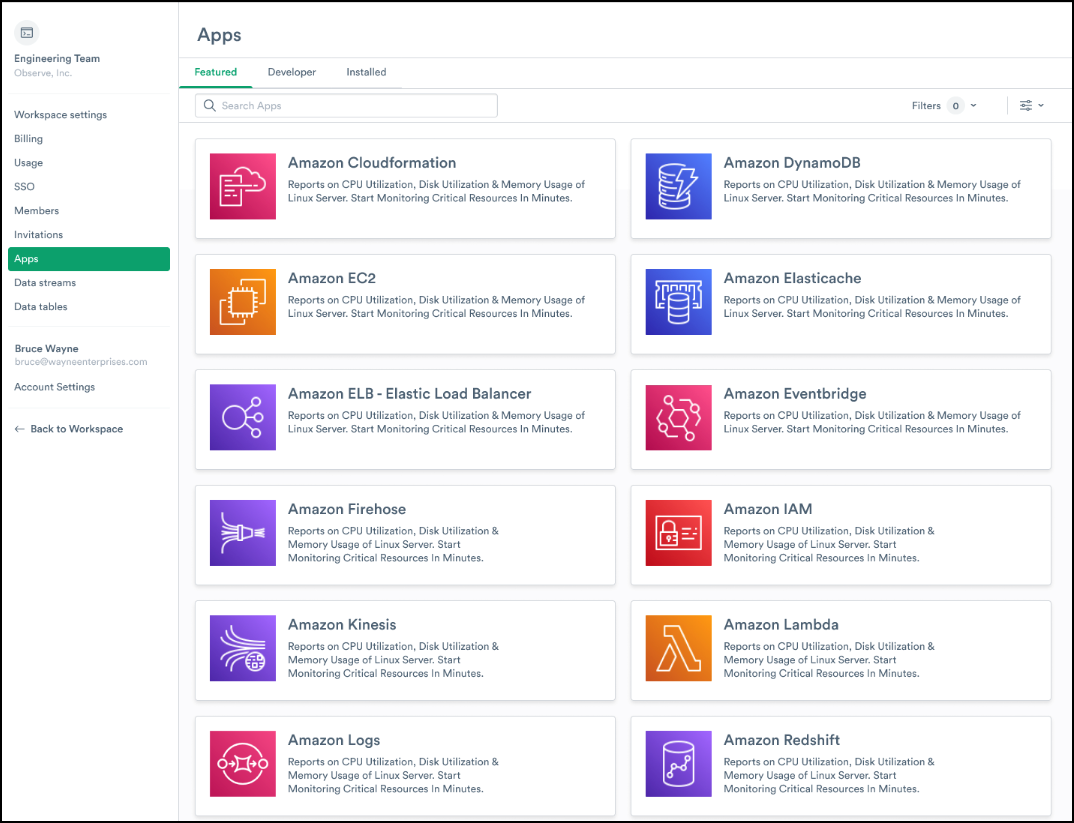
Observe apps let you easily select from recommended installs to get up and running quickly. However, users can also use the UI to reconfigure or update existing installations as needed, as well as add their own custom integrations. Thanks to our usage-based pricing, we encourage users to ingest as much data as possible, and these new integrations have made it easier to get all of your telemetry into Observe.
OPAL Enhancements
The OPAL query language powers all the data processing in Observe and is essential to the way we model data – whether users interact with it directly or rely on the OPAL generated by actions in the UI. We are always expanding what’s possible with OPAL and have recently added 20 new verbs and features. One example is the Merge Events verb which allows you to merge multi-line log statements into a single event, and because Observe’s underlying architecture allows you to create schemas on read you can always change combinations later as needed. Keep an eye on our Verb of the Month series if you want to really dig into what’s possible with OPAL.
Looking Ahead
The metric expression builder, new dashboard capabilities, and apps are all expected to be generally available in June 2022. We’ll be digging into some of these updates in more detail in future posts and there’s even more content coming such as improved tracing!
There’s also continuous work happening behind the scenes to make sure Observe is as efficient as possible for our users and that they’re getting the most out of their compute credits. Recent efficiency improvements include making transform costs more efficient by 75-90% when it comes to resource datasets with semi-structured fields.
Our usage-based pricing already sets us apart and imparts huge cost savings for customers, but we want to ensure using Observe is as efficient as possible to provide the most value.
That’s it for our Observe Direct announcements! If you or your company wants to learn more about Observe, we encourage you to join us for one of our weekly live demos.