Metrics and Alerting…don’t have to suck!
 By Knox Lively,June 7, 2021
Each alert — no matter where it surfaces — drives the user back to the alerting resource and into more context.
Hard at work
Since our initial launch in October of last year, we’ve been hard at work in developing the next evolution of Observe. We’ve closed over 1,100 issues in Jira, hired twenty-one new employees, and drank approximately 4,800 cups of coffee — maybe more. Though it seems like the backlog of features, improvements, and bug fixes are never-ending, so much has been accomplished in these eight months.
We have so many exciting product and company updates that we created Observe Launch Part II to share this great news with you. You can expect to hear about how we do alerts and metrics differently, as well as success stories from customers who use Observe to break down silo walls between teams, resources, and the data they generate. Until then, we wanted to share a brief overview of what we believe is the future of metrics and alerting.
A Brief History
Observe’s founding principle is based on the fact that enterprises are swimming in data, yet starving for information. This phenomenon is driven by the fact that Observability is currently practiced using the three pillars approach: data is separated into 3 separate silos — logs, traces, and metrics. This makes it difficult to understand what’s happening inside your applications and infrastructure because there is no context, or “linkage,” between the data and what is emitting that data. We call this “data soup”.
Besides wasting engineers’ time and creating a poor customer experience, it will cost you an arm and a leg to store your data soup. We knew there had to be a better way to get context from your data, so we started with logs. We knew that if we could create contextual awareness from log data, and preserve the link to the resource emitting the logs — a shopping cart, Kubernetes pod, or even a customer — we would be creating the building blocks for discovery. This “deep context” allows the user to begin asking questions of the familiar resources they already understand, rather than searching through raw event data.
It’s this — almost reverse — approach to information architecture, where we create connections before asking questions, that creates such a powerful link between your data and the resources in your environment(s). This is a foundational concept in Observe, and we don’t apply it just to logs. As of today, we do this for metrics and alerts. Both can now be contextually linked to the resources they’re reporting from, actionable, and all in one place.
Metrics that matter
We knew the first step in re-imagining metrics and alerting was to start with metrics. We wanted to present metrics contextually, where and when you need them, rather than generate useless dashboards. We also knew that we wanted these metrics to be information-dense, highly customizable, and actionable.
Our solution was to curate metrics and link them directly to the resources from which they are emitted, and surface them in programmatically generated dashboards we call Landing Pages. This out-of-the-box functionality is meant to save time and prevent headaches, by giving the user most of the metrics they need quickly in one place, while not overwhelming them with metrics they don’t care about. We realize that we may not nail everything right out of the box, so we give you the ability to edit and customize them to reflect your real-world needs.
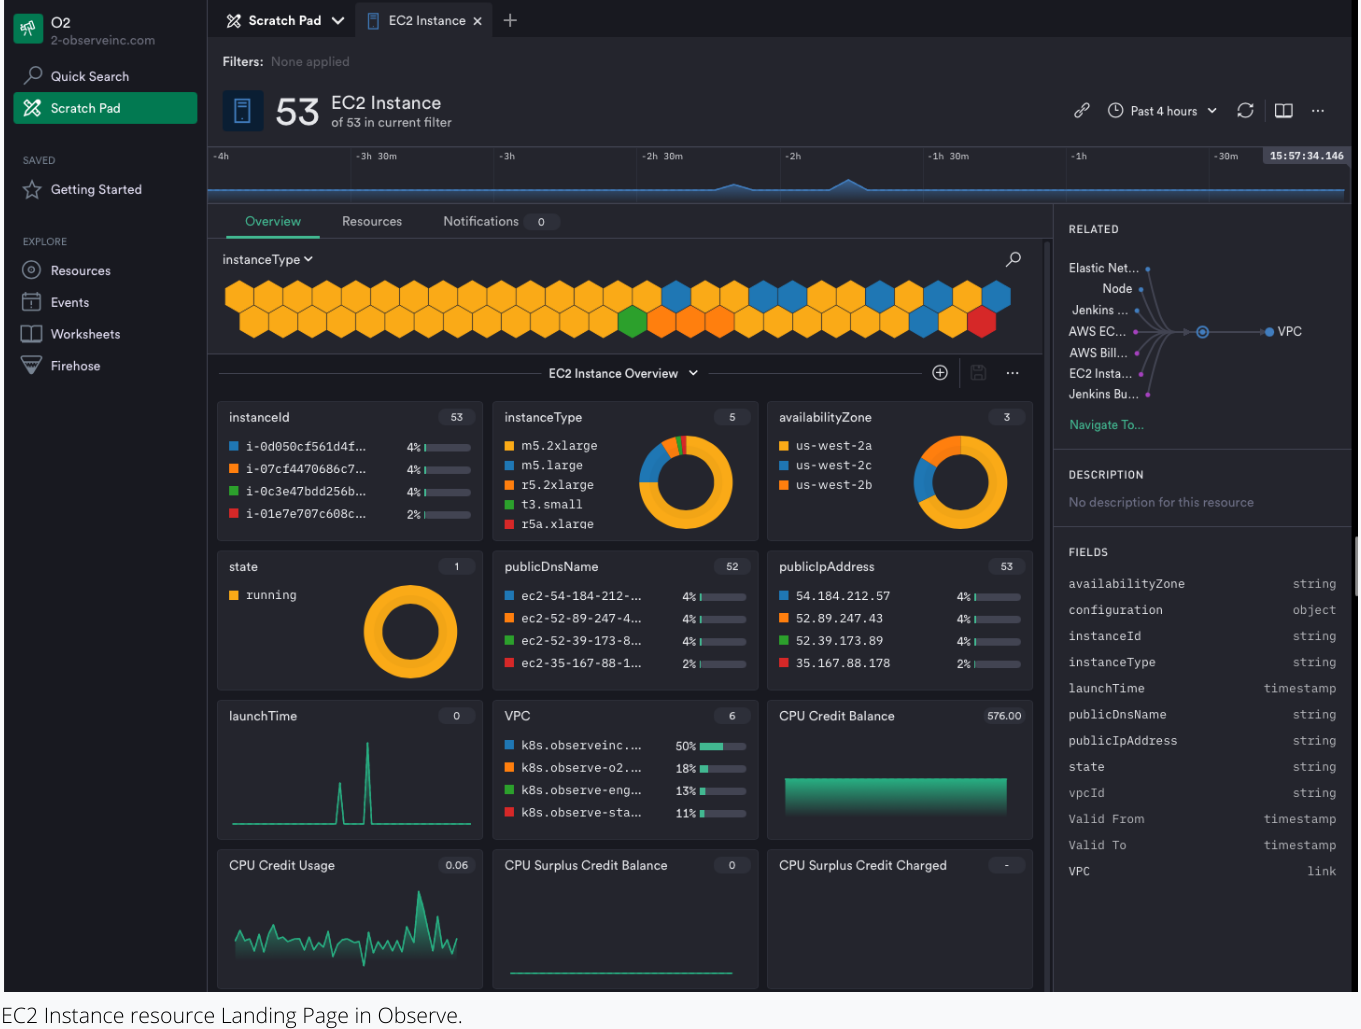
The real value in Landing Pages is the ability to follow metrics between other various Landing Pages and see the relationship between metrics and resources. We do this by using a graph of connected datasets behind the scenes, which we call GraphLink. Observe automatically does this without the user having to create tags or labels for each resource they care about — a task that over 70% of SRE and DevOps Teams spend at least six hours a month performing, according to our recent State of Observability report.
Alerts you’ll care about
Just as with metrics, we knew alerting should be tightly integrated with our resource-based troubleshooting workflow. Users should be able to easily configure triggers on resource state — or activity — and quickly relate each alert to the parent resource. Additionally, users should have the tools to quickly establish the root cause in one place without any context switching.
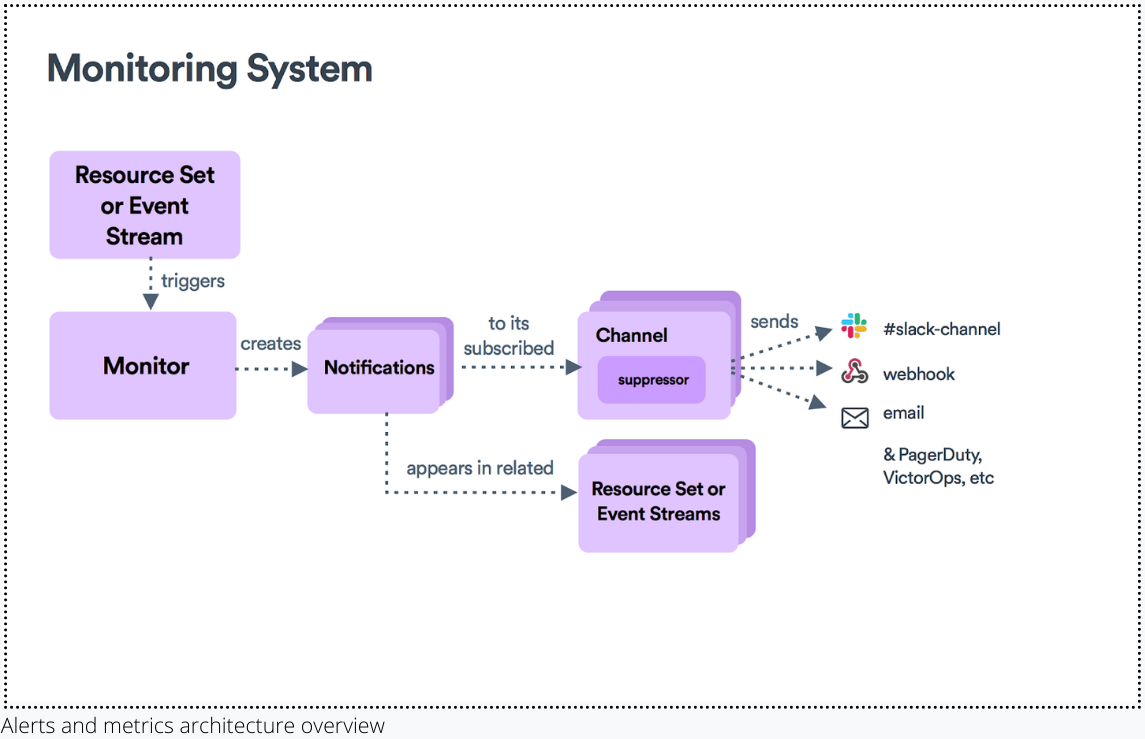
In other incumbent products, an alert may fire off that provides some useful properties and links to a pretty dashboard but has no real relationship to the underlying resource. It’s up to the user to find or create the context for this alert. This often involves at least a few browser tabs and a bit of institutional knowledge — not ideal. In Observe, alerts can be easily found on Landing Pages as “Notifications” in addition to traditional locations such as email, Slack, etc. — depending on how they’re configured. Each alert, no matter where it surfaces, drives the user back to the alerting resource and into more context.
Lastly, we wanted to naturally extend Observes’ streaming foundation to alerts. This means alerts are incrementally updated automatically; compared to traditional alerting systems which must evaluate queries repeatedly until a certain condition is met. This makes querying and alerting cheap in terms of performance and price. This architecture also allows for naturally clearing conditions, and allows users to see monitors and alerts in the context of historical data — which is useful for creating time-based policies such as SLO’s or SLA’s.
The future of metrics and alerting
We’re excited about the future of metrics and alerts, and we are just getting started! In the coming months, we have plans to extend alerting to worksheets, as well as the ability to publish metric datasets and more options for customization and visualization types. Until then, we hope you can join us for Observe Launch Part II on June 9th, 2021 to learn more about metrics and alerts, redefined.