Updates to Amazon Data Collection Strategy
 By Knox LivelyJuly 26, 2021
With the addition of the new AWS collection method, paired with CloudWatch Metrics, it’s safe to say Observe does a better job at collecting data in one place than AWS itself.
Earlier this year, we showed you how you can easily integrate AWS’s CloudWatch Metric Streams into Observe. This integration brought a 3x cost reduction in acquiring metrics, a vast improvement in latency upon load time in Observe, and it also reduced the management overhead of maintaining data forwarding agents.
As exciting as that integration was, we knew there was still plenty of work to do around data collection. For Observe to work well it needs a periodic synchronization of data, otherwise, users will get false reports on the state of Resources. This, coupled with the importance of AWS as a modern cloud computing platform, led us to redesign the way we collect data from AWS services.
AWS Data Collection 1.0
Traditionally, CloudWatch Logs and CloudWatch Metrics have provided the bulk of Observability data from AWS Resources. Together, they provide timely metrics and the typical log messages you’d expect to see from your services and infrastructure. However, neither tell you much about the events and state of your infrastructure — or at least not easily.

Limitations of AWS Config:
- Little flexibility of when and at what intervals you can collect data.
- Does not include some AWS services (e.g., Route53)
- Unable to access all properties and metadata for most services
- Only one recorder is allowed per region.
We believe that for this data to be useful, it should be coupled with other sources of rich information, such as configuration data. To achieve this, we initially relied on the AWS Config service to provide data from AWS resources. However, it didn’t take us long to realize the standalone service wasn’t as scalable as we’d hoped.
These limitations of AWS Config ultimately led us down the path of redesigning the way we collect configuration data from AWS resources.
AWS Data Collection Redesign
These inherent limitations with the AWS Config service led us to develop a Lambda that can trigger AWS API requests on demand. This means we still gather the same familiar configuration data, but with virtually none of the limitations.
Benefits of using the Lambda over AWS Config
- Collect data from virtually any service at any collection interval
- Flexibility to store config data wherever we choose
- Access to more properties and metadata that are not exposed in AWS Config
- Freedom to access config data from any service or tool without restriction
This new Lambda is essentially a collection of event handlers that wait for an EventBridge event. Upon receipt of an event, they scrape the latest config data from the notifying service, which ensures we get the freshest configuration data. Having the latest data is crucial as state and config are perpetually in flux in modern cloud-native environments.
Furthermore, it must be noted that we still support, and encourage users to use AWS Config if and when it works best for them. This new collection method is supplemental and meant to supplement an already rich dataset found for Resources in Observe. However, if you find yourself needing data from a service not covered, or needing to scrape a particular API at a high frequency, this new data collection method is highly recommended.
But, What Does It All Mean?
All of this new configuration data allows us to build data-rich Resources that we’d previously not been able to due to the limitations of the AWS Config service. We’re able to do this by merging this new configuration data with data from the traditional AWS Config service, CloudWatch Metrics, EventBridge events, and CloudTrail events. This provides a full picture of the configuration and current state of a given Resource.
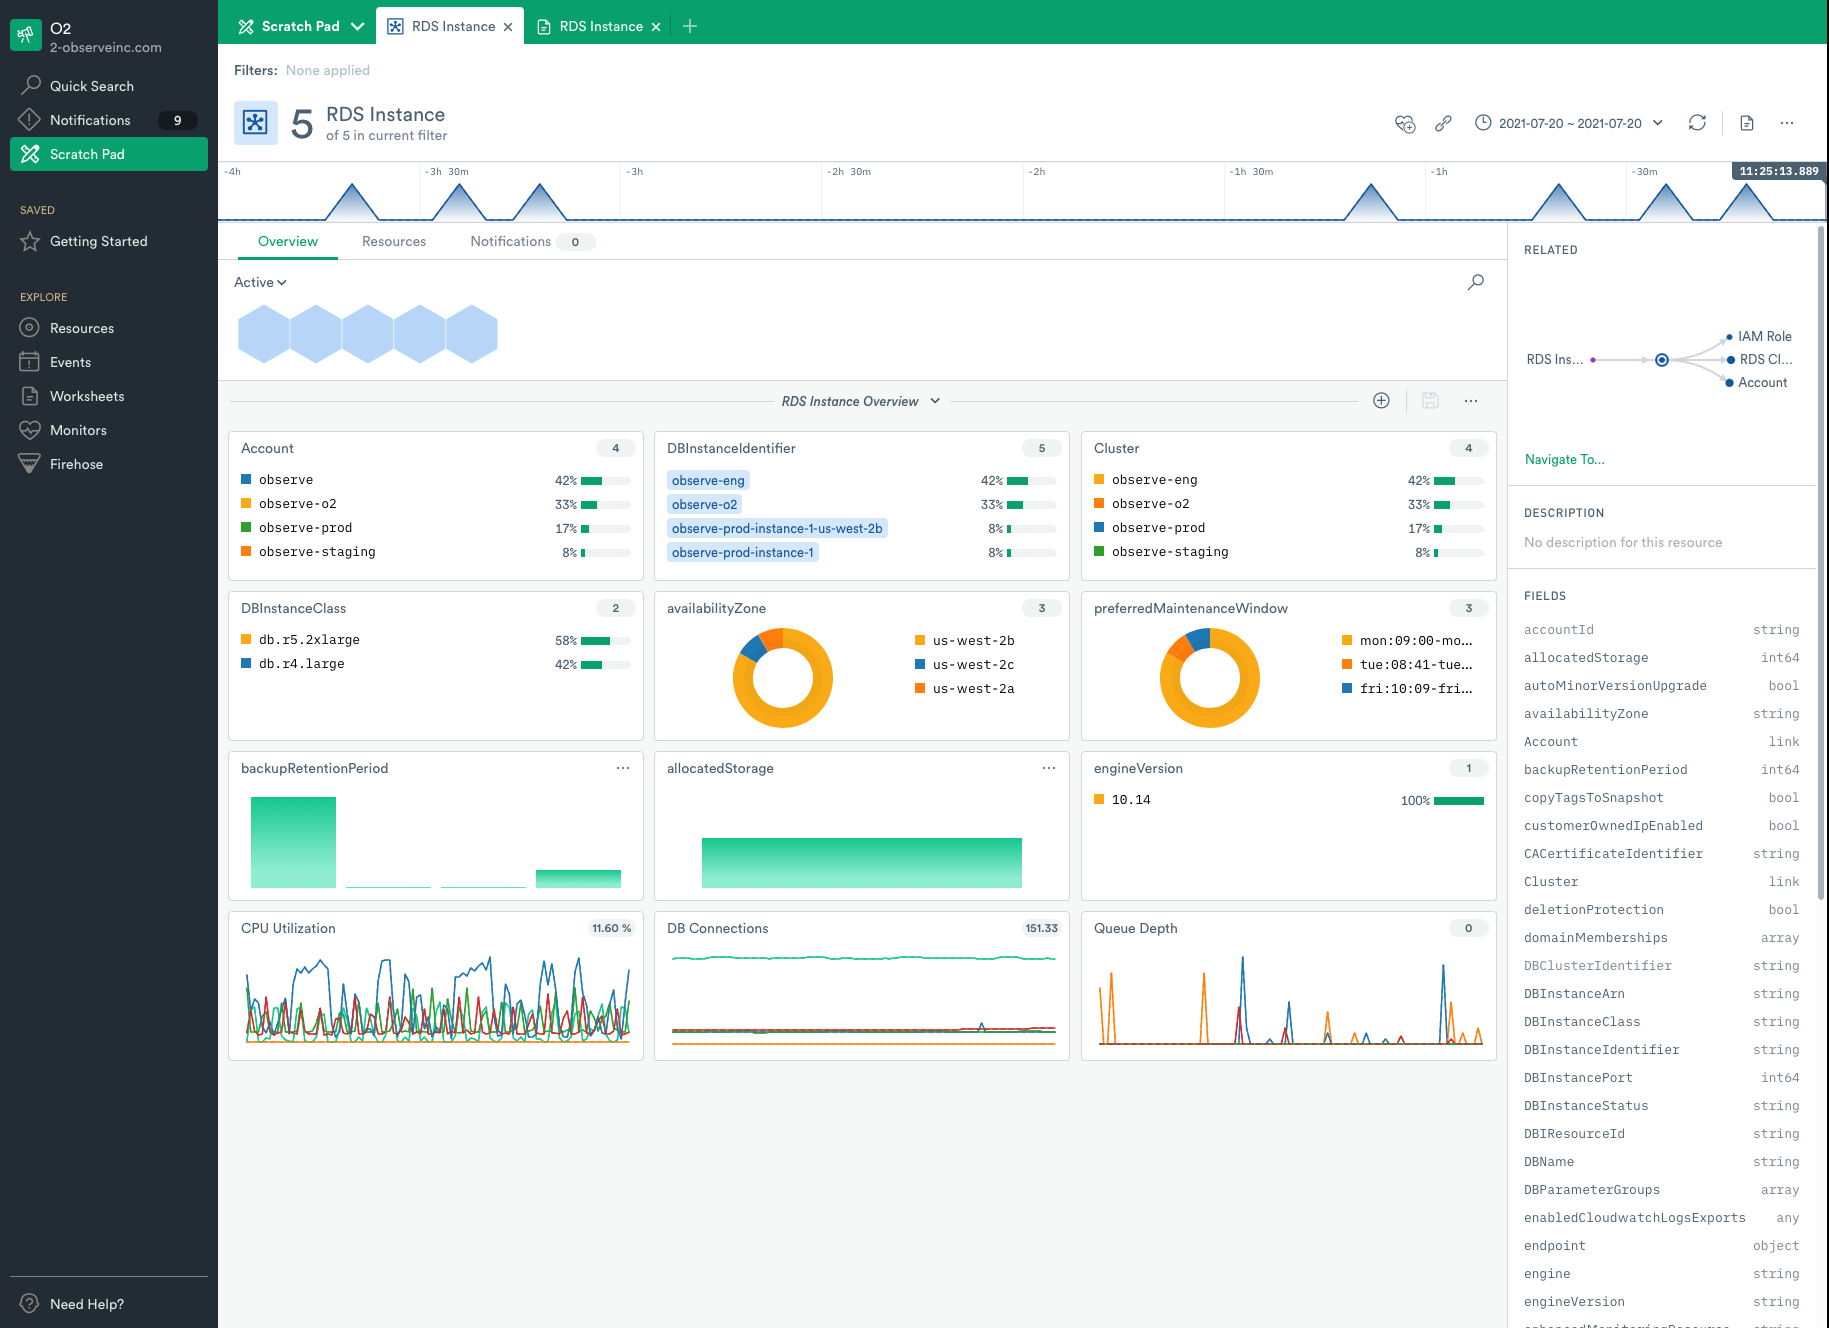
This enables us to create new Resources for virtually any service in AWS, as well as provide incredibly rich data for these Resources, all in one location. Resources such as RDS (pictured above) weren’t possible to create before the addition of the new collection method. Moreover, with the addition of CloudWatch Metrics, you have access to every metric you’d ever need for Observability. This Resource, in particular, has over 50 different metrics you can add to its dashboard!
As the number of services in AWS is continually expanding, you can expect to see more and more AWS Resources pop up in Observe. In just a few short weeks you should see Route 53, ELB, DynamoDB, and others emerging on our platform as we include more services and create models for them.
A Single Pane of Glass
With the addition of the new AWS collection method, paired with CloudWatch Metrics, it’s safe to say Observe does a better job at collecting data in one place than AWS itself. We can collect data from any service, add CloudWatch Metrics, then model that data. The result is a single tool that provides ALL related data for a given resource in one place.
Aside from the obvious benefits of having all your data in one place, you also save on engineering costs — both time and money — from having to develop your own data collection efforts. Furthermore, you can give your browser a break. You no longer need to switch between the AWS Console, CloudWatch, etc., to find all the data you need when troubleshooting. There’s no need to log in to the AWS Console at all! All of your data is in one place and ready for whatever questions you want to ask of it.
Lastly, using Observe to access all of your AWS Observability data is a boon to security. Now that all of your AWS logs, events, and metrics are in our platform, simply login to Observe to see it. This saves you from having to create new users, keys, roles, policies, etc., for each of your cloud providers just to see your Observability data.
That’s Not All, Folks!
This update alone provides more data and context from your resources in one place than any cloud provider today — but that’s hardly where the benefits stop. Thanks to our unique architecture that allows us to ingest and relate any data, these new collection methods amplify our already powerful platform, so you can do even more. Link services, Resources, and virtually any data from AWS to other cloud providers and services for true Observability. This ultimately leads to a quicker MTTR and the ability to ask questions of your environment you’d never imagined.
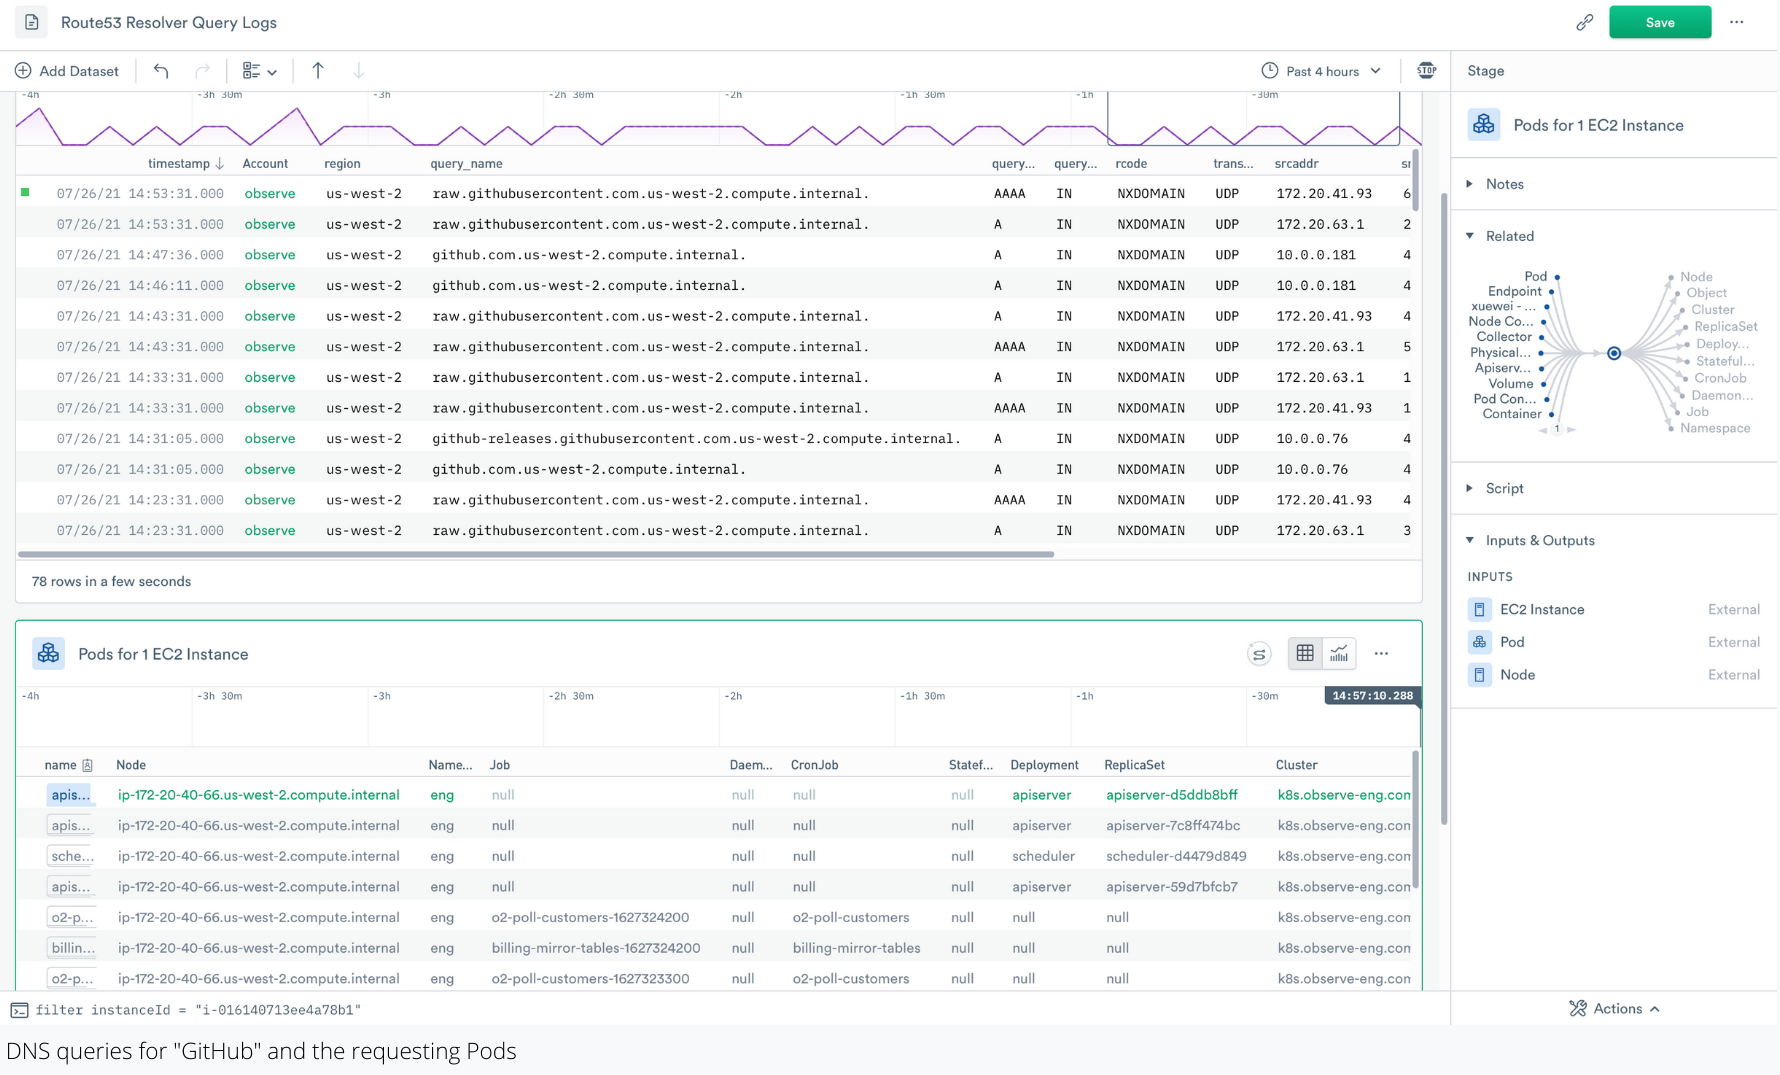
Of the many possibilities with using this new data collection method, Observe has been able to utilize Route 53 Resolver Query Logs to help troubleshoot DNS performance issues within our application. We’re able to do this by linking Resources — such as EC2 Instances or Kubernetes Pods — back to these logs to quickly find troublesome DNS requests and their requestors.
Using these same logs, Observe can quickly identify any issues with isolation between environments. Will the prod environment be affected if the dev is blown away? These are the type of questions that Observe can easily answer now thanks to even more data sources and new collection methods.
Always Be Collecting…
In the coming months, we have many new features and updates coming out. On the data collection front specifically, we are developing new collectors for Google Cloud, as well as a generic HTTP endpoint collector that will allow you to send virtually any data via HTTP to Observe. We’ve also been hard at work refreshing the UI to bring you a more seamless user experience.
Until our next update, don’t forget to subscribe to our newsletter to get the latest news from Observe!