How Observe Uses…Observe! [Part II]
 By Knox Lively,October 31, 2022
O2 has allowed us to discover [and solve] problems that we’d never anticipated when we embarked on building a next-in-class observability product.
Introduction
In part I, we gave a brief overview of the O2 environment and the types of data that we ingest with it. In this piece, we’ll explain how we use this data. But first, let’s define a few common product terms found in Observe – all of which can be found here in our glossary.
- Dataset – Created by Observe from users’ raw event data, Datasets are essentially “things” customers can ask questions about like Pods, Servers, or even Customers. A Dataset has a schema, a set of named columns and the data stored in them, as well as a type (event or resource).
- Worksheet – A view where you can transform and manipulate data directly, “an infinite spreadsheet for your data” if you will. Worksheets may contain multiple stages and visualizations.
- Monitors – A monitor watches a Dataset for a particular condition and sends an alert when it occurs. Monitors use channels to determine where the alert is sent.
How Do We Use This Telemetry?
O2 has allowed us to discover, and solve, problems that we’d never anticipated when we embarked on building a best-in-class observability product – which was the entire point of building a fully observable system. Otherwise, we’d simply say we’re “monitoring” Observe events.
In terms of our day-to-day, O2 enables our engineers, product managers, sales executives, and many others to answer their own questions and make their jobs easier. Let’s dive into a few of these use cases.
Observe Usage Data
Observe usage data is exactly what it sounds like, it’s data we’ve collected about the way our customers use our product. Almost all of our roles and departments use this data, but it’s particularly popular with our product managers.
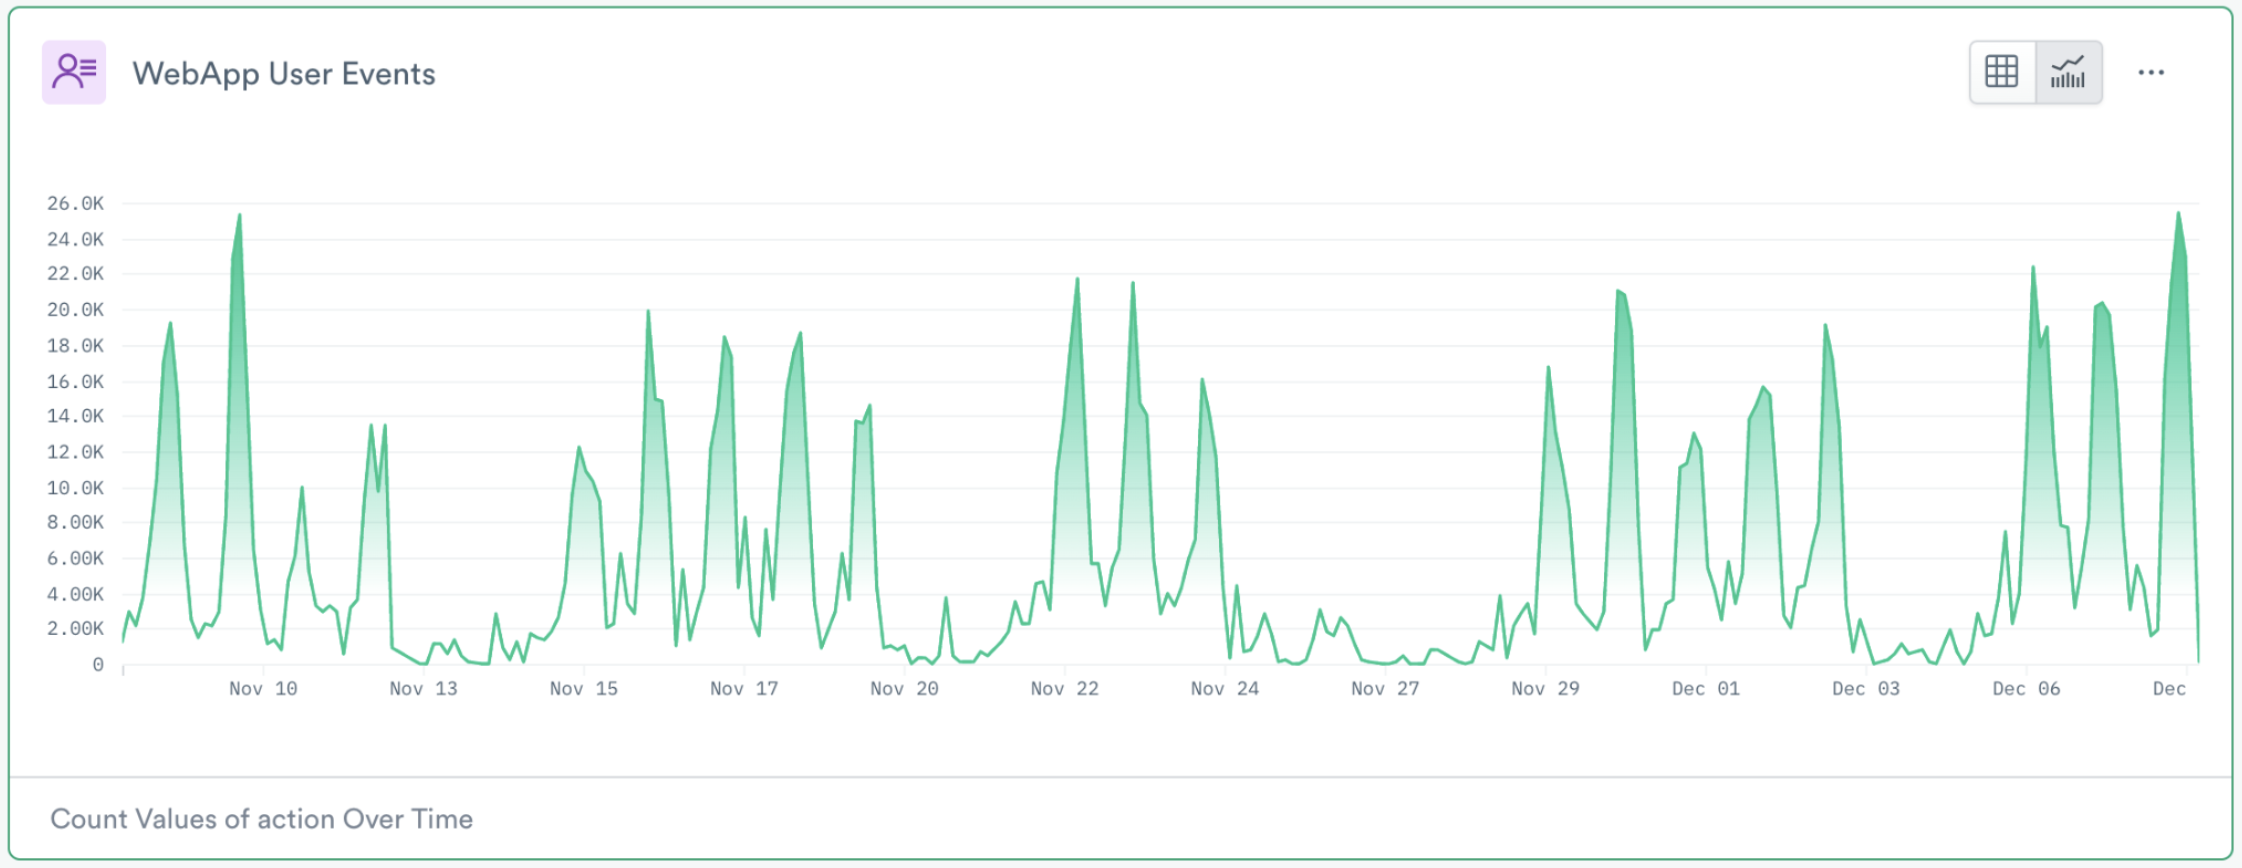
From our usage data, we can extract insights and plot trends using metrics such as “Daily Active Users”, and “User Session Duration”, or see how well new features are received by analyzing “Feature Uptake” metrics.
Our product managers and pricing team rely heavily on metrics around credit usage – specifically, metrics like “Credit Burn Rate” – to help build our latest usage-based pricing model. It’s no small feat, but thanks to the incredibly detailed usage data we gather we can create, test, and tweak our pricing models to ensure customers only pay for what they use.
UI Event Data
In addition to collecting data on general product usage, we collect detailed data on user interactions in Observe. We’re able to do this with a homegrown JavaScript library that instruments errors, logs, page changes, etc., and then shoots those events into O2. After we quickly data model data, we have a Dataset we can configure alerts that trigger on certain events.
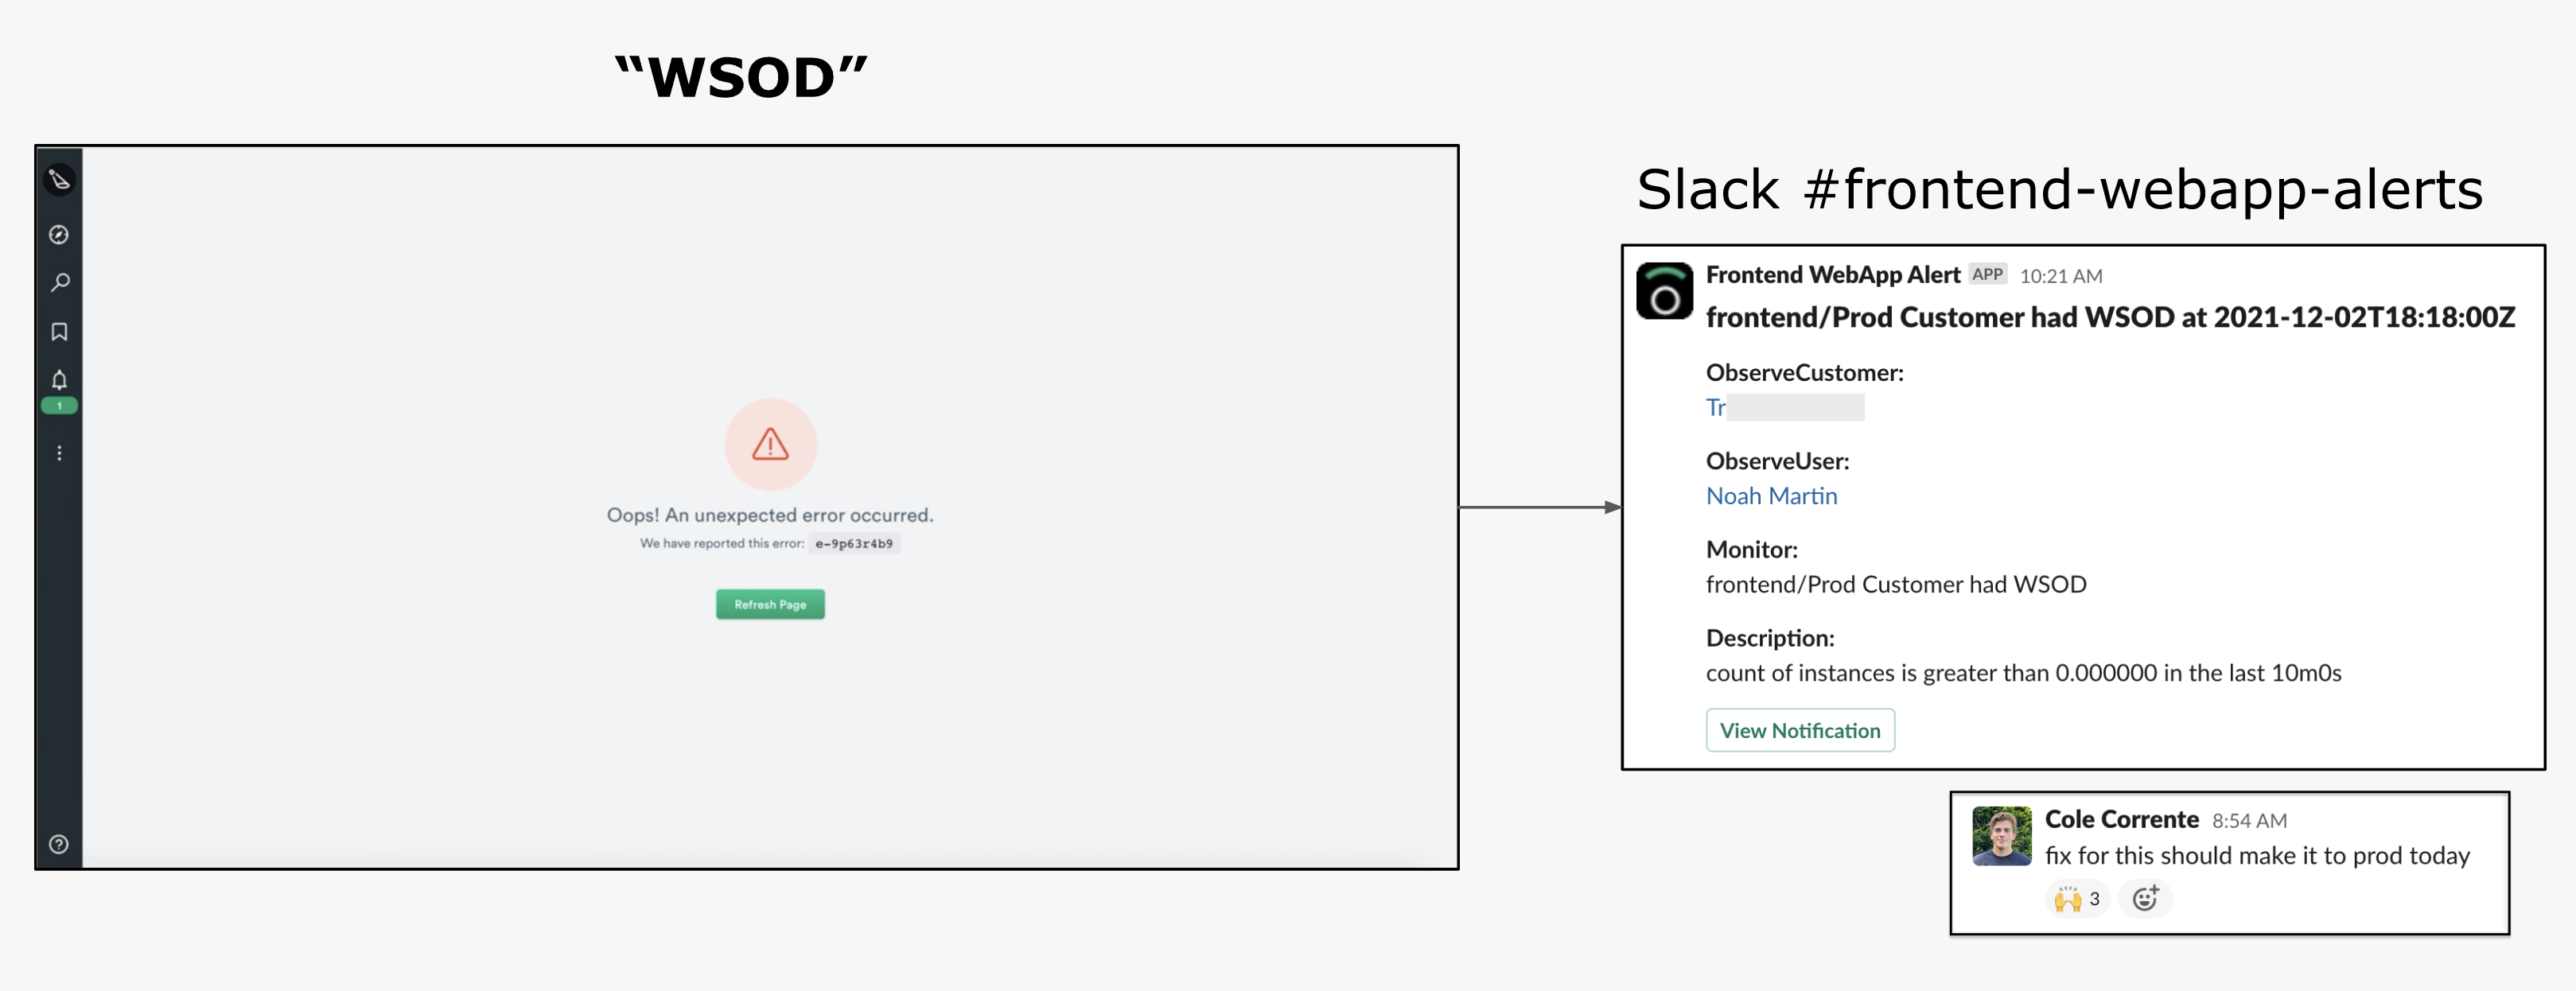
One of the most powerful uses for this Dataset is diagnosing the dreaded WSOD or “White Screen of Death”. We hope you never see one, but in the event that you do, that event is sent directly to one of our internal Slack channels with the full JavaScript stack trace. Ideally, we’ll reach out to YOU before you contact us – imagine that!
At a minimum, this incredibly useful and timely data helps our frontend team reproduce the error and fix the issue.
Observe Backend
Just as with our frontend, we want the same visibility into our backend. Especially so, because Observe was built on a modern microservice architecture with many moving parts and independent services. At the time we began instrumenting our backend OpenTelemetry didn’t exist, so we built our own OpenTracing SDK for Go and C++.
Note: Tracing is in private preview with early customers.
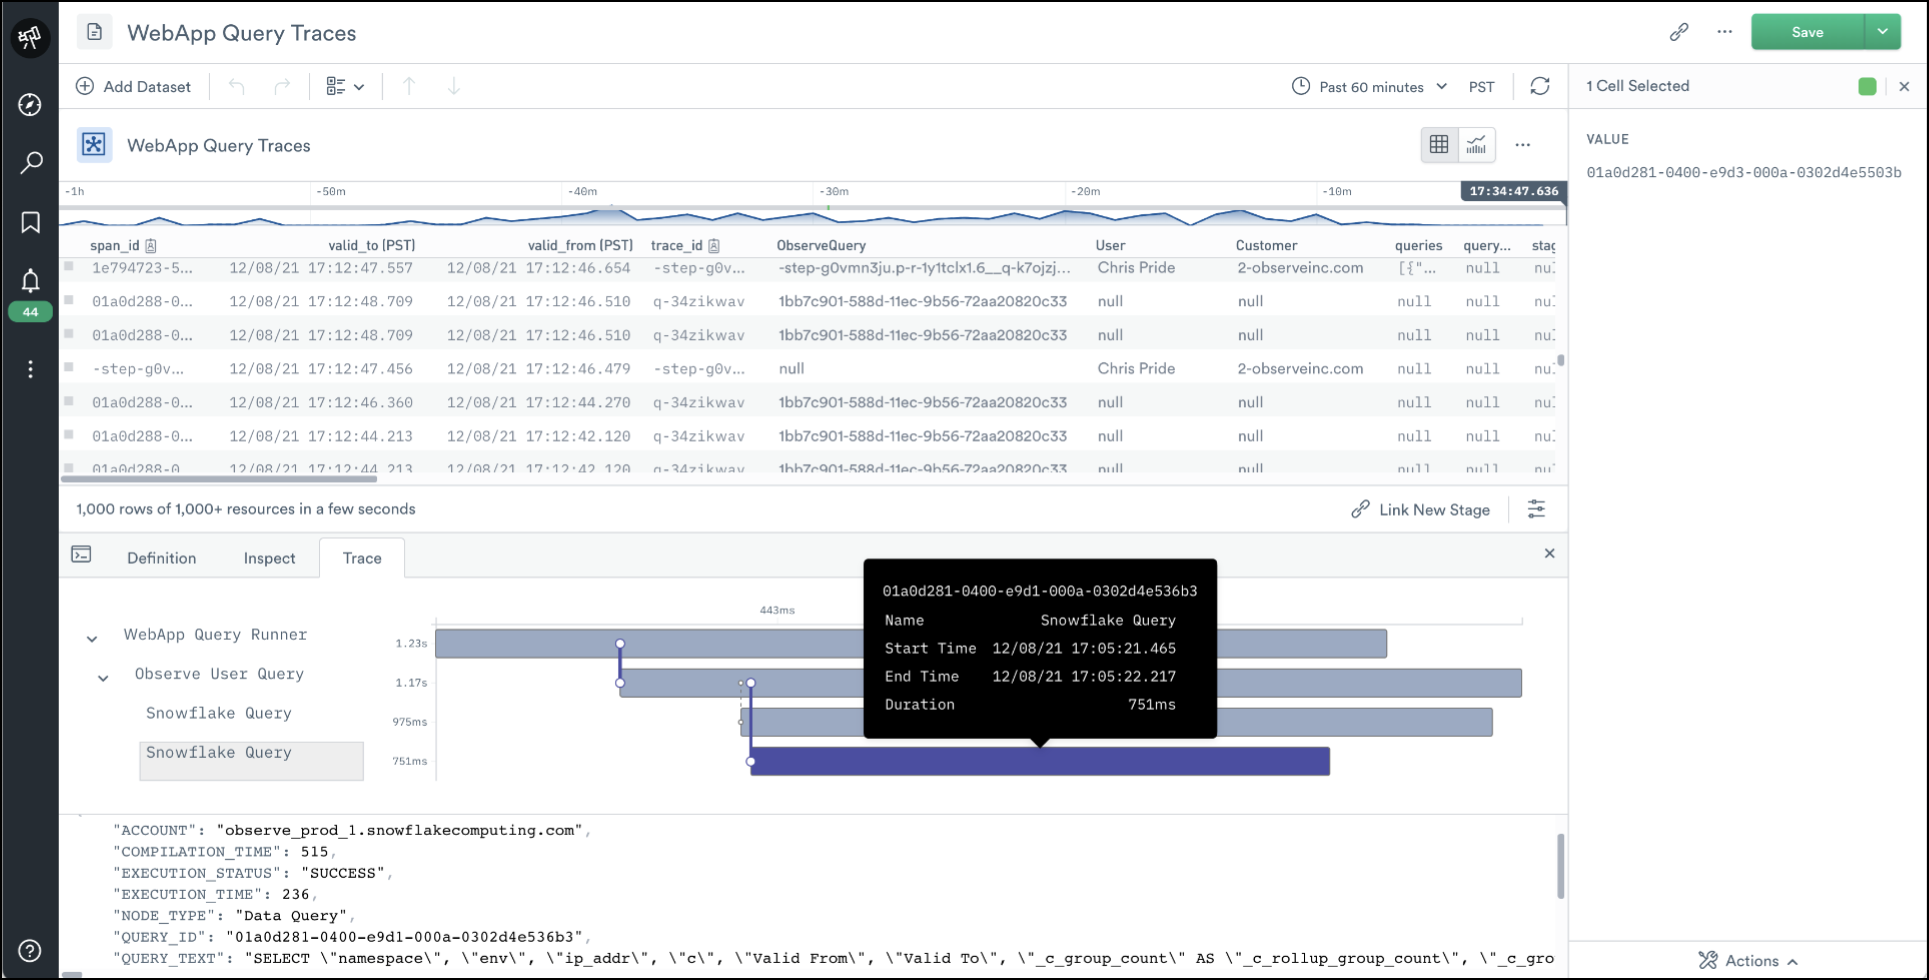
Tracing affords us the usual benefits of a low-level view of our application code but, more importantly, we use this tracing data to build (or “model”) Datasets to make troubleshooting easier. Specifically, this data allows us to build Datasets around 3rd party services whose code we can’t instrument, like Snowflake or GraphQL.
For instance, many of our APIs are GraphQL, and it’s excruciating to dig through raw tracing data to find spans for requests and extract tags each time we want to investigate something. Instead, we built a GraphQL Dataset from this data so we can work with a more “abstracted”, predictable, and human-friendly view of the same data. Much more “fun” than digging through raw tracing data!
Observe Application “Objects”
The Observe application is comprised of many features that users interact with, like Monitors, Worksheets, and Datasets to name a few. This is where users typically start investigations of their own data, so we need to have them somewhere in Observe if we want any visibility around how these features are used and how to troubleshoot them.
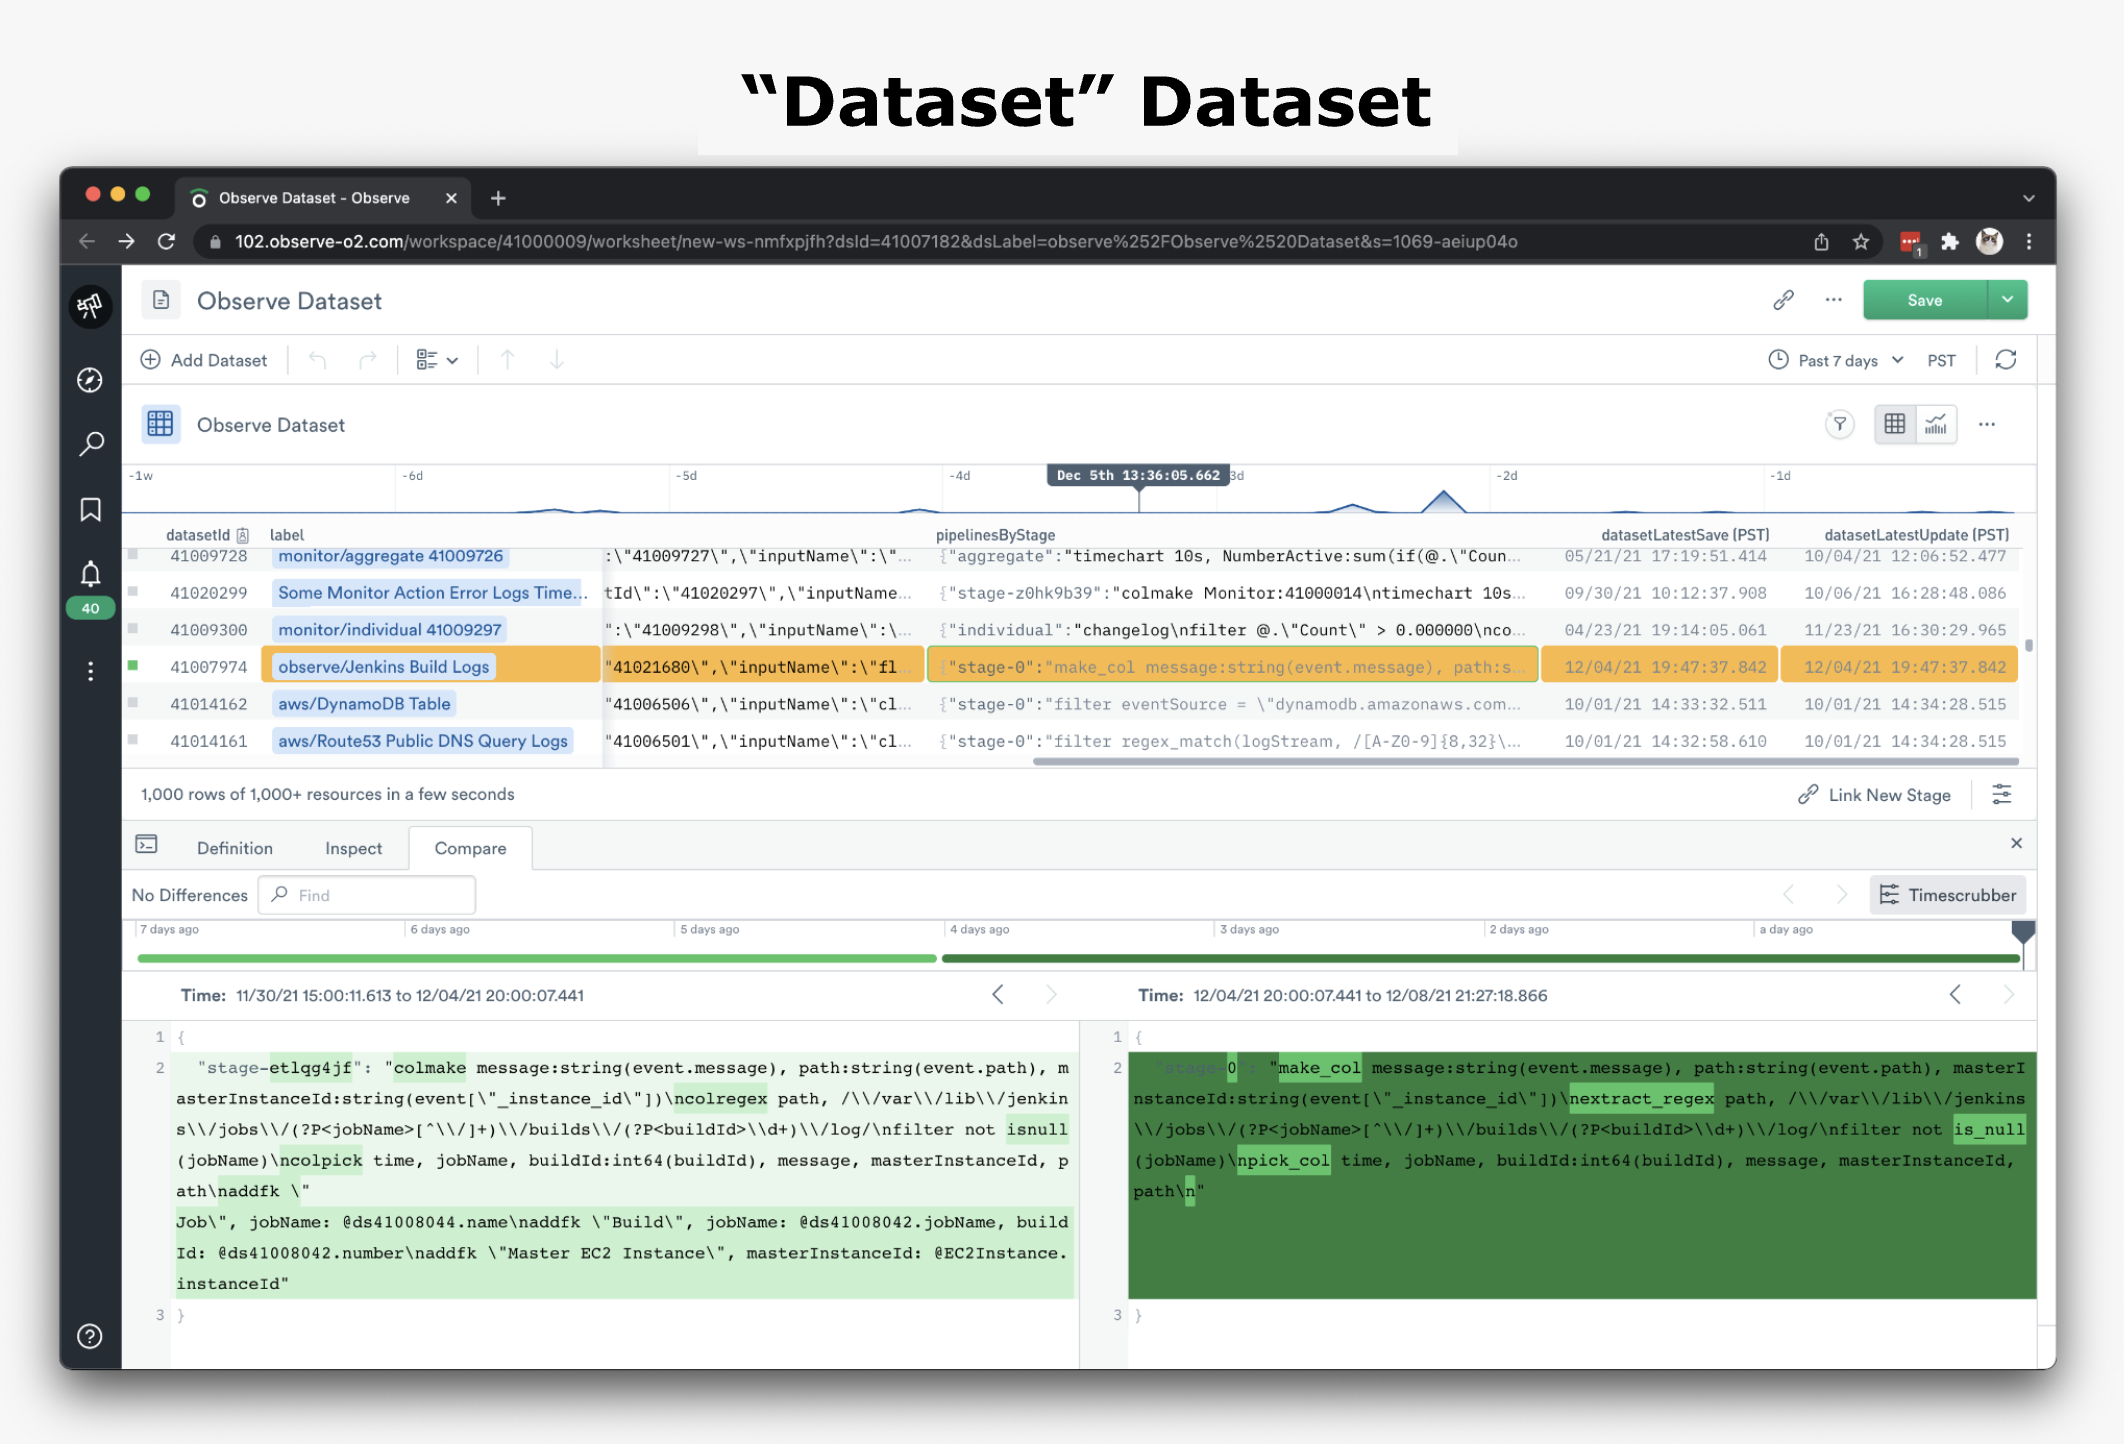
To get these objects into Observe, we created Datasets for each of them by modeling data found in our Container Logs. Whether created automatically by Observe, or by a user (using OPAL), Datasets are an abstraction created from event data that allows users to troubleshoot top-down, versus digging through endless rows of event data.
Now armed with Datasets for Monitors, Worksheets – and yes, even Datasets – we have a strong foundation to begin troubleshooting issues within our product. We can answer routine support scenarios like “What caused error XYZ?”, or help customers troubleshoot long query times. As alluded to earlier, by using Monitors we can notify customers of an issue before they contact us, or are even aware of the issue.
Snowflake Usage Data
Since Observe is built on top of Snowflake, so it may be no surprise that some of the telemetry we ingest comes from our various Snowflake accounts. Using Snowflake’s “Secure Data Sharing” functionality, we are able to import the “ACCOUNT_USAGE” schema and model that data into Datasets for further analysis.
With this data we can perform deep, statement-level, troubleshooting in Snowflake. We can do things like stitch together the entire path from a click in the UI to the Snowflake Query that it spawned – how’s that for visibility?!
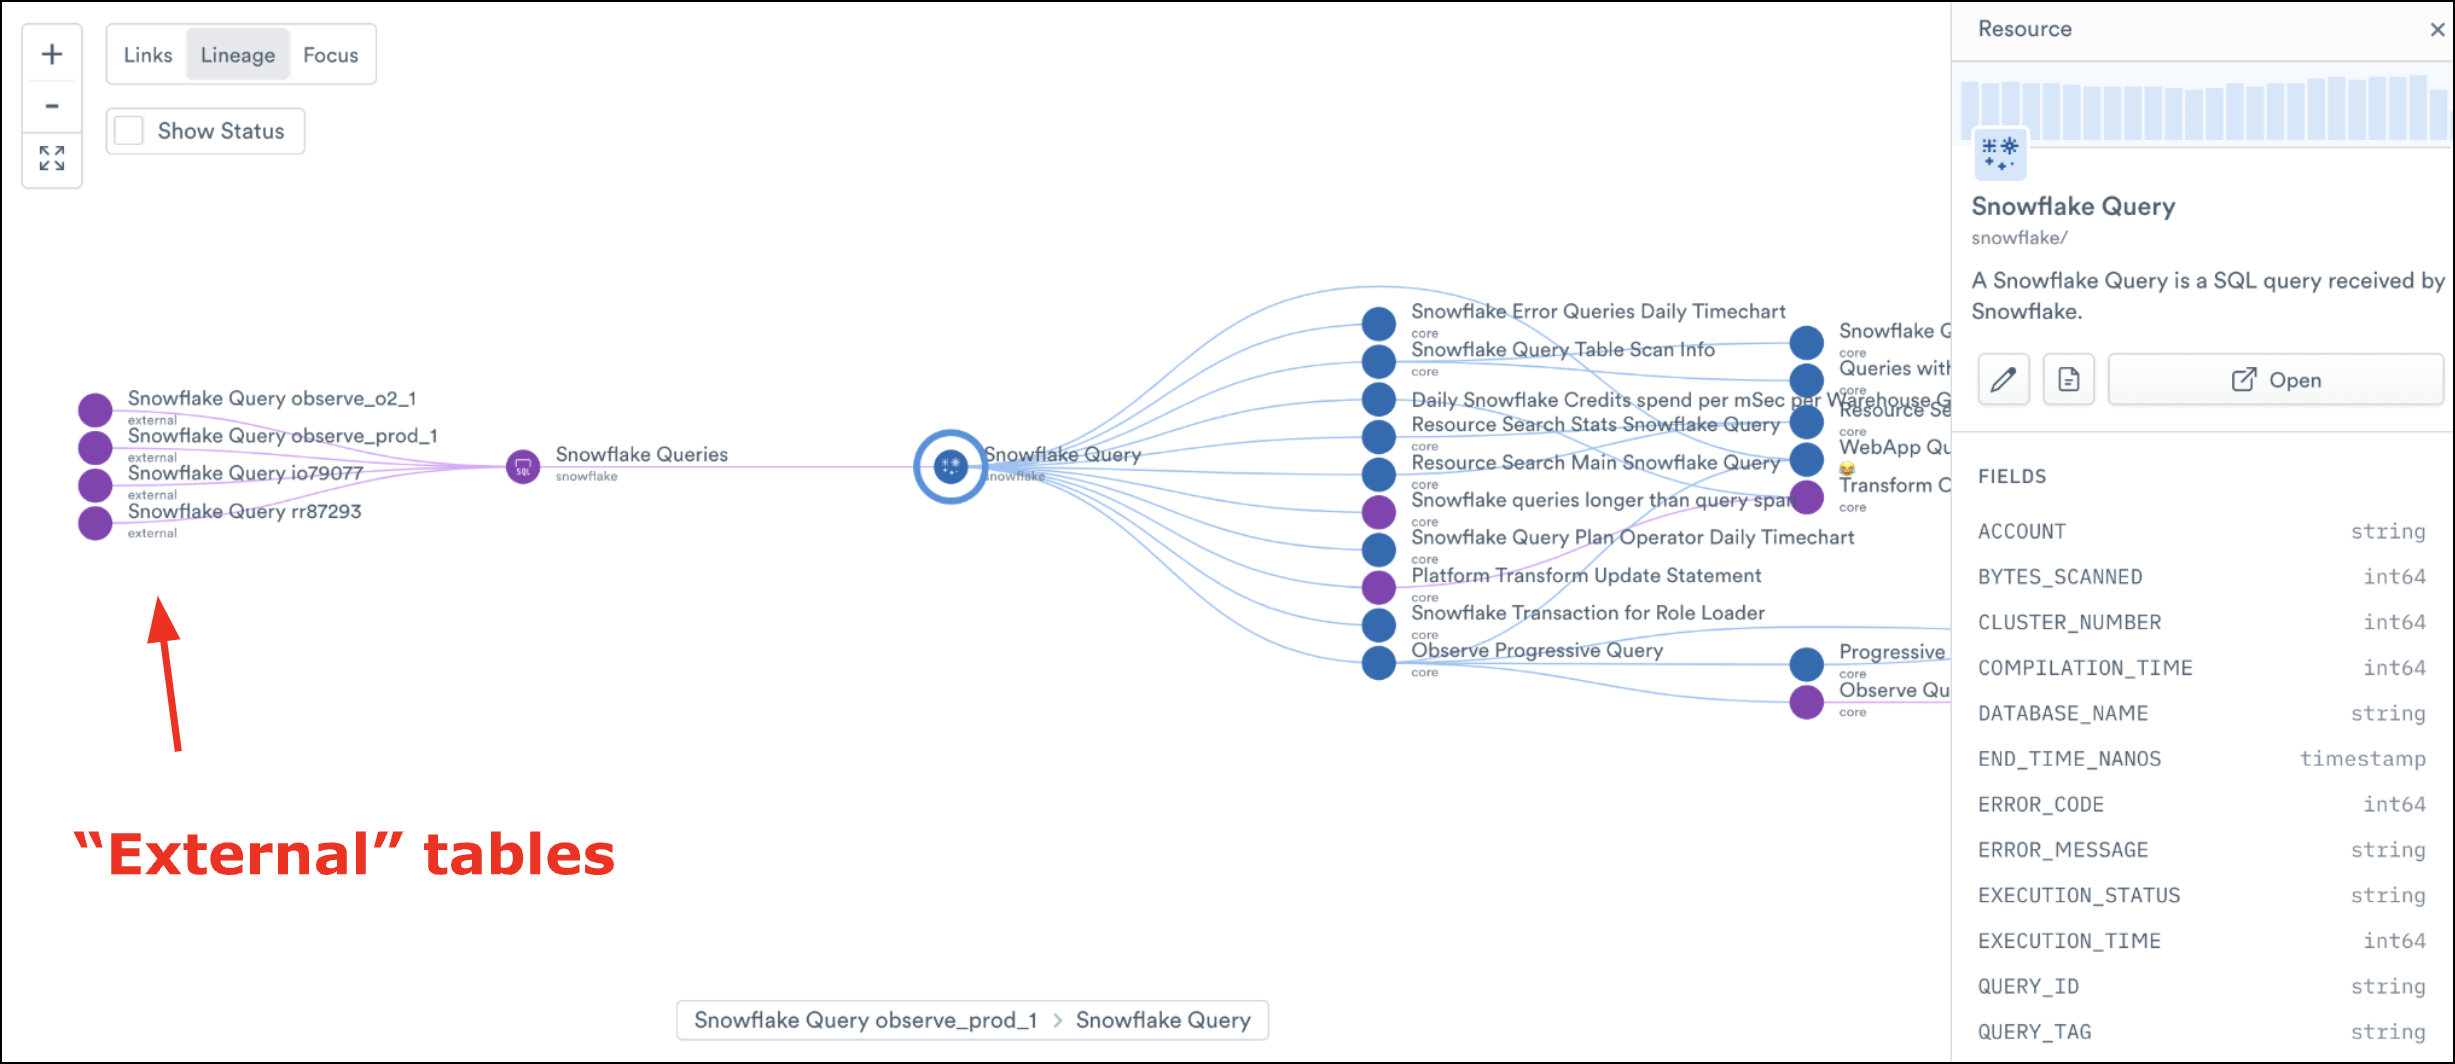
This particular Dataset, called “Snowflake Query”, contains information related to query history, warehouse events, storage uses, etc., and is often the first place we go to begin troubleshooting any Snowflake-related issues. We’ve recently used this Dataset to analyze and solve Snowflake query performance issues that would have otherwise been much trickier to resolve.
Until Next time
In part III, we’ll go beyond how we use these individual data sources and show how we link multiple sources together using Observe to give us true observability. We’ll also share tips, tricks, and best practices we’ve picked up along the way, so you can understand better how to use Observe in your own environment!