What’s New: OpenTelemetry App!
 By Knox LivelyFebruary 27, 2023
Whether you’re looking for a holistic picture of your application’s health, or you need to drill into individual traces to aid in troubleshooting, Observe’s new OpenTelemetry App has everything you need to monitor and troubleshoot your OpenTelemetry instrumented applications.
Introducing the OpenTelemetry App from Observe
Since our launch, our customers have used Observe to store, analyze, and alert on their OpenTelemetry data. We received feedback from these early adopters that they’d like a more prescriptive out-of-the-box solution for troubleshooting their microservice-based applications instrumented with OpenTelemetry.
Today, we’re happy to announce the new OpenTelemetry App which does just that!
Pre-loaded with nearly a dozen Dashboards, Datasets, and tools like our new waterfall visualization, the OpenTelemetry App makes it easy to diagnose and understand performance issues with crucial services your application depends on. Whether you’re looking for a holistic picture of your application’s health, or you need to drill into individual traces to aid in troubleshooting, Observe’s new OpenTelemetry App has everything you need to monitor and troubleshoot your OpenTelemetry instrumented applications.
But before we share more about what’s included and many use cases for this App, let’s talk about what OpenTelemetry is, and why it’s crucial for Developers, DevOps Engineers, and SREs alike.
What is OpenTelemetry (OTel)?
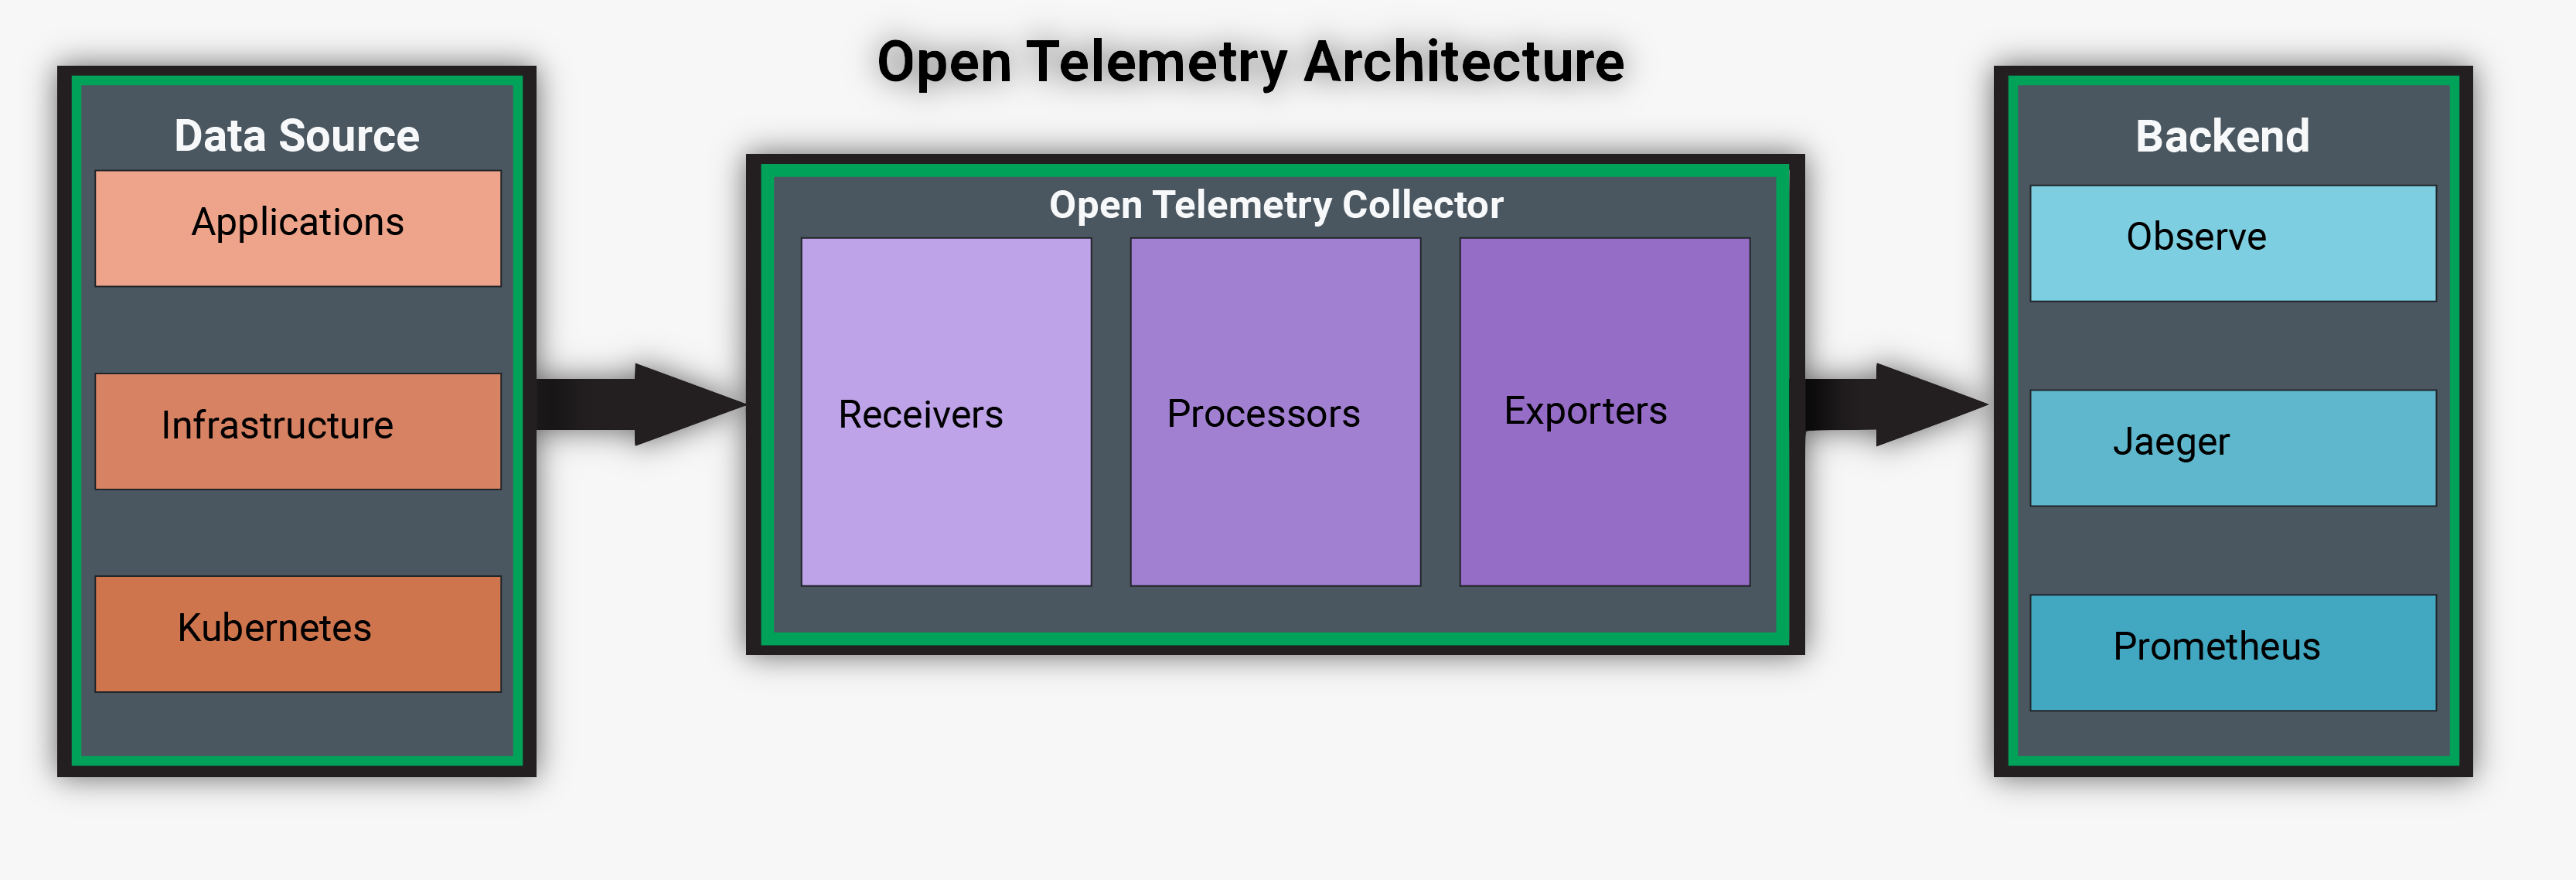
OpenTelemetry is an open-source project created in 2019 by combining the OpenCensus and OpenTracing projects. The primary goal of the OpenTelemetry project is to provide a set of standardized vendor-agnostic SDKs, APIs, and tools for generating, collecting, and forwarding telemetry data from cloud-native software to an Observability backend—like Observe.
While OpenTelemetry allows users can collect data from logs, metrics, and traces, its most common use case is for analyzing and understanding application performance and behavior using distributed tracing. For more about OpenTelemetry distributed tracing, see the OpenTelemetry documentation.
Note: Currently, the Observe OpenTelemetry App only supports traces. Since OpenTelemetry logging is still under active development by the Cloud Native Computing Foundation (CNCF), ingest log data using another method, such as the Observe Kubernetes app.
Let’s now look at how Observe’s Telemetry App simplifies collecting, analyzing, and alerting on data from OpenTelemetry.
Application Insights At Your Fingertips
Getting Data in
We’re firm believers in OpenTelemetry’s vision of commodity vendor-neutral data collection, and because of that getting your OTel data into Observe’s Data Lake couldn’t be easier. All you have to do is install the App, and then configure the OpenTelemetry collector to export data to Observe.
Note: If you’re already using the Kubernetes integration, the OTel collector comes pre-installed and we handle all the configuration for you.
At-a-glance Insights
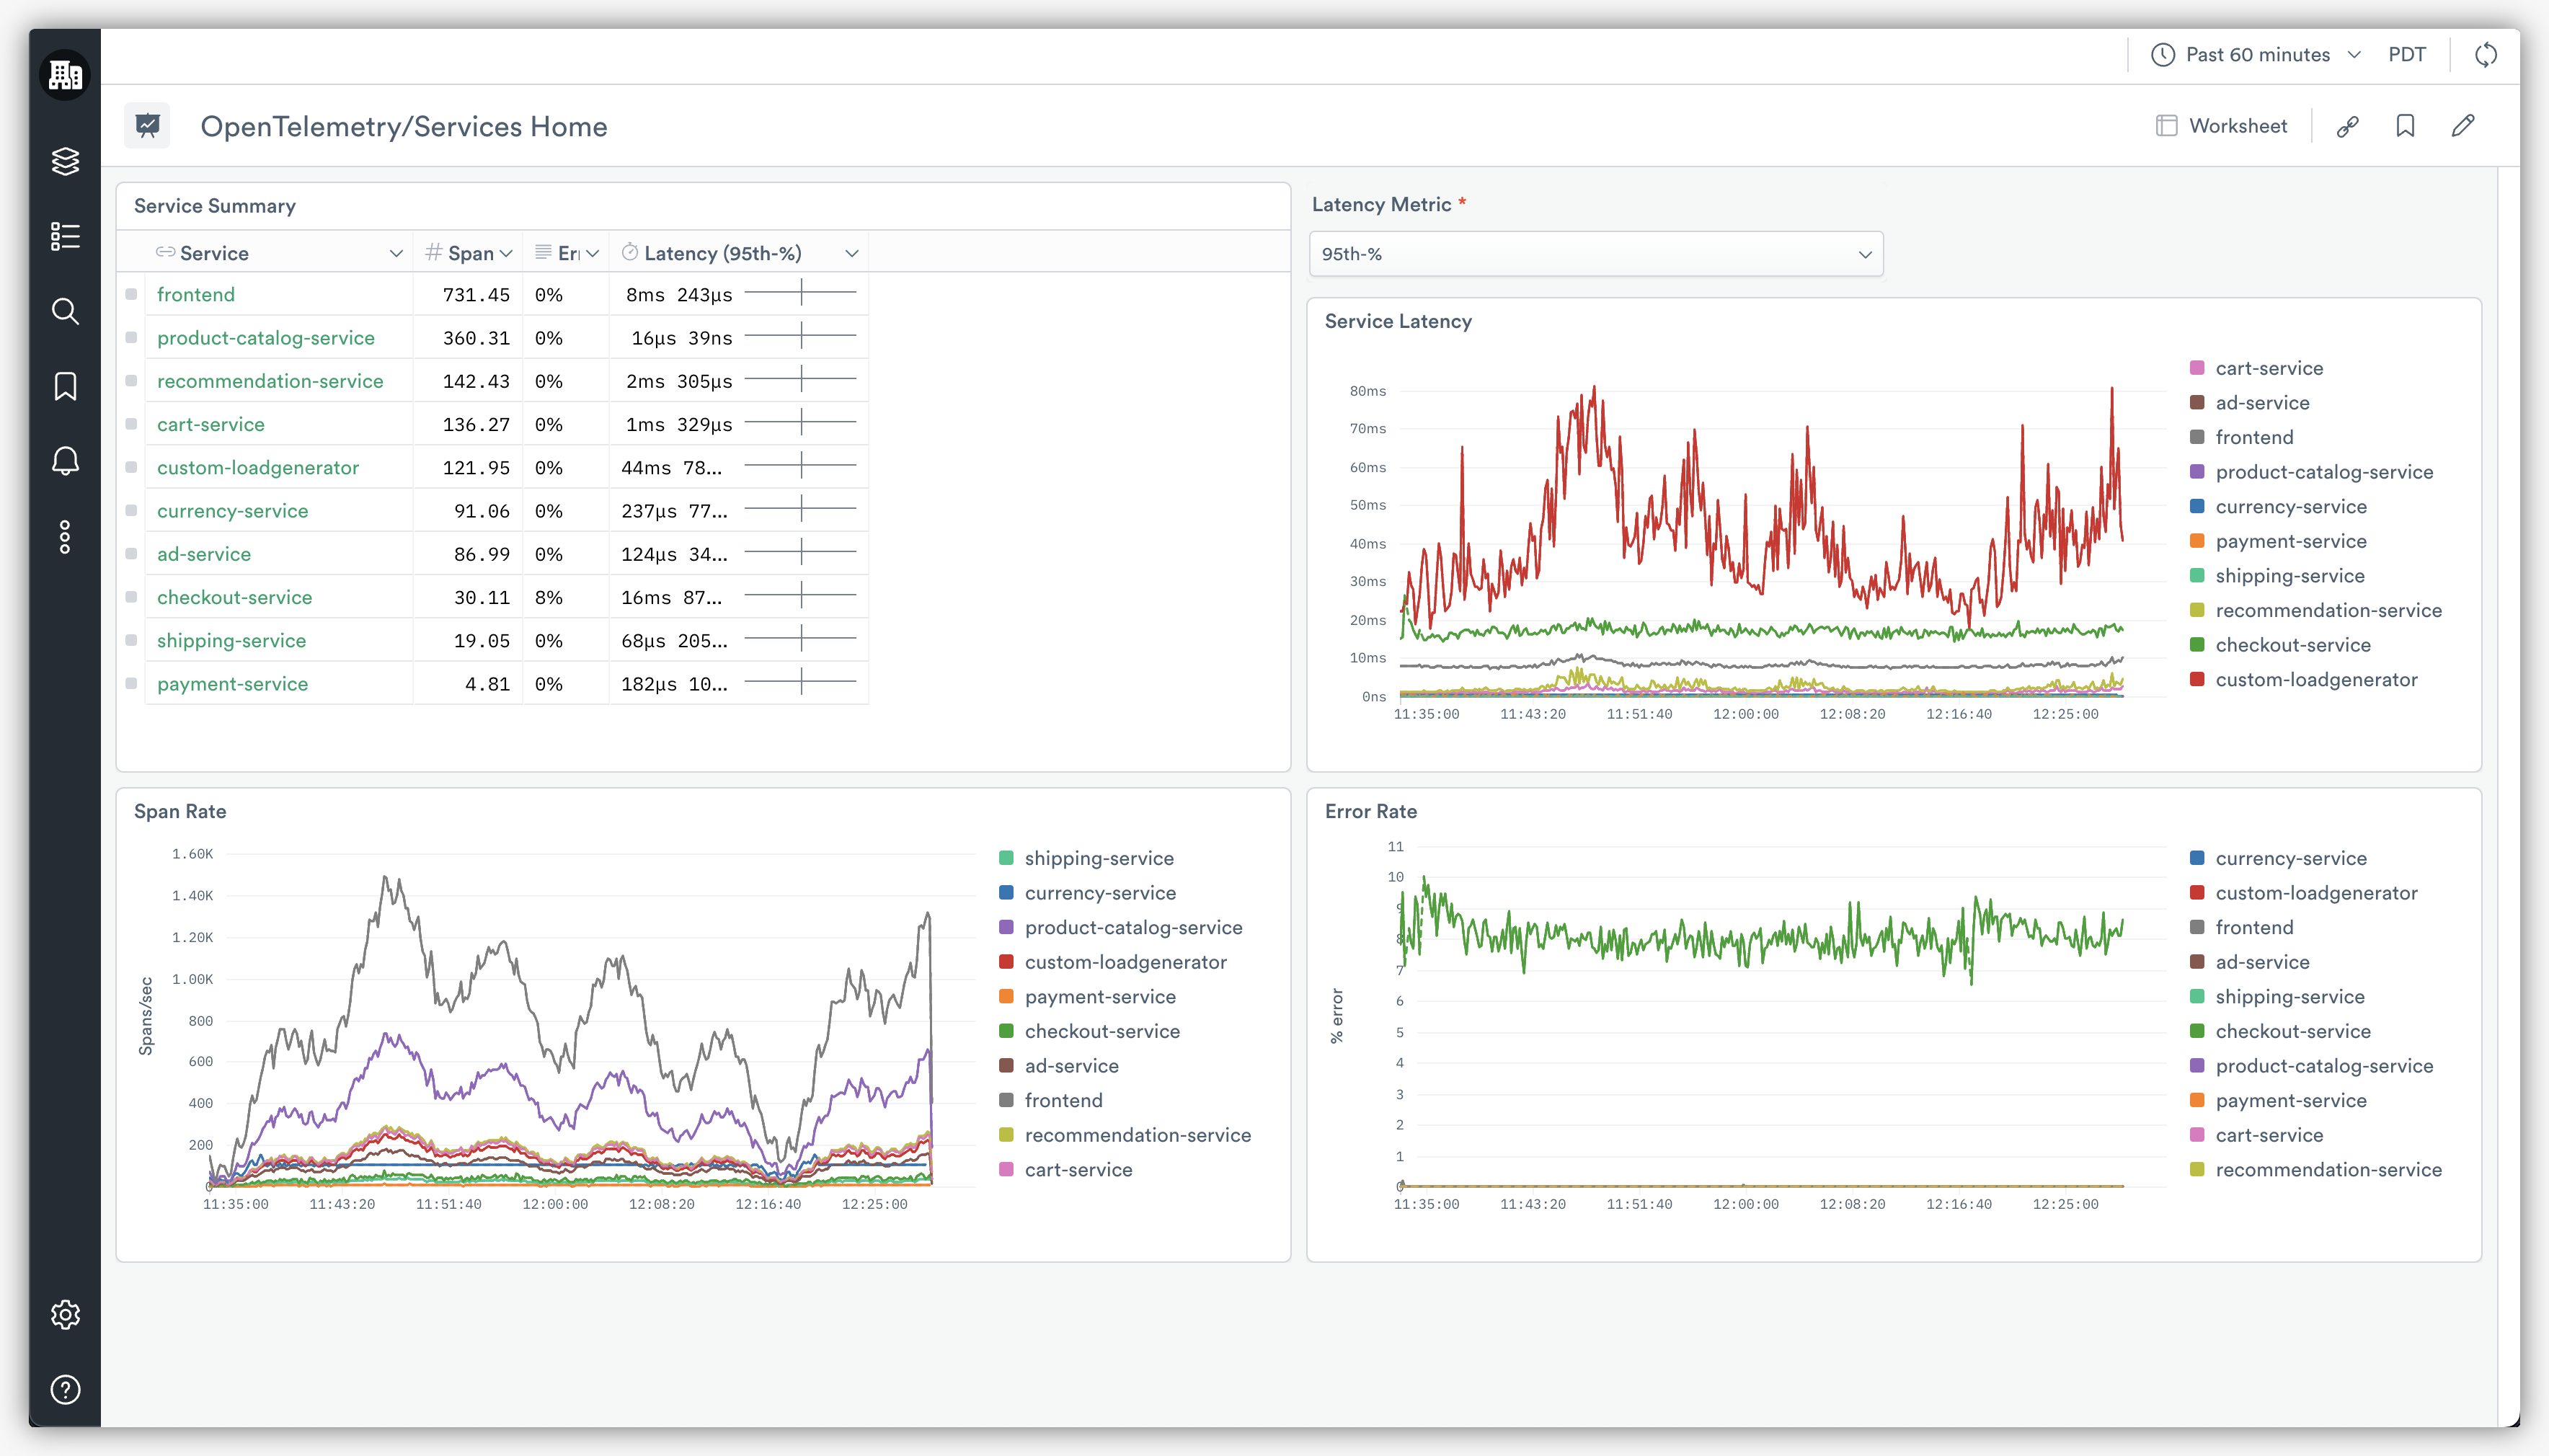
Once that data is in the Observe, you can use any of the five included Dashboards—like Services Home, Service Inspector, or Operations Inspector—to visually explore dependencies between various microservices, and answer questions like, “Which microservices are slowing down my App?”, or “What microservices have a high error rate, and what are those errors?“
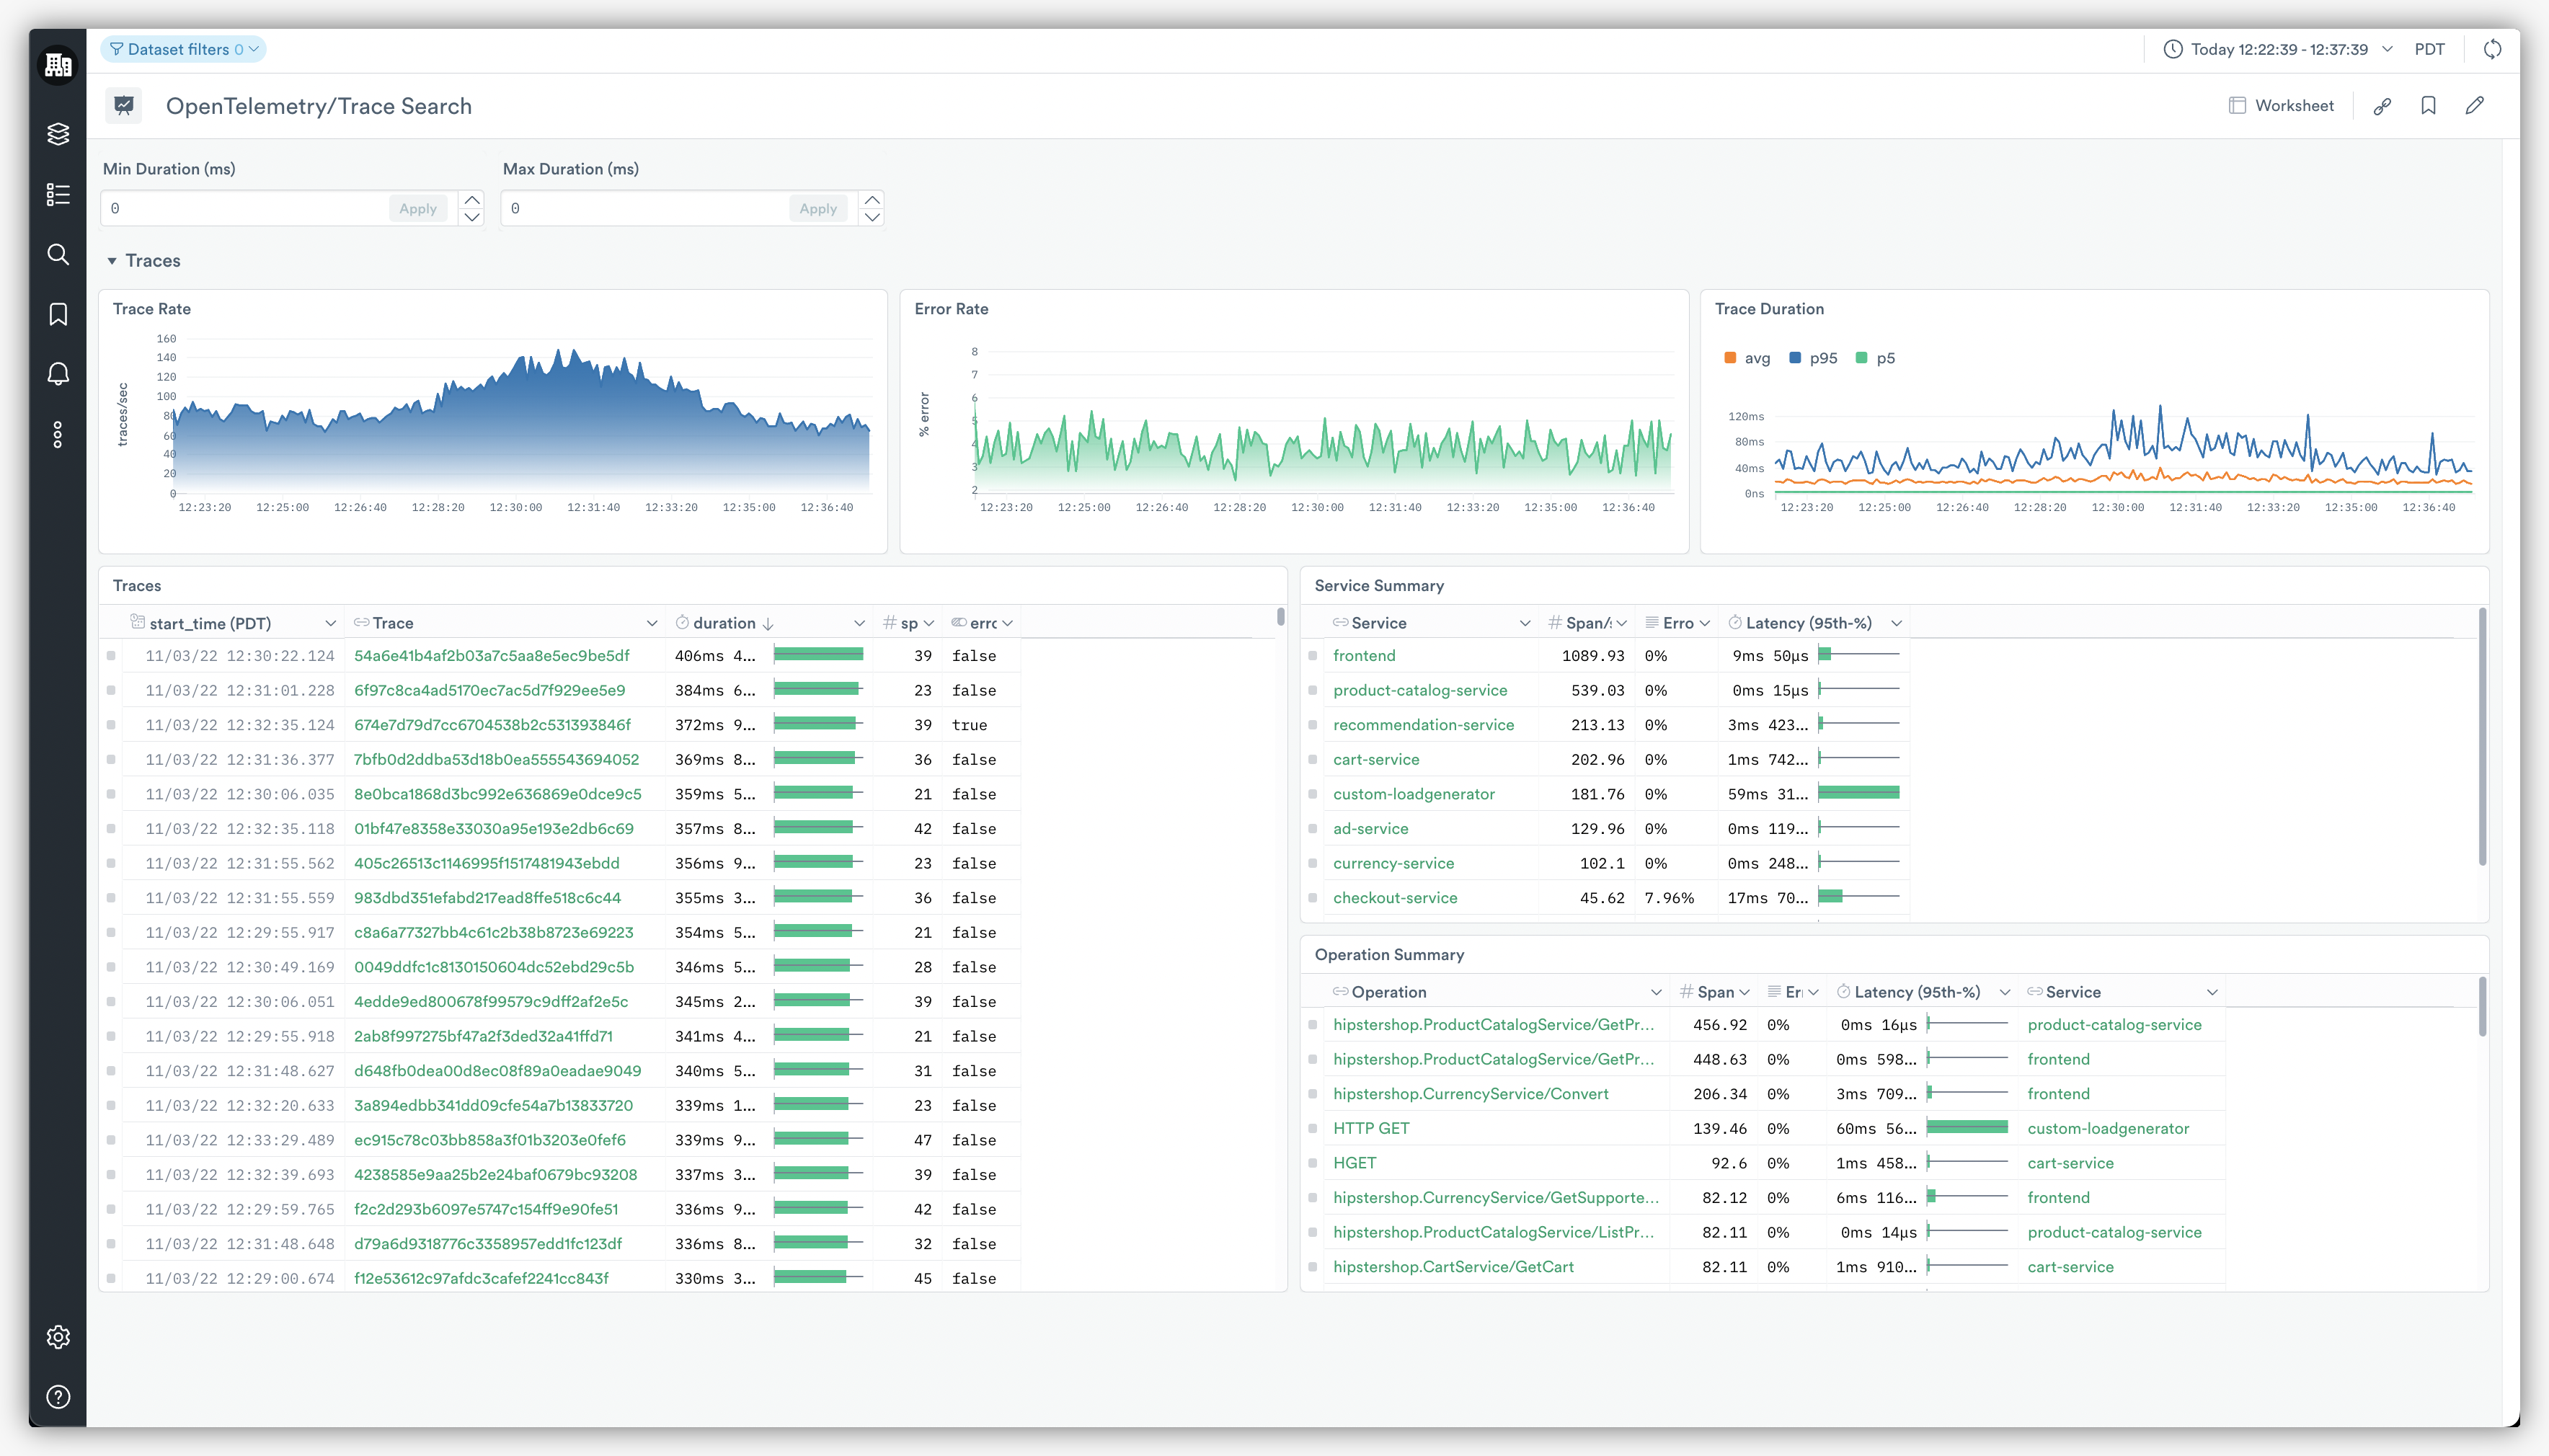
Or, if you’re in troubleshooting mode, you can use the Trace Search Dashboard (below) to easily spot problematic traces to help you quickly diagnose issues with services. From here you can sort traces by duration (in ms) or by traces with particular values—such as those with errors.
Wanna go deeper? Click on any trace in the Trace Search Dashboard to open the Trace Inspector and see a waterfall diagram that shows the parent-child relationship between a root span and its child spans. From there, you can click on a span to show additional detail at the span level like the span_id, parent_span_id, child_spans, the operation that spawned it, and much more to help you quickly diagnose errors in your application.
In addition, check out the Trace Summary (above the waterfall) to see details like a timestamp, trace_id, duration, and more, or the Spans and Events table (at the bottom of the Trace Inspector Dashboard) to inspect errors, associated services, operations, and more from each span.
Deep Dive Into Your OTel Data
Dashboards are convenient, but sometimes you need to dig deep into the data. The OpenTelemetry App from Observe contains five Datasets—Operation, Service, Span, Trace, and Span Event—to let you do just that. These Datasets are the building blocks and data that drive the Dashboards you see, and are often where you land when clicking a link in a Dashboard.
You can use these Datasets for advanced analysis when troubleshooting or debugging your application, to create your own custom Dashboards, or use them to drive meaningful alerts from any part of your application.
Better Together
The best part is that we treat tracing data like any other data in Observe. This means that you can use the Data Graph—a graph of connected Datasets curated from the Data Lake—to refine and link your OpenTelemetry Datasets to any other log, metric, or resource data in Observe. What this means for your out-of-the-box experience, is that your OpenTelemetry data can be linked easily to other apps and services, you use in Observe like Kubernetes, AWS, and Host Monitoring to help you easily correlate application issues with infrastructure issues
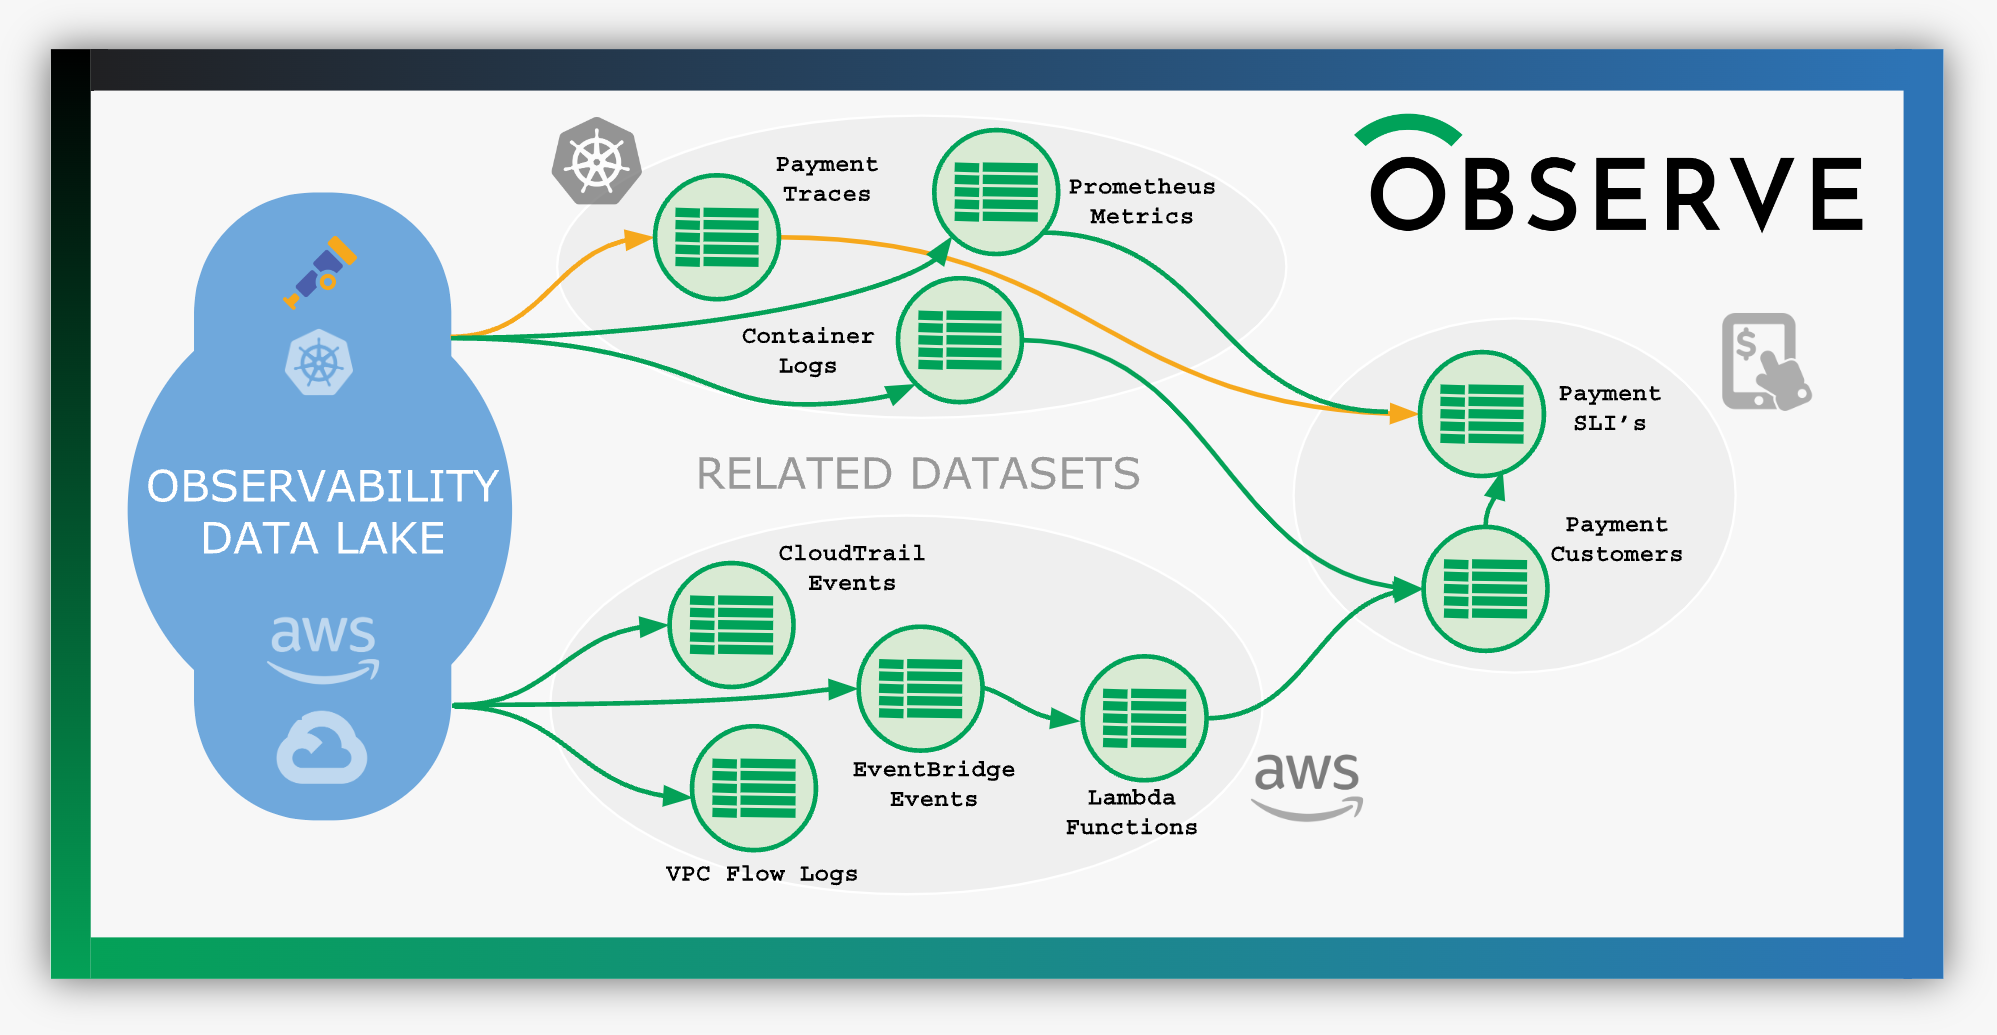
But this is just the start of what you can do with this data. Using the Data Graph, you can combine traces from OTel with other data, like customer transactions and service uptime, to ensure you meet key business objectives and avoid painful experiences that can cause customers to leave your platform.
Or, combine it with your CI\CD logs and various host-level metrics to discover which developer introduced a memory leak—and when—for a complete audit trail of your entire software development process.
Pricing That Scales
Lastly, thanks to our unique usage-based pricing, you don’t have to worry about having to choose which telemetry to send to Observe or the tedious task of sampling. Simply send all of your traces, metrics, and logs to Observe where we compress your data by 10x and then store it, behind the scenes, in Amazon S3 for 13 months. This means no more hard decisions about what data to keep and for how long. You only pay for the data you store at S3 costs, and then when you query it.
Getting Started With the OpenTelemetry App
We simply don’t have enough time to cover all the use cases and what’s possible with the new OpenTelemetry App, so please visit the OpenTelemetry App page in our docs for further details about what Dashboards and Datasets are included and how this App can help you effectively troubleshoot your applications performance.
Be sure to check out the ever-growing list of Data Apps and integrations we provide to help make observability even easier from many of the popular services you already rely on.
If you’re not already an Observe customer, but want a seamless way to integrate your tracing telemetry with the rest of your observability data, click here to get access today!