What’s New: Observe Apps!
 By Knox LivelyJuly 12, 2022
The ease of installing and configuring Observe Apps, coupled with its usage-based pricing means users can put down their crystal ball, and stop guessing what data they’ll need in the future. Ingest everything today, and analyze it tomorrow.
Observability, A Click Away
Last month we let the world know what we’ve been up to since our previous launch, and part of that exciting news is the launch of Observe Apps!
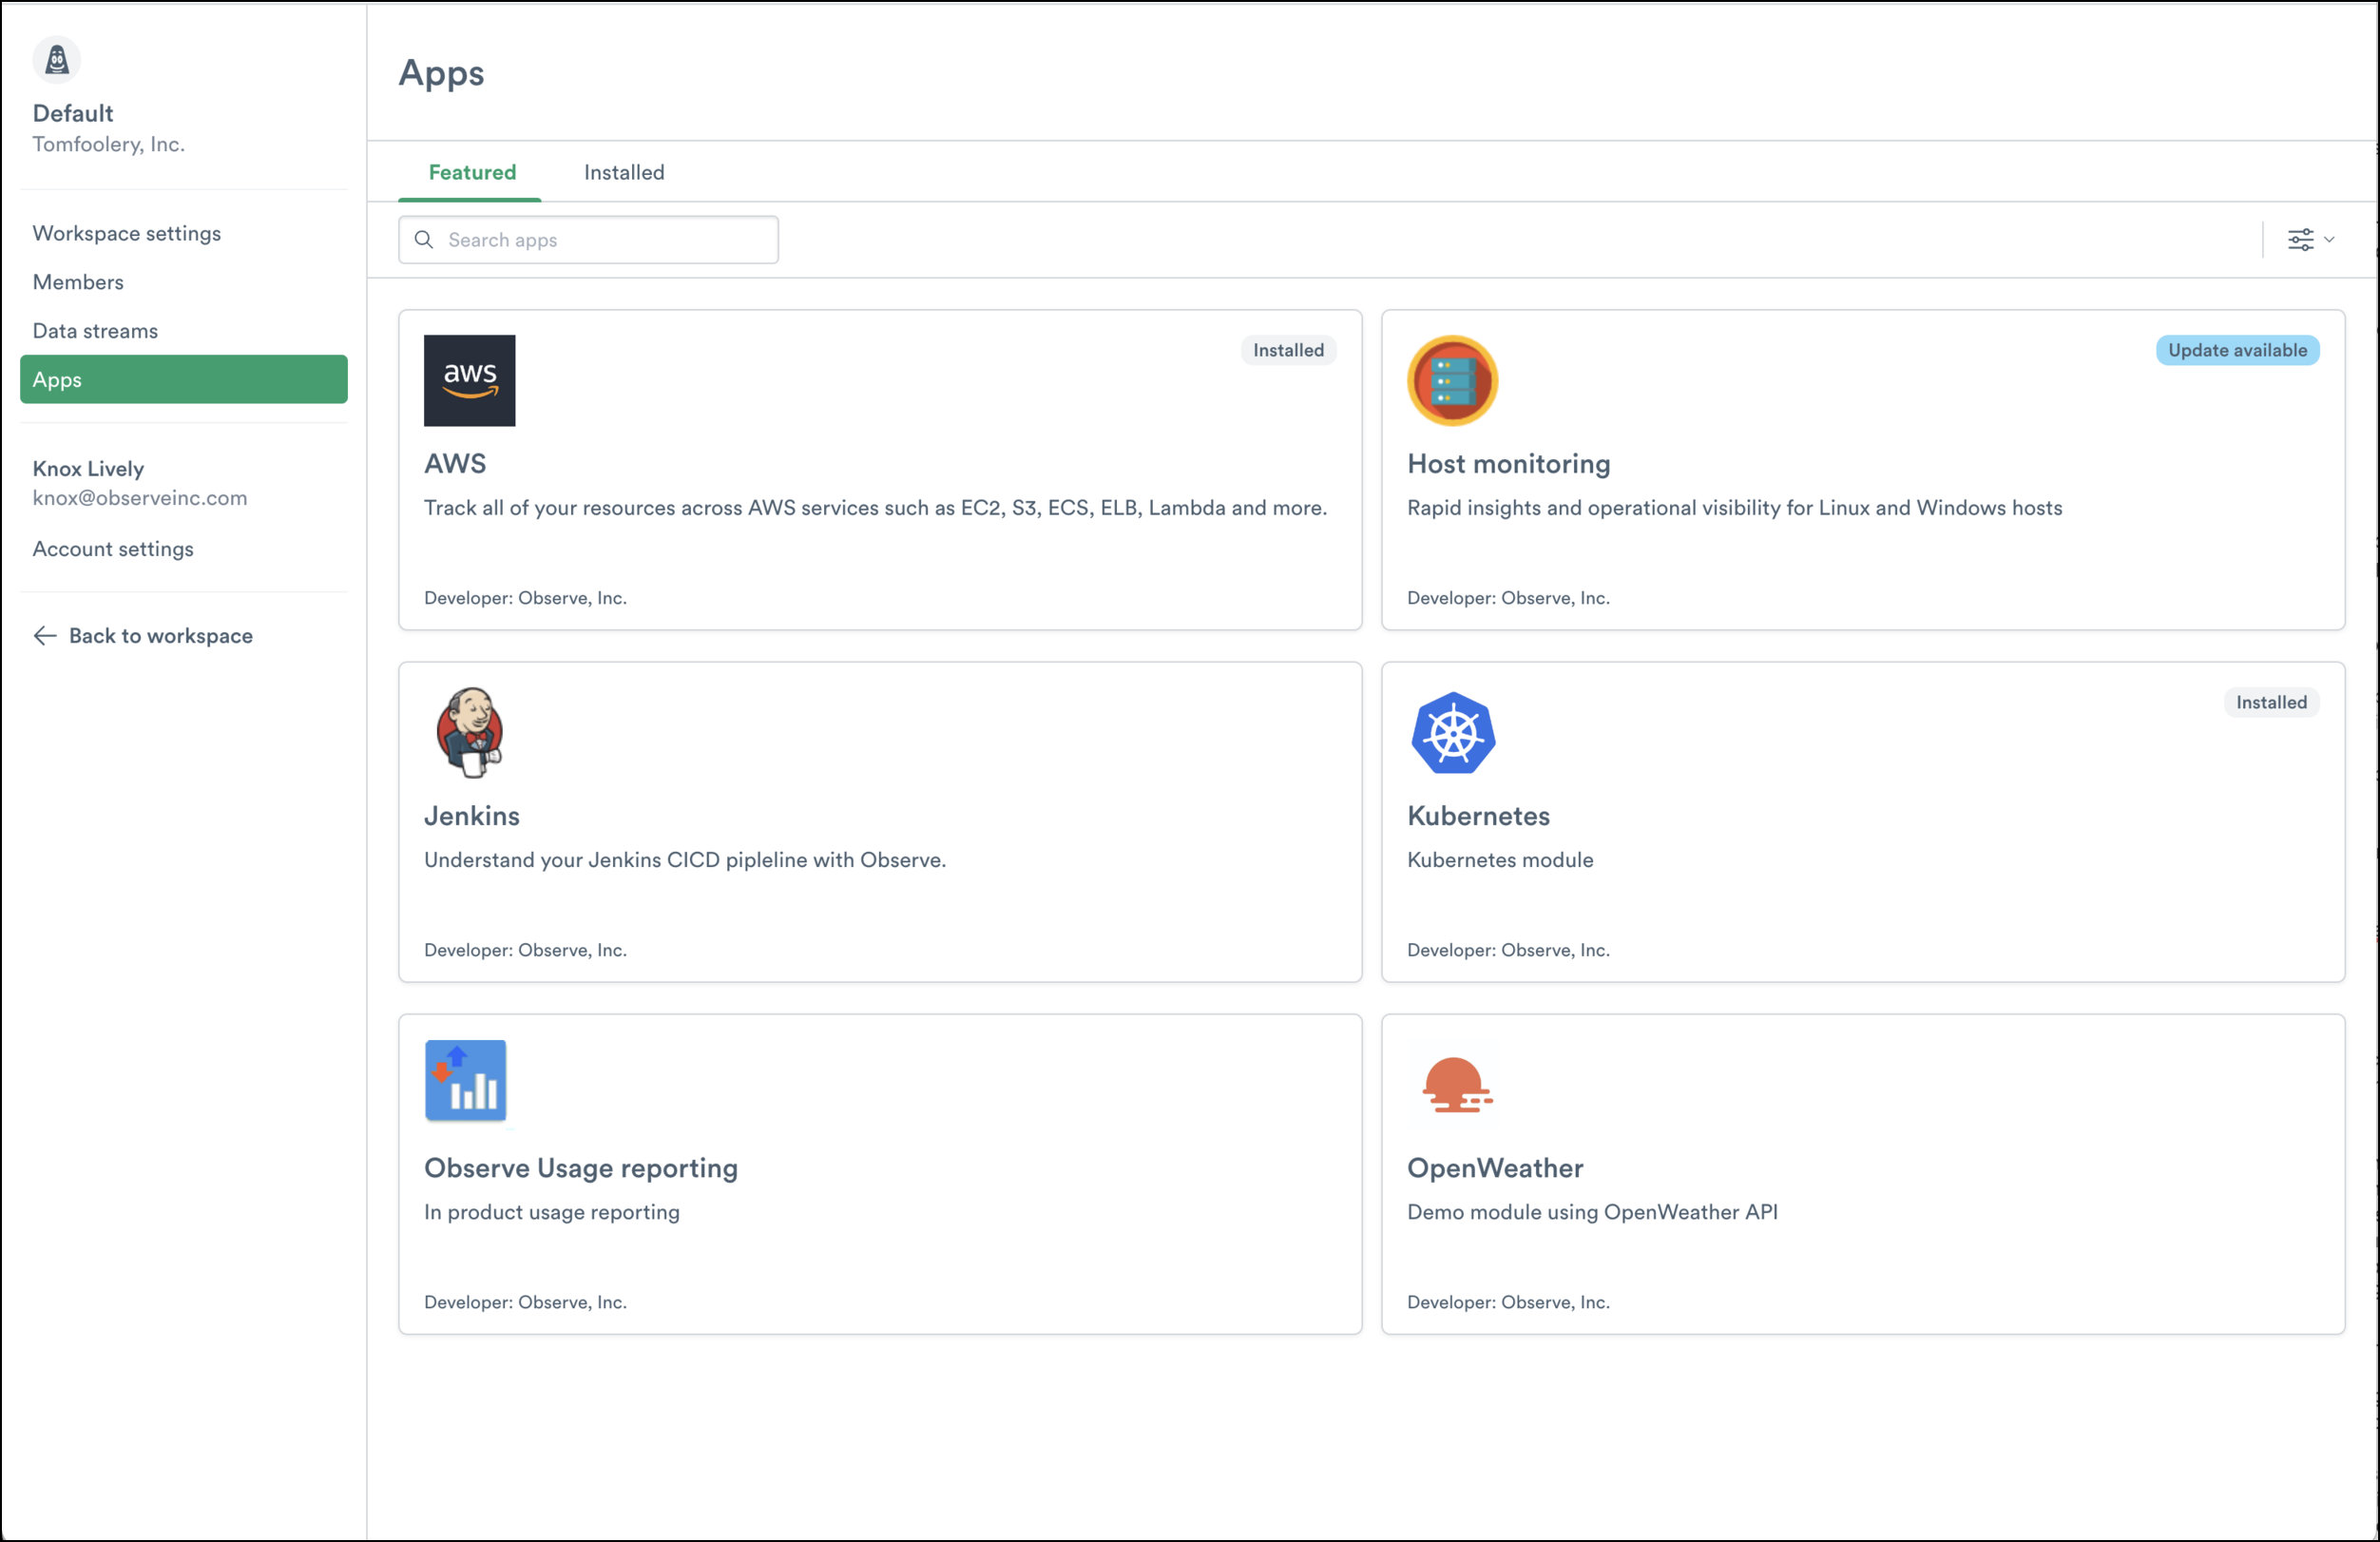
Observe Apps provides users with an App Store-like experience with an intuitive UI for installing and configuring out-of-the-box integrations. In addition to helping users ingest data from their favorite services, Observe Apps curates this data into useful information, dashboards to provide quick at-a-glance insights, and monitors to inform users of critical conditions about the things they care about out of the box.
And thanks to Observe’s natural ability to track the state and relationship of these “things” over time, when users combine this data with other – seemingly disparate – sources in Observe, users can ask big questions about their environment and the “things” that make it up.
Questions like, “How were my customers impacted by the latest push to production?, or “Is my Kubernetes cluster healthy?”, are now possible to answer without spending countless hours indexing data, digging through log lines, or concocting useless dashboards.
Let’s take a look at some of the Apps that are available now, as well as ones on the way!
Note: Here is a full list of available integrations (including Observe apps).
AWS
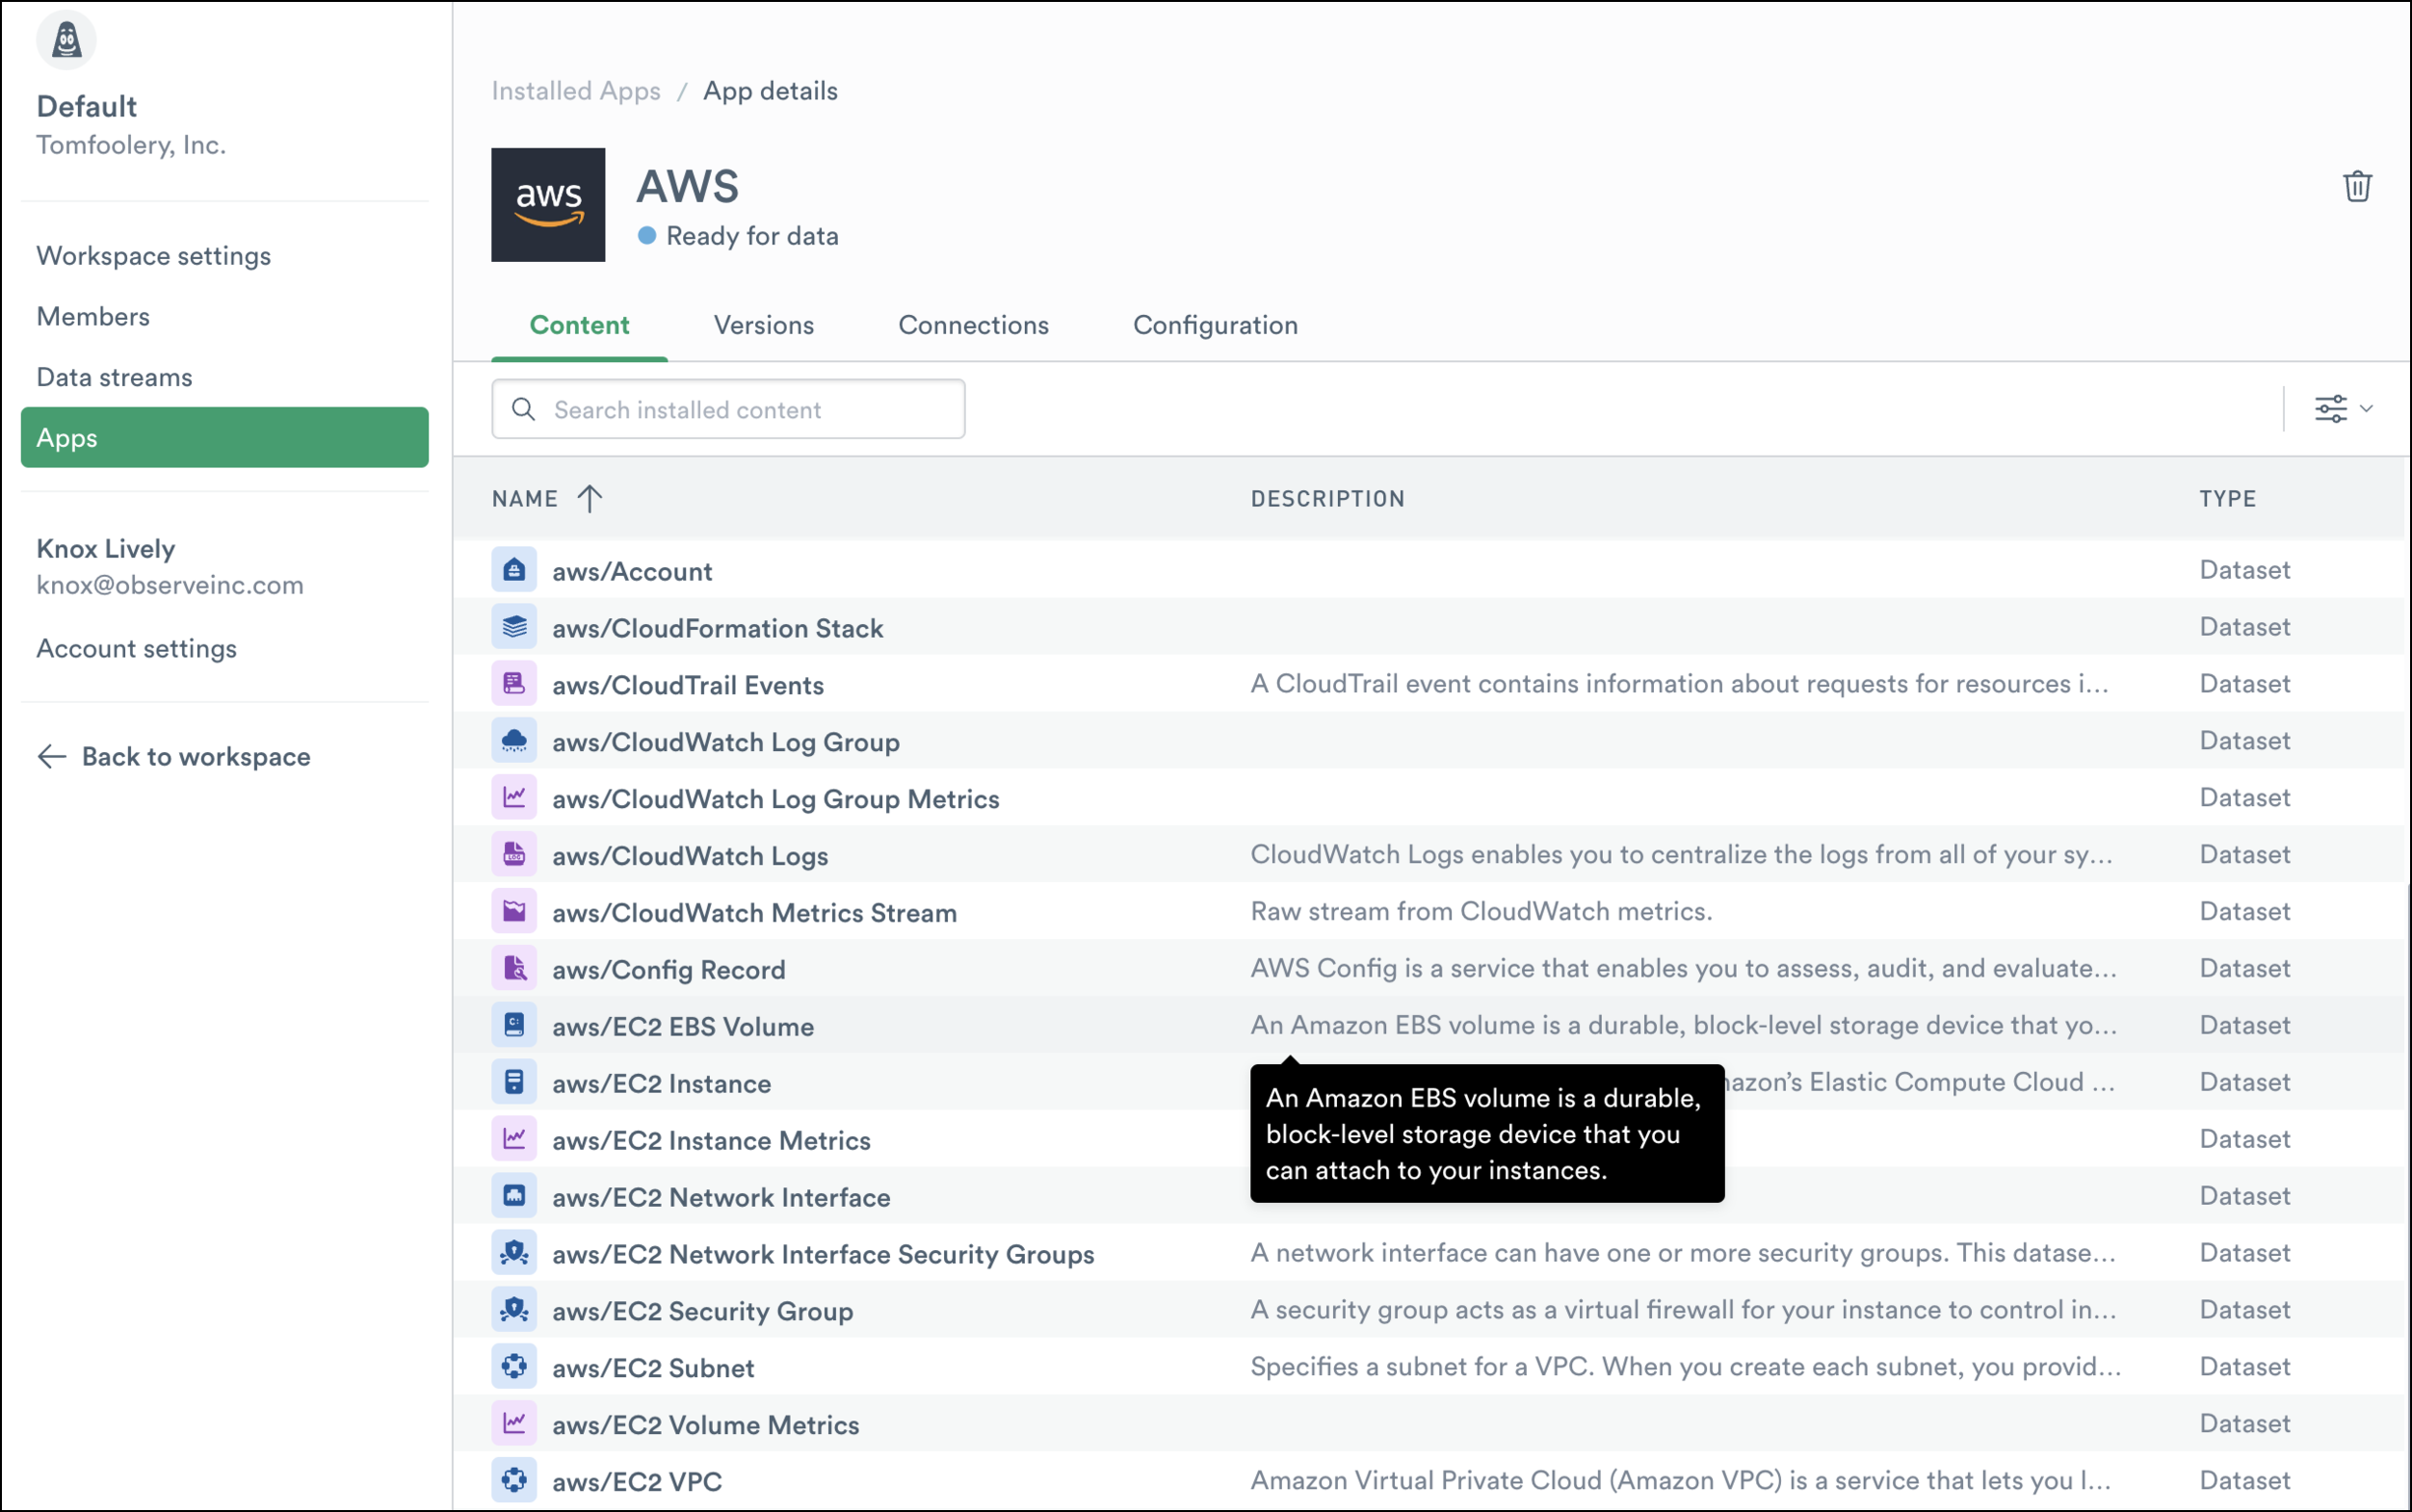
The Observe AWS App streamlines the process of collecting telemetry from dozens of AWS services while making them more discoverable. With this app, you can now easily monitor and troubleshoot many of your favorite AWS services in Observe, which means less time troubleshooting and more time building applications and services for your customers.
When combined with other powerful features like GraphLink – which lets users visually see connections between datasets – Observe Apps allows users to troubleshoot complex issues from across all of their AWS accounts in one tool.
What are some things users can do with this data?
- Combine CloudTrail Events with Observe’s natural ability to show how resources change over time to get a full picture of what’s changed in your environment, who changed it, and when it changed.
- Connect VPC Flow logs to Kubernetes Pods, EC2 instances, or similar, to get a detailed view of where network traffic originates and where it is heading in your environment.
- Track API Gateway deployments and performance characteristics over time.
Kubernetes
Monitoring Kubernetes workloads have traditionally been tricky due to its distributed and temporal nature, but the Observe Kubernetes App was designed to help alleviate all the headache of deciding what to monitor when it comes to containerized workloads.
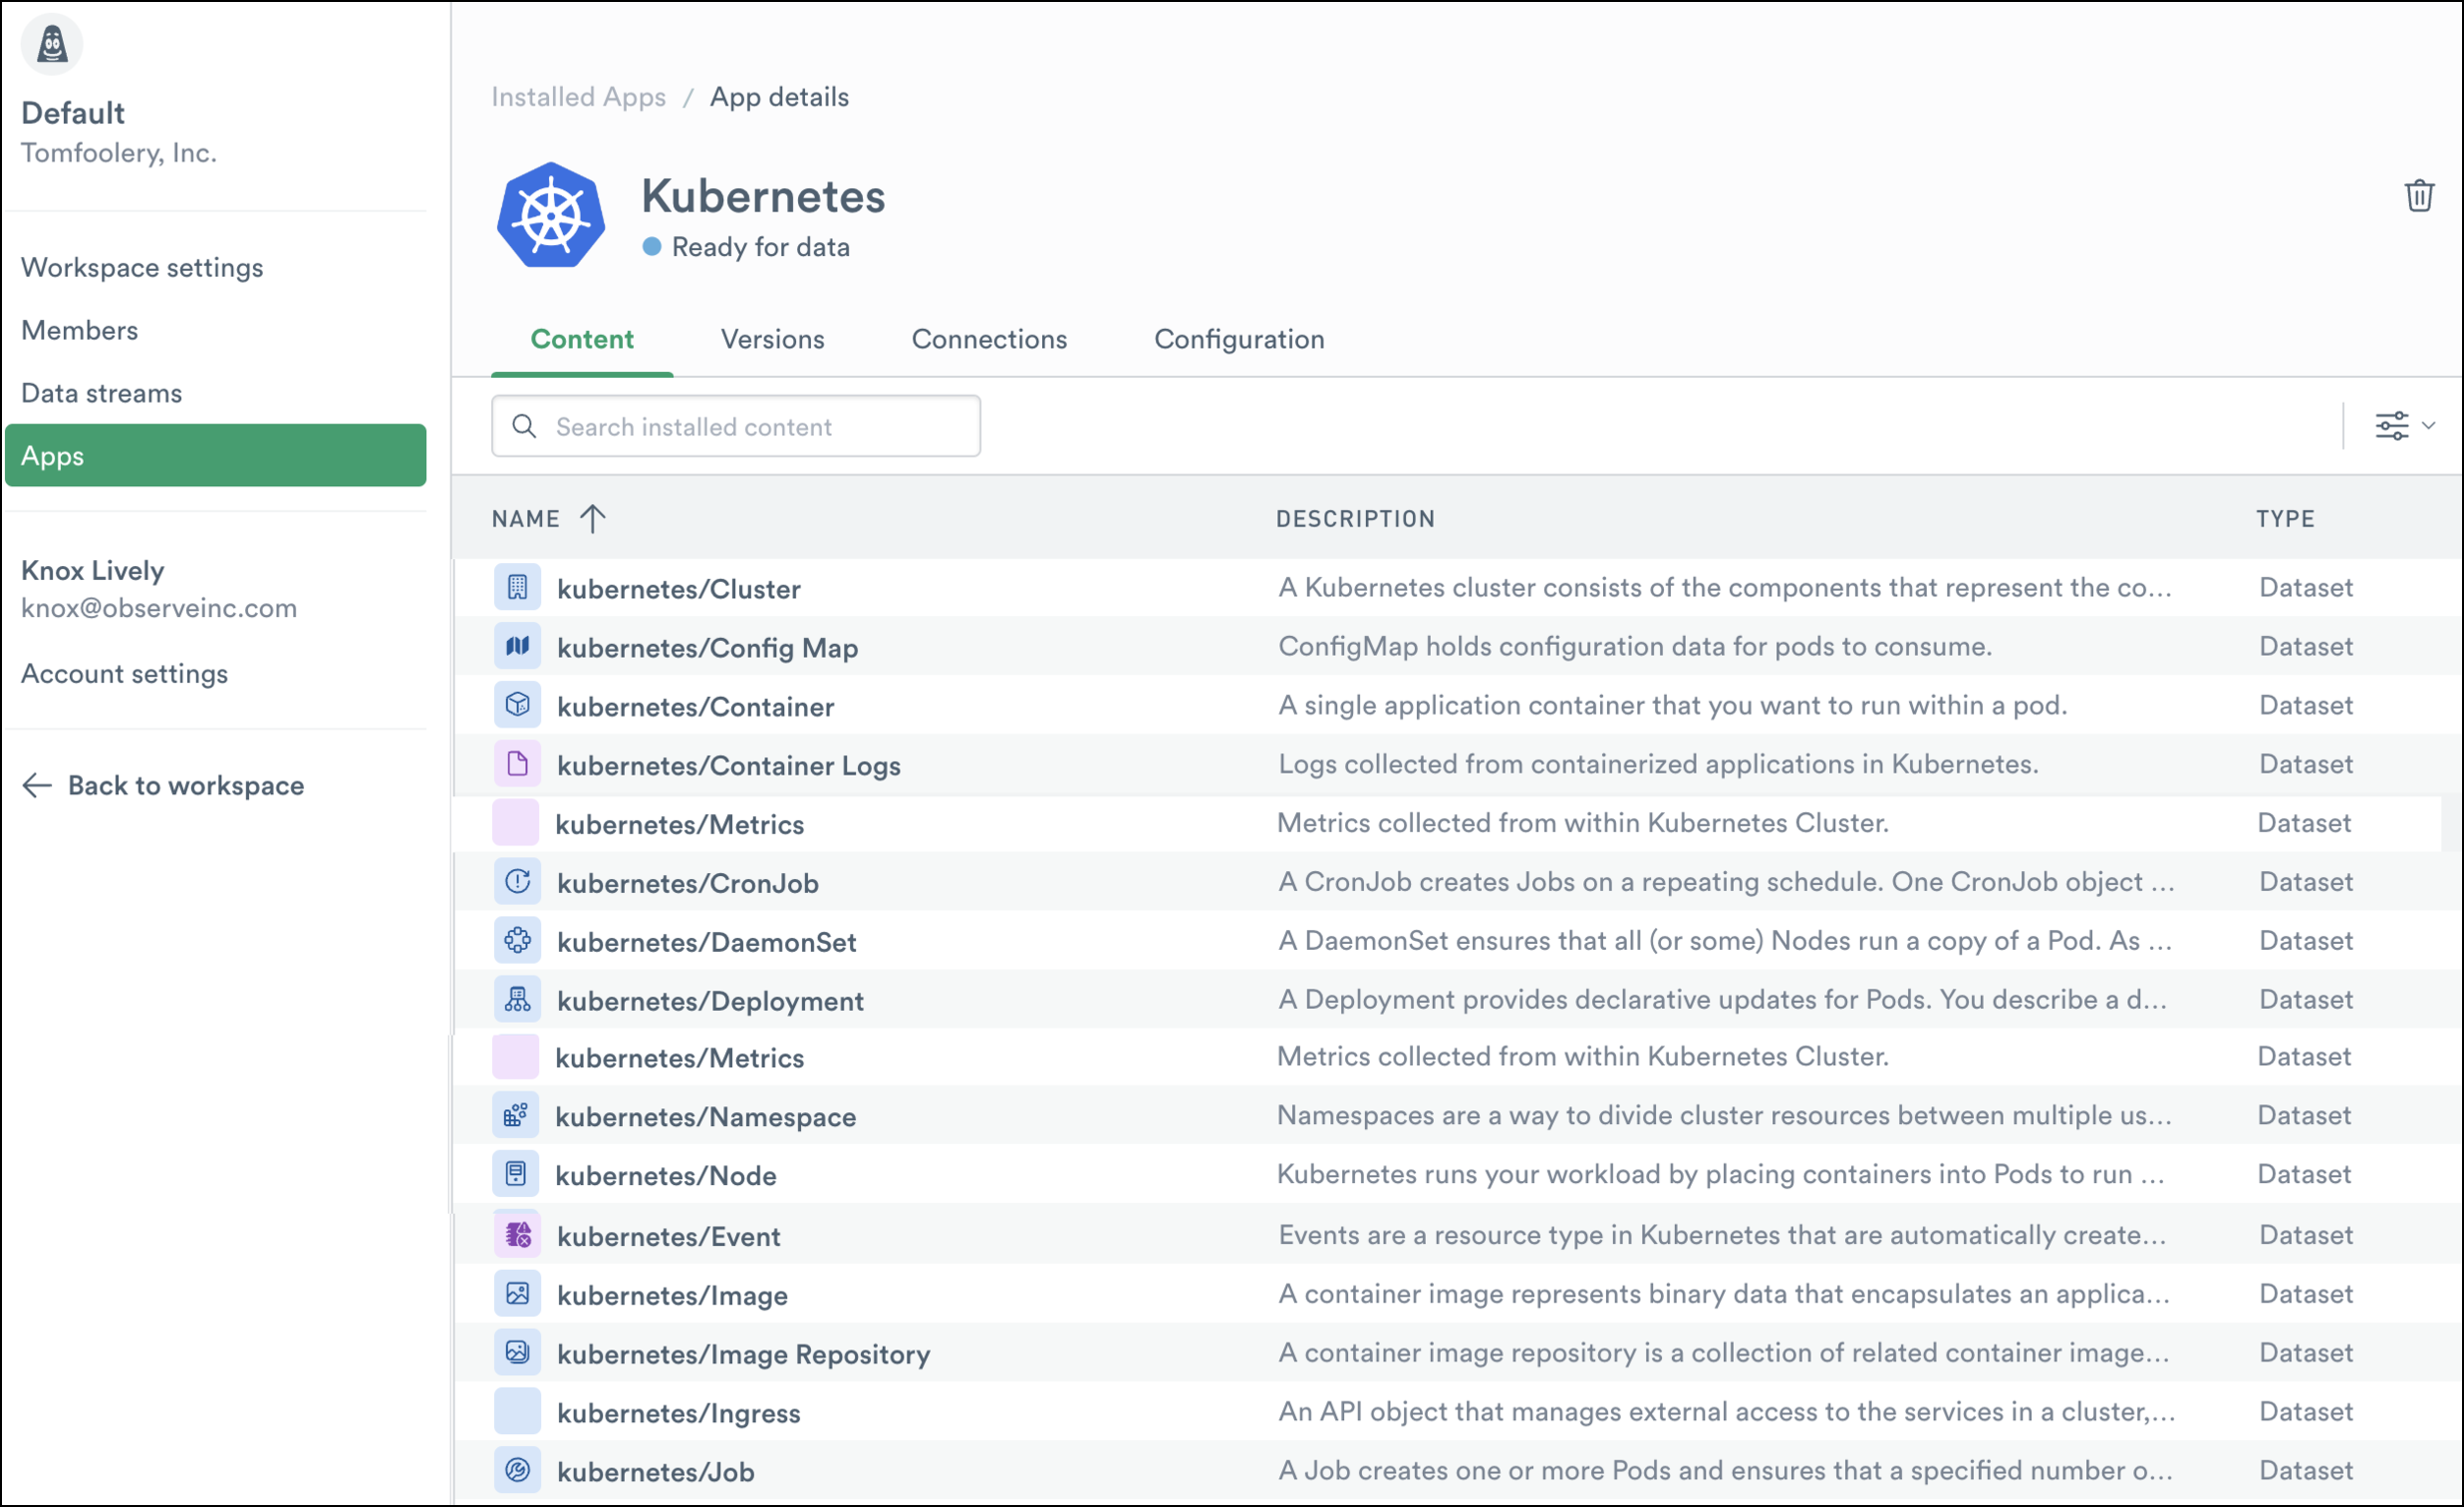
The Observe Kubernetes App helps you collect various telemetry (Logs, Metrics, Events, etc.) from Kubernetes clusters and import it directly into Observe. Whether you’re looking to gain new insights from your cluster data, or you’re simply collecting data for auditing and compliance purposes, this integration provides you with the context and visibility you need to get the most out of your Kubernetes observability data.
And because Observe maintains a complete changelog of all events in your cluster, you can easily reconstruct the state of your environment from any point in time. There’s no need to manually wade through historical log data to understand the past. Observe keeps track of the past for you, while at the same time providing real-time visibility into the present.
What are some things users can do with this data?
- Link Container Logs to your CI\CD logs to see exactly which commit introduced a memory leak in your application or broke your production environment.
- Answer questions like, “Is my cluster healthy?”, or “Should we add more nodes after deploying the latest feature?”
- Get notifications on failed deployments, Pods stuck in a restart loop, or any other of the hundreds of metrics collected from your Kubernetes cluster.
Host Monitoring
The Observe Host Monitoring App provides users with all the tools they need for essential monitoring of both Linux and Windows hosts. In particular, this App is geared toward monitoring more traditional infrastructure that is not managed by an orchestration tool or framework such as bastion hosts, build servers, or similar.
This App provides a suite of datasets and dashboards comprised of valuable metrics, logs, metadata, and preconfigured alerts to assist you with troubleshooting issues in their environment(s).
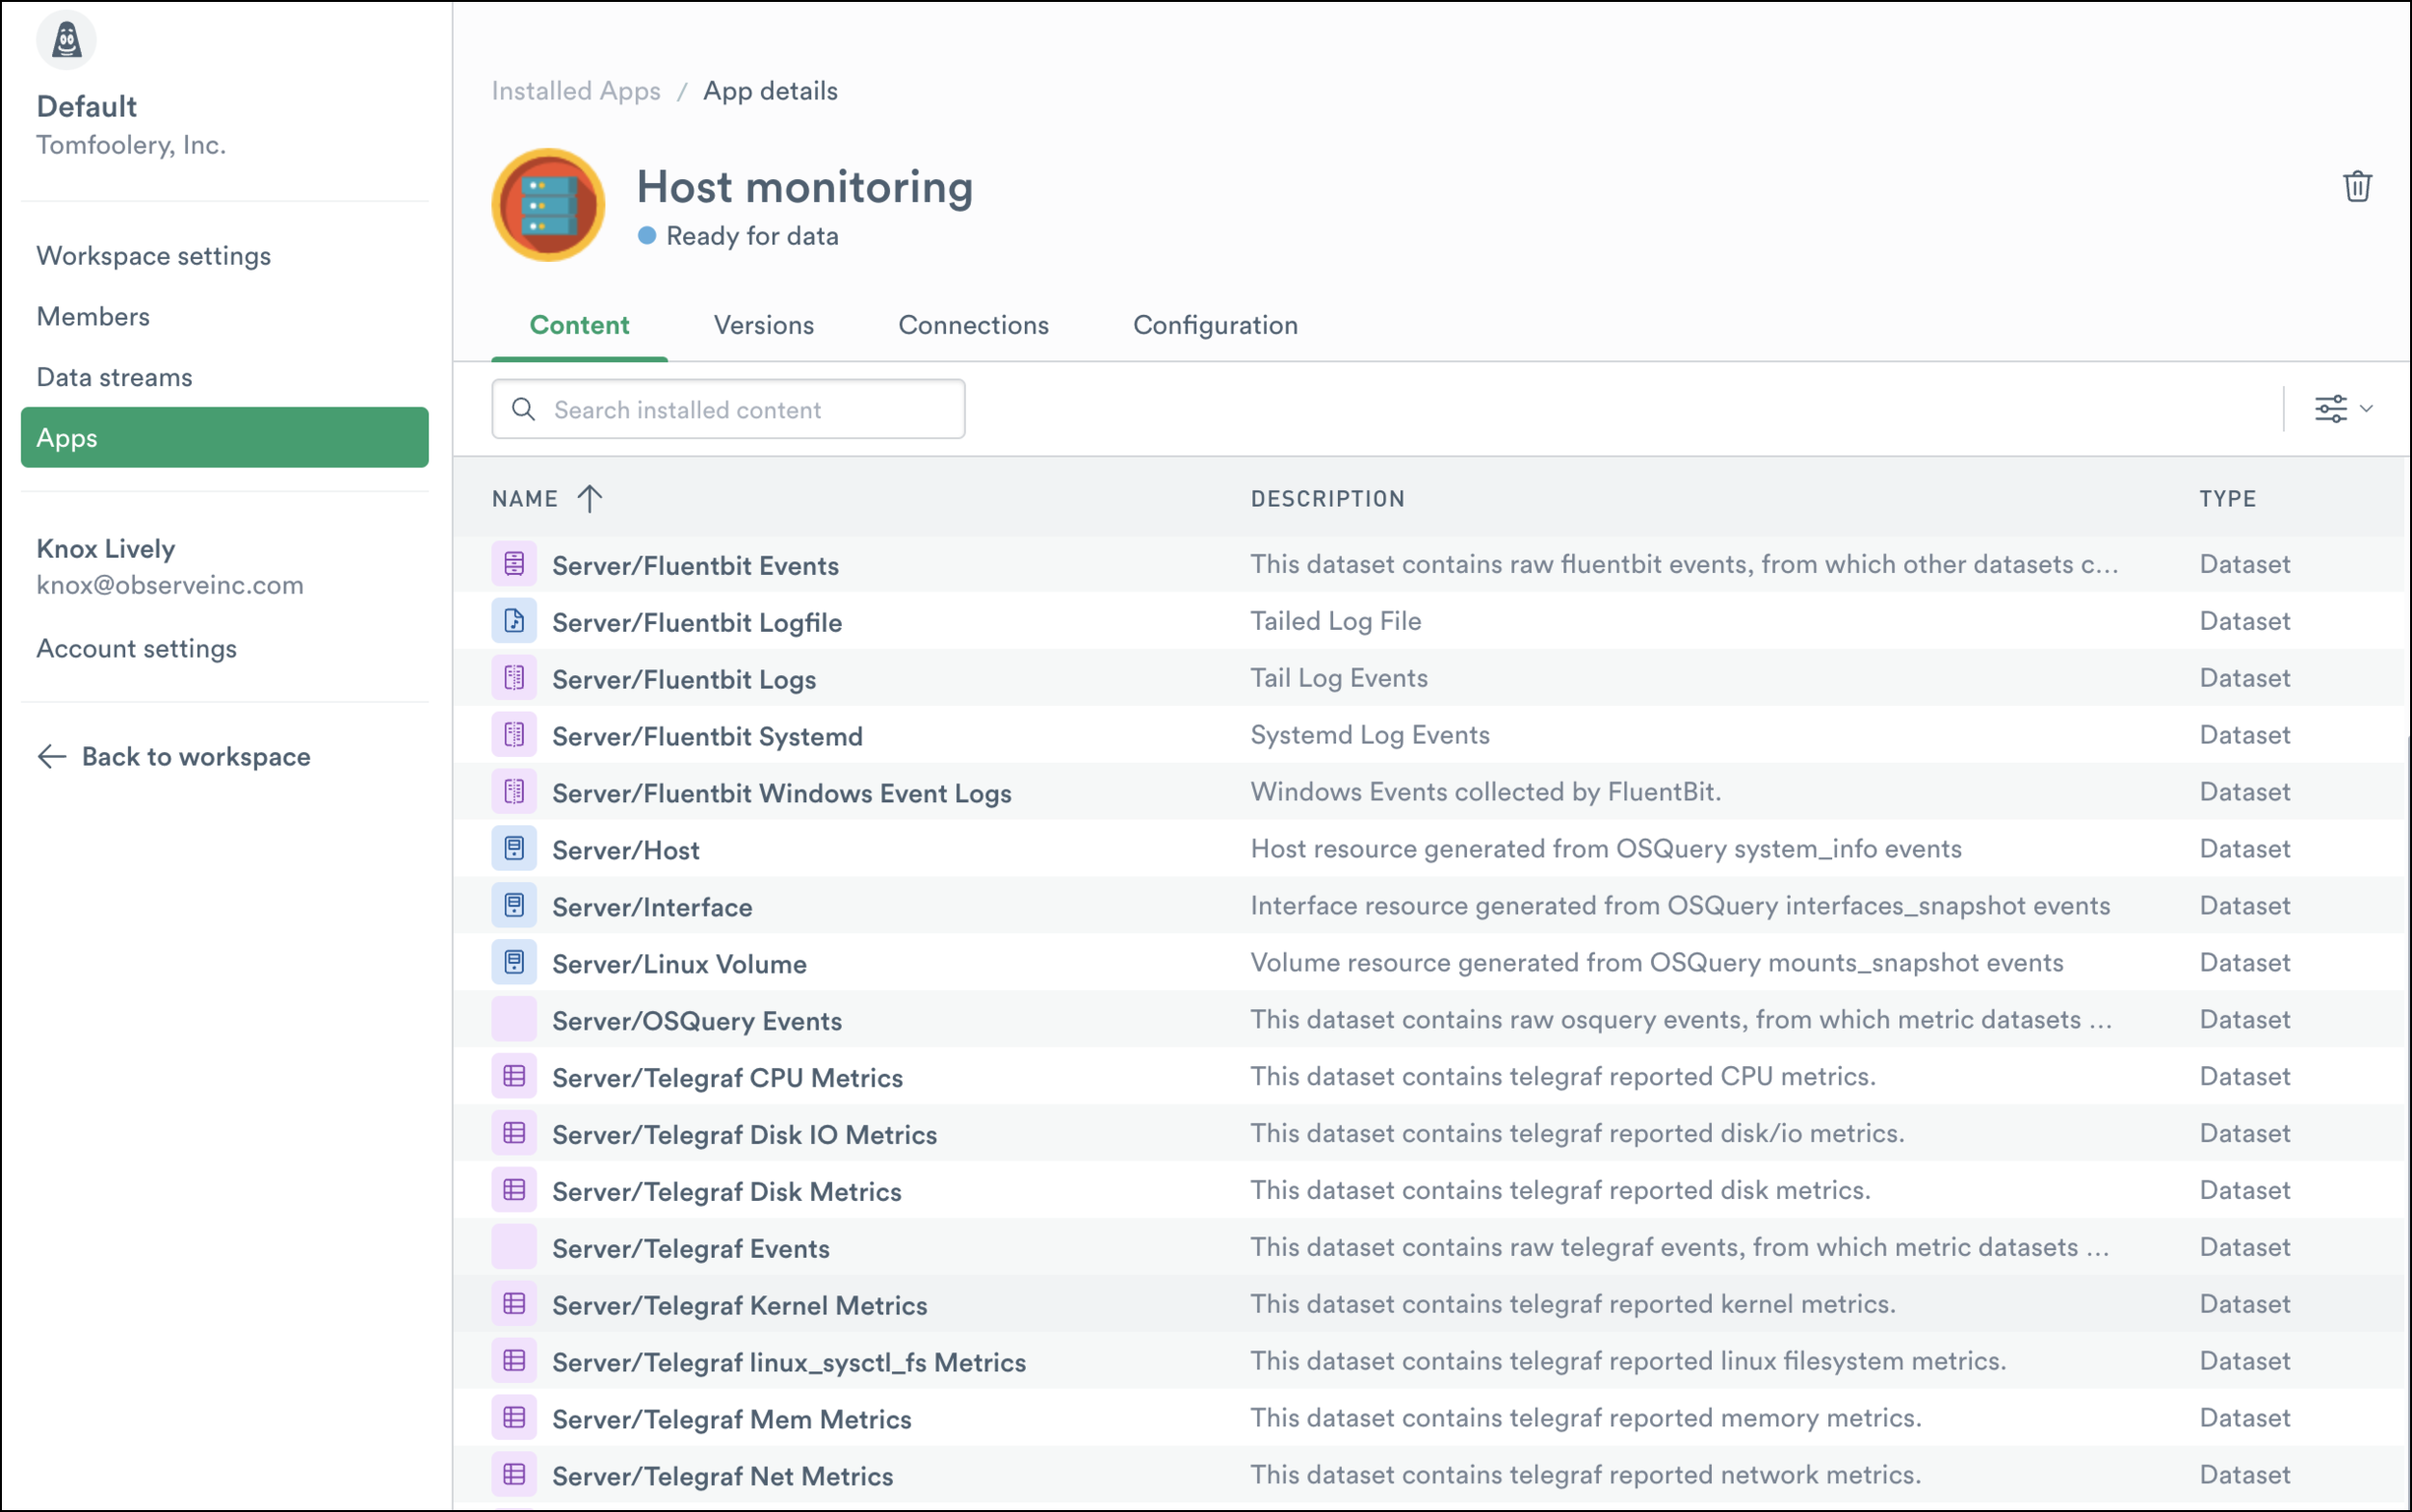
With the Observe Host Monitoring App, you can expect to find various system-level data flowing into Observe like system logs, system properties, user information, shell history, as well as metrics for various subcomponents, such as CPUs, system processes, disk I/O, etc.
What are some things you can do with this data?
- Streamline your CI/CD pipeline by linking build logs with metrics like CPU utilization, disk usage, and memory usage to find bottlenecks in your build process.
- Gain full visibility into the impact your resources have on customers by connecting various system metrics with application logs or even customer tickets.
- Deep dive into your network transfer costs by linking your AWS transfer costs data to the Hosts Dataset, and ultimately their interfaces.
How to Install Observe Apps
In just a few clicks users can add new integrations and watch the data start pouring in!
Installation Steps
Note: This feature is in Private Preview. Please reach out to your account team if you would like access.
- From the Getting Started page, click the Workspace icon in the upper left corner and select “Account Settings.”
- In the left sidebar select “Apps.”
- Under the “Featured” tab at the top, search for, or select the integration you intend to install.
- While on the App page, select the “Version” you wish to install and click “Install.”
- After a few moments, the installation will complete, and then depending on the App, you will be guided to the “Connections” or “Configurations” tab for further setup.
- Once you complete the configuration, the App is now completely installed and ready for use!
Everything Connected
The ease of installing and configuring Observe Apps, coupled with its usage-based pricing means users can put down their crystal ball, and stop guessing what data they’ll need in the future. Ingest everything today, and analyze it tomorrow.
Also, keep your eyes peeled because soon we’ll launch the Jenkins App, GitHub, and GitLab apps. And just a little further down the road, you can expect to see even more Apps like Google Cloud Platform (GCP), Azure, and so much more!
If you and your team are frustrated with managing multiple tools and correlating all your data by hand, then check out our demo or trial to see how Observe can give you back what’s most important – your time.