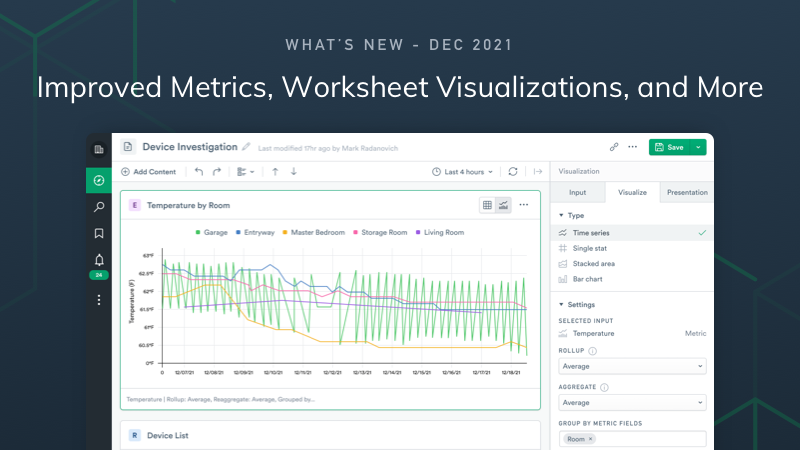
What’s New: Improved Metrics, Worksheet Visualizations, and More
 By Knox Lively,December 15, 2021
A little over a month ago we released an exciting update around our new feature Dataset Graph, which enables users to visually see relationships between their datasets. As exciting as that was, we still have plenty of other product updates we wanted to share!
Most of these updates are improvements on, or expansions of, existing features that we believe will make users’ lives easier when it comes to discovering, manipulating, and visualizing metrics.
Worksheet Visualizations
Worksheet visualizations were originally built before we had support for metrics or Resource Pages, and had many limitations. To better expose metrics we knew we needed a place where we could view and edit them.
Users can now easily plot metrics inside of Worksheets with metrics from related resources, or even the metric datasets themselves. In Worksheets, related metrics are conveniently found in the sidebar and can be added with a simple click.
In this brief example, you can see just how easy it is to plot all inbound traffic for Pods on a specific Node by utilizing the related metrics found in the sidebar.
After users create a Worksheet visualization, they can edit the metric data with OPAL to customize it further by selecting “Advanced” in the “Visualize” tab.
Here we simply changed the rollup from “rate” to “max”, but this is just the tip of the iceberg when it comes to what you can do when visualizing metrics in Worksheets.
As exciting as plotting metrics are, users can also plot other, non-metric, datasets in Worksheets. Virtually any field from any dataset can be visualized with the simple click of a button.
Improved Metrics
As mentioned earlier, the improvement to metrics – how they are created and discovered – is directly related to the improvements we’ve implemented in Worksheet visualizations.
Metrics Discovery
Part of the reason we overhauled both was there wasn’t an easy way to discover metrics in Observe. Previously, to view metrics, users would define metrics using lengthy OPAL statements, then manually add those metrics in the form of cards to Resource Pages. Users were also limited in viewing these metrics by only being allowed to choose from a few pre-defined verbs and parameters.
To combat this issue, we’ve implemented a few solutions. The first mentioned earlier in the post, specifically how we exposed metrics of related Resources in Worksheets for quick and easy manipulation and visualization. The other big change we’ve made in metrics discoverability was to include a Metrics tab in the Explore page.
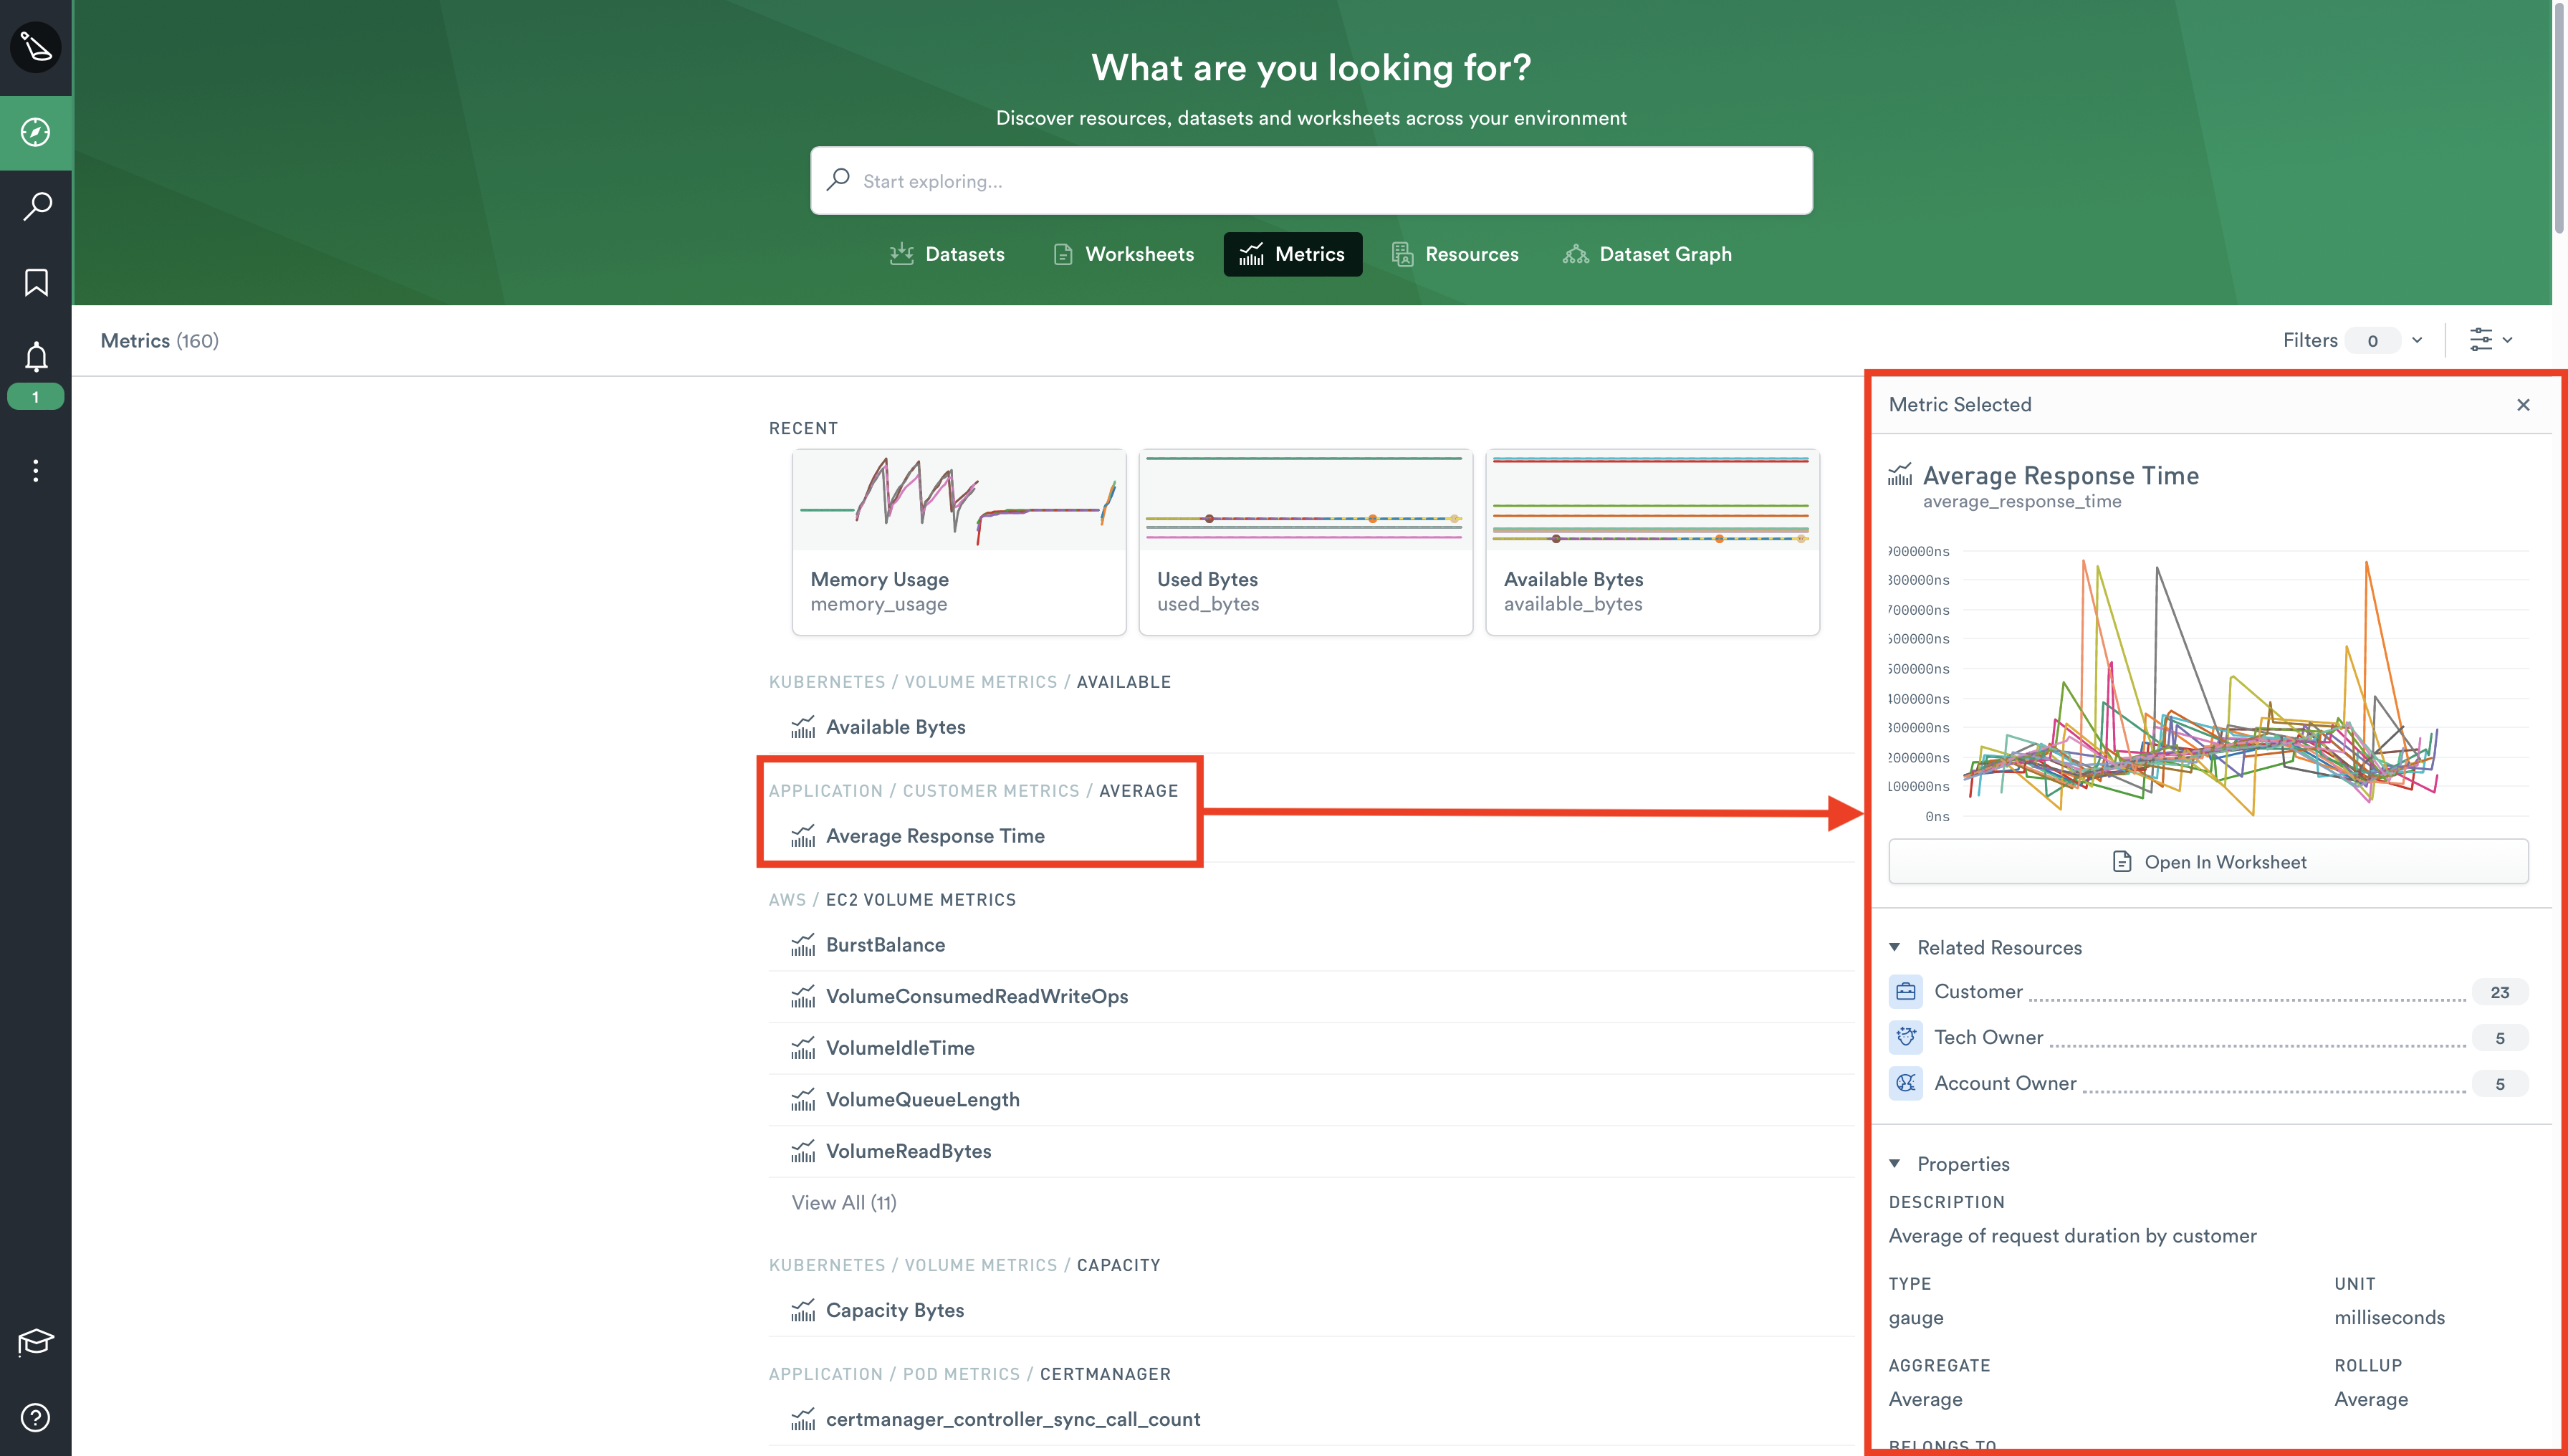
In addition to being able to quickly and conveniently find metrics all in one place, users can see a graph in the sidebar by clicking the metric, for a glance at metric data. From there users can open the metrics dataset into a Worksheet for further exploration.
Metrics Creation
As alluded to earlier in the Metrics Discovery section, the process for creating metrics was also fraught with tedium as lengthy OPAL statements were required for each metric a user wanted to create. Creating metrics is now easier in OPAL thanks to the metric discovery feature.
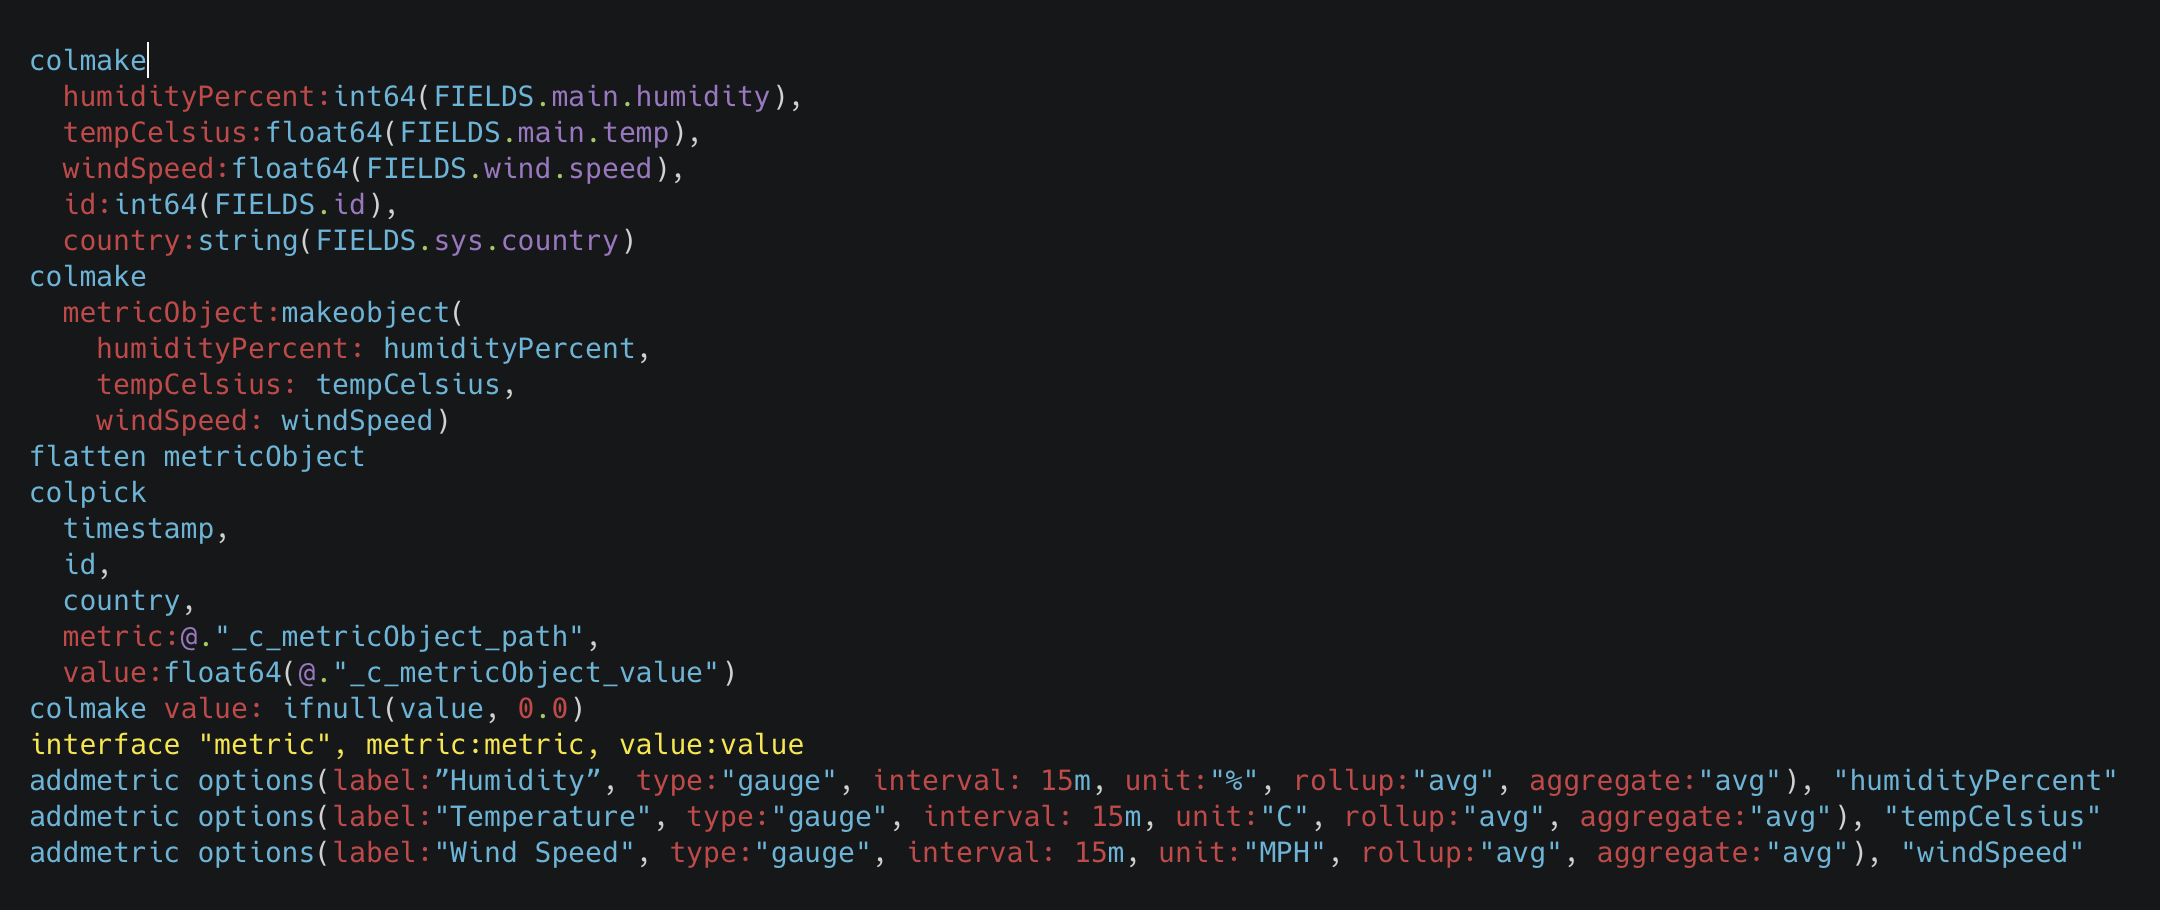
By automatically mapping metric fields found in the current dataset, the interface verb allows easy discoverability of metrics by Observe. After creation, these metrics can be found in the locations previously mentioned – both in Worksheets and in the metrics tab on the Explore page – with other metrics that Observe has previously discovered.
Updates to Monitors
Leaving the world of metrics and Worksheets, let’s take a look at the two recent changes to Monitors.
Notifications Preview
The process of creating monitors previously required a bit of guesswork as users received no feedback from their Dataset to inform them whether they’d chosen the right monitor type, or trigger conditions to get the notification they hoped for.
Thankfully, the guesswork has been removed, as users can now see a list of notifications that would have triggered right in the Monitor. With this list of notifications comes other useful data surrounding the notification like importance, description, etc.
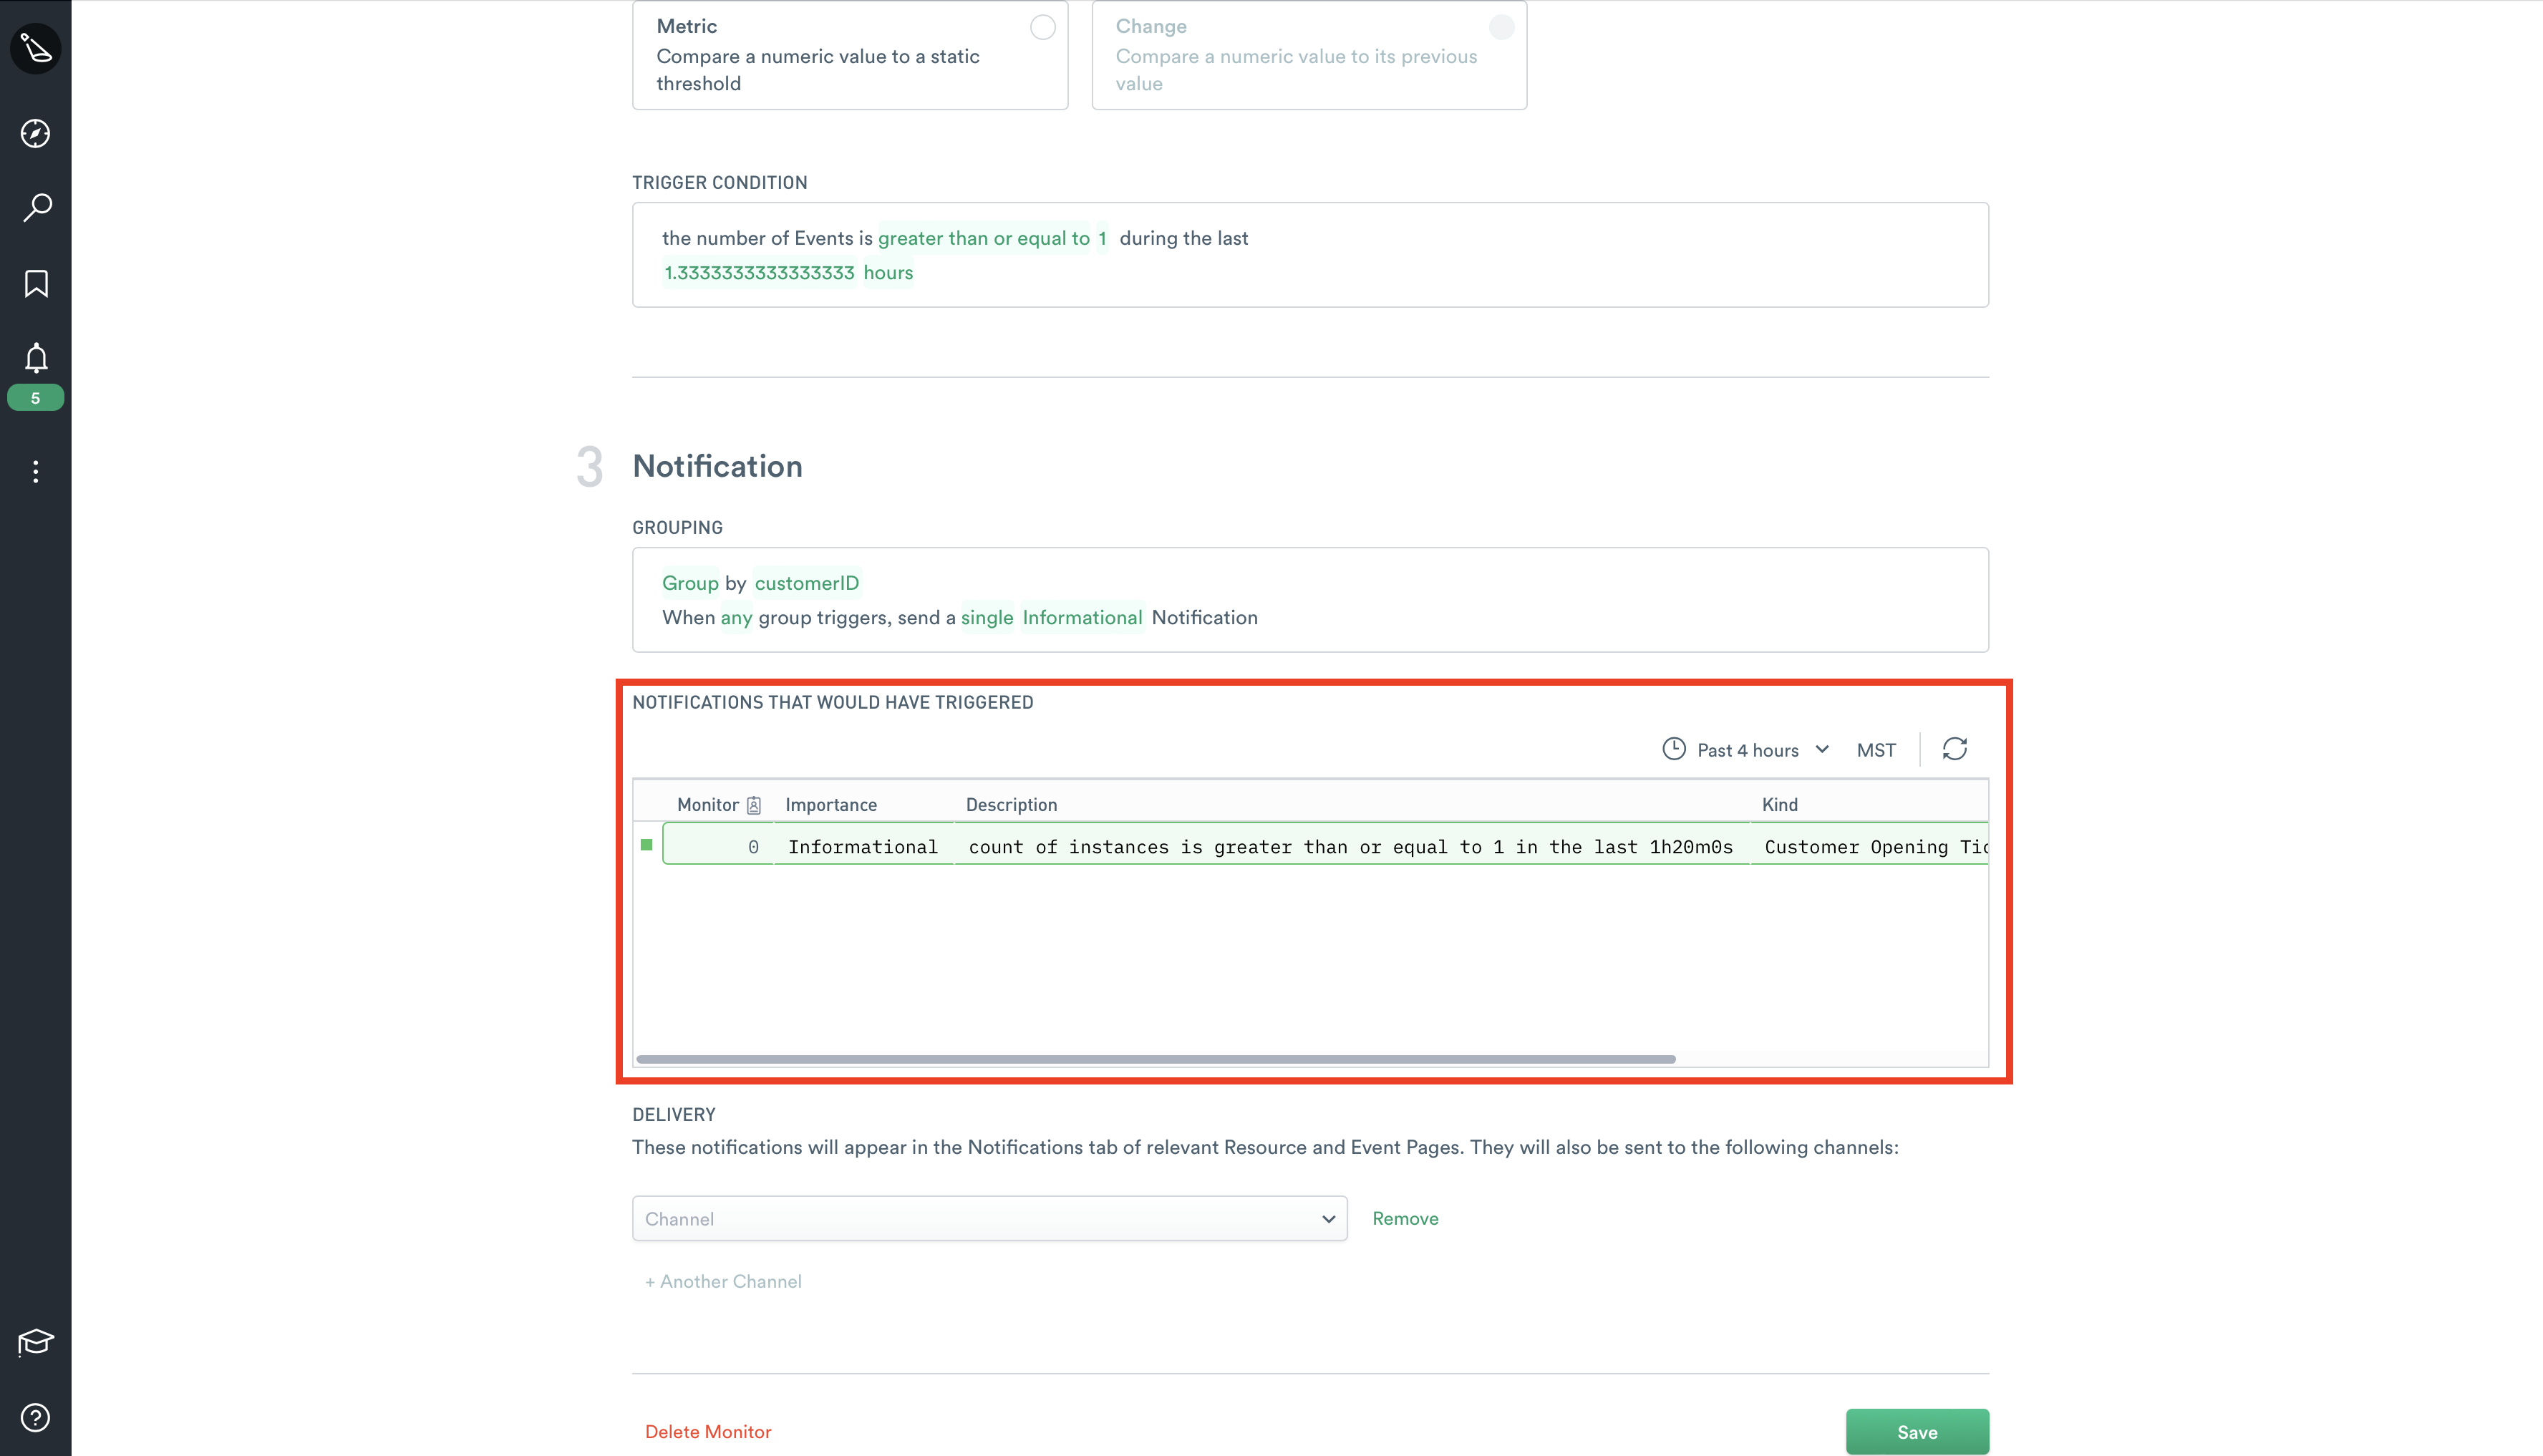
Here, users have the option to select a highly customizable time range to test the monitor conditions against previously seen behavior – crucial to dialing in a good monitor.
Channel Action Testing
The other big update to Monitors was around Channel Actions, and specifically how users can test them. Users now have the ability to send sample data, or data from actual Monitors, to test Channel Actions.
Before this update, users essentially would create a monitor, configure the message body (using a JSON-like template), hope it was properly formatted, and that it contained the right data when a notification or alert fired.
More!
Though we’ve already covered the larger of our updates, there are still quite a few minor updates that we’re excited about. These changes bring enhancements to the usability of Observe and provide more insight into usage, as well as increased security.
Observe Usage Data Worksheet
We now have a new module called Observe Usage to help users better understand the way they use Observe, and credit usage associated with those activities. This module includes the following five datasets.
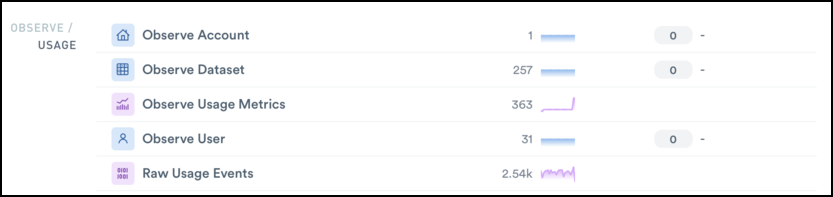
Perhaps the most useful of these new Datasets is the Observe Usage Metrics dataset. In it, you’ll find metrics related to transform credits, query credits, storage credits, and more. This enables you and your team to slice and dice usage data as you wish and gain insights such as:
- See transform credits per dataset, or by package.
- See query credit usage by user.
- Analyze storage usage over time.
That’s not to say the other Datasets aren’t useful, they provide extra context around the usage metrics users care most about in Observe. Here’s a list of the other datasets found in the module and what you can expect to find in them.
- Observe Account – Information related to your Observe accounts such as customer id, company name, and more.
- Observe Dataset – Credit usage related to Datasets in your Observe instance.
- Observe User – Basic user information for each user such as permissions, contact info, etc.
- Raw Usage Events – As the name suggests, this Dataset is a superset of the Datasets mentioned above and consists entirely of raw observations.
Show Surrounding
The last small, but incredibly useful, feature we’ve released is the Show Surrounding feature. This feature allows the user to select an event of interest, then show surrounding events within a specific time frame.
This is helpful for troubleshooting when users need more context surrounding an issue, but without having to dig through whole log files.
Conclusion
Believe it or not, there are still more updates we haven’t talked about – but there simply isn’t enough time! We seem to release features here daily and have no shortage of plans for the future.
Until then, we encourage you to get started with Observe today and check out these new features or one of our 250+ integrations for yourself!